Trades in Stock Options. Receive daily trade recommendations. Can you imagine discovering a way to trade that promises instant income? If you think such a method is impossible, think again. It is definitely achievable, and everything you need to know is available online for one low price that includes special three-part online webinars.
Ambush is a time-proven mean-reversion day trading System focused on a variety of Futures markets around the globe. With Ambush Signals you can now easily follow the Ambush System on a subscription basis for educational purposes.
If you didn't fail early in your trading business, then you have probably been around long enough to realize that many of the problems you encounter as a trader are those that derive from your own individuality. Such problems are common among traders and, in fact, common among all human beings. Seeking spiritual help from a power much greater than your own is the area I address in the "Spiritual Side of Trading".
In my book "Day Trading," I presented an idea for trading cluster breakouts in EUR/USD. This morning I was wondering if there were good cluster breakouts in other markets. I really needed to do some trading. When I go for a while without trading, the desire to do so becomes a persistent itch.
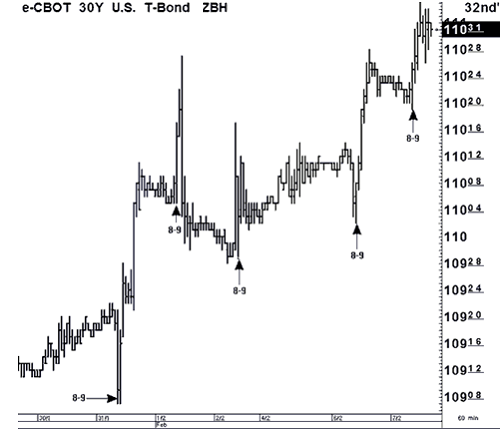
Lately, due to other commitments and activities, my trading time has been sparse and limited to experimentation with a stock trading idea which I continue to work on. This morning I took a look at Treasury Bonds to see if cluster breakouts would work well there. The chart shows what I discovered.
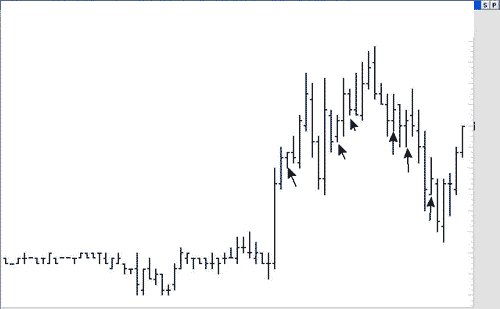
By cluster I refer to groups of rather small bars, more or less moving sideways. The idea is to wrap an envelope around the cluster and then trade a breakout of the envelope. I have marked the bars where the breakout occurred, and please note that these 60-minute bars all begin at the start of an hour, e.g., 8 AM to 9 AM.
It seems that in most cases, the move begins with the 8 AM bar or is completed by the 8 AM bar. Viewing from right to left, we see:
1. A violation of the cluster centered around 110^24 begins with the 8 AM bar and completes with the 9 AM bar.
2. The cluster centered around 110^11 is violated first by the 8 AM bar and later by the 11 AM bar.
3. The cluster centered around 110^02 is violated by the 8 AM bar.
4. The cluster centered around 110^07 is violated by the 8 AM bar.
Restricting your trading exclusively to one market may not be your best choice. Here are some reasons why:
You must not trade under pressure. Trading involves being eclectic and choosing only the best, most clear-cut trades in liquid, not overly volatile markets.
It is sheer folly to trade feeling that you have to make a certain amount of money each day, or that you have to make up for a previous day. Each day is its own day, and must be viewed as such.
Trading is not a job. If you want a job, go out and find one. Trading is to be done leisurely, with plenty of time in-between during which you do not trade at all. You cannot possibly be at your best all of the time while sitting and watching a screen. The pros typically trade a short period of the day, usually around the open, and then again at the close. That's why they last as long as they do. For those who stay in the market because they act as market makers, they trade their own money only when they can take advantage of you for a few ticks at various times during the day. Otherwise, they stand aside, waiting to fill orders coming in from the outside, which is what they feel they have to do.
There can be benefit in position trading various markets using the weekly chart and entering via the daily chart. If you are going to be a trader, you are going to have to learn to be an all-around trader, always going where there is money to be made. If you are going to stick with only one market, then you are going to have to patiently sit out those times and periods when it is doing nothing.
This is not the first time in my life that I've been unable to easily day trade in a particular market. I have seen markets that were virtually not tradable for more than a year. At some point they once again become tradable. During those periods in which a market became not tradable, if I wanted to day trade I had to look elsewhere. There have been other periods during which I could not trade at all. I will repeat a story here that I've told at many seminars. There was a time in the early 1970s (yes, those were the olden days before there was day trading), when I was able to make only one trade in an entire year. It came in November, and it yielded the only money I made that year. I was able to trade the following year, and then again the markets became very difficult to trade, and many traders simply disappeared from the markets and went home broke. Such is the life of a trader. That is why I had to learn to trade what I could, where I could, and when I could. Trading in itself can be seasonal. There are dry spells from time to time. What saved my neck in those days of lean opportunity? Trading spreads on futures contracts.
Philippe Gautier: Administration and New Developments
Developer: Joe Ross
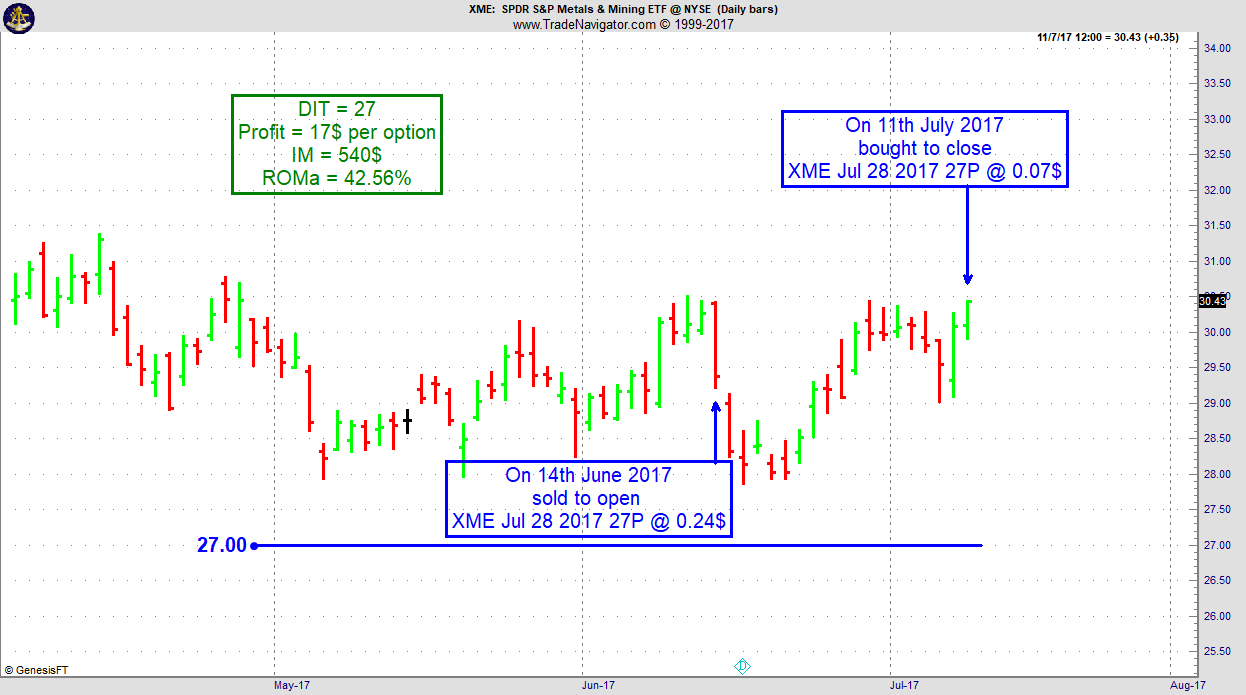
On 13th June 2017 we gave our IIG subscribers the following trade on SPDR S&P Metals & Mining ETF (XME). We sold price insurance as follows:
On 14th June 2017, we sold to open XME Jul 28 2017 27P @ $0.24, with 44 days until expiration and our short strike 11% below price action.
On 11th July 2017, we bought to close XME Jul 28 2017 27P @ $0.07, after 27 days in the trade.
Profit: $17 per option
Margin: $540
Return on Margin Annualized: 42.56%
Not all underlying stocks or ETFs go straight up after our entry. But as long as prices remain well above a well chosen short strike, the trade remains pretty safe and boring, like most of our trades.
We have also added new types of trades for our IIG daily guidance since 2016, "no loss" propositions with unlimited upside potential, still using other people's money to trade.
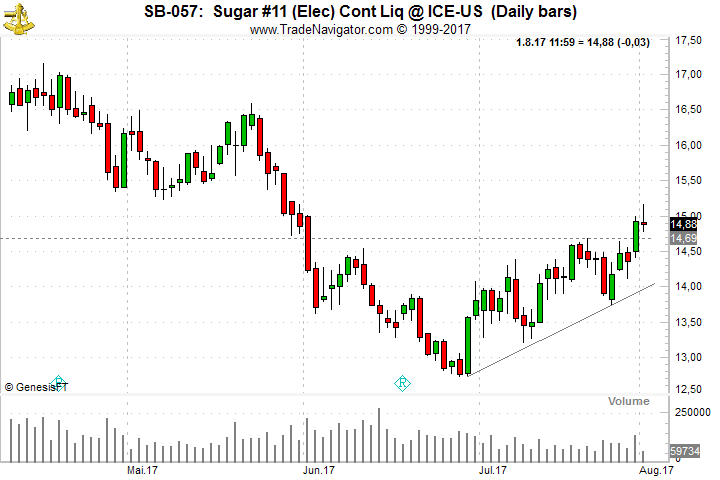
After a long down-move in Sugar from October 2016 until end of June, Sugar might be ready to push higher during the next few weeks or even months. On the daily chart below we can see, that we have entered an up-trend and after the break above 14.69 on Monday we might even move much higher at least up to 16.50.
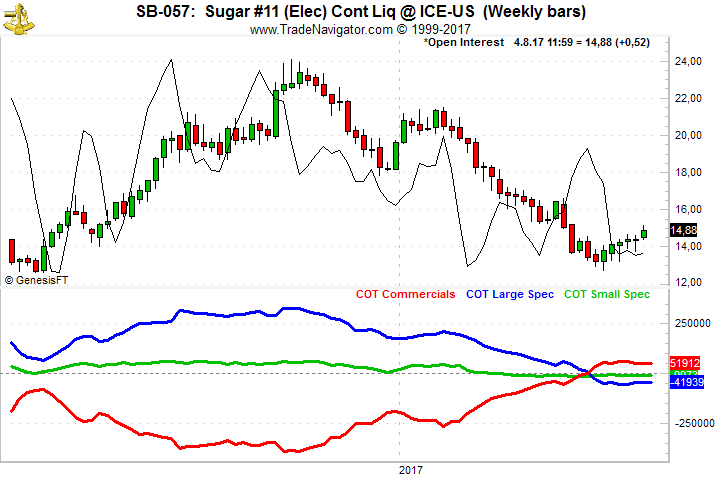
The main factor why we might see higher prices in Sugar comes from the net long positions of the Commercials which is the highest reading back to 1983.
Traders might want to put on a position on the re-test of the 14.70 level or simply put on a position at the current level.
Do you want to see how we manage this trade and how to get detailed trading instructions every day?
In this video, I talked about stop-losses in general, ways to decide on your stops that don't make much sense and other pitfalls like using breakeven-stops. Finally let me give you some insights on my own systematic approach regarding exits and how I like to decide where to put a stop-loss.
Feel free to This email address is being protected from spambots. You need JavaScript enabled to view it. with any questions or whatever is on your mind about trading.
To view previous published Chart Scan newsletters, please log in or click on "Join Us,"
shown above, to subscribe to our free "Members Only" section.
A WEALTH OF INFORMATION & EDUCATION:
Joe Ross-Trading Educators' popular free Chart Scan Newsletter has been published since 2004.
Note: Unless otherwise noted, all charts used in Chart Scan commentary were created
by using Genesis Financial Technologies' Trade Navigator (with permission).
Legal Notice and Copyright 2017 Disclaimer - Published by Trading Educators, Inc.
Chart Scan is a complimentary educational newsletter.
Let’s talk about reversal bars, which are important because they signify important changes in trends and swings.
Swings are much more common than are trends. Short-term to intermediate-term swings consist of a leg up and a leg down in the movement of prices. Long-term trends seem to be a thing of the past (unless driven by strong supply and demand factors), mainly because of the amount of information available to traders and also because of computerized and program trading.
I’ll explain more about swings, and then we can look closely at several types of reversal bars.
There are two basic configurations available for computerized trading:
Trend analysis
Value analysis
Both greatly affect what happens in today’s trading. Following is a somewhat simplified view of the outcome of these two types of computer-generated methods. Naturally, real supply and demand will always come into play when speaking of trends and swings.
There are only so many ways that anyone can detect a trend, especially when using a computer. What are the variables available for use? Open, High, Low, Close, Volume, and Volatility. There is little else of value.
These factors are integrated into moving averages of various kinds, but an examination will show little difference in the end result of each. We have:
Simple moving averages
Exponential moving averages
Geometric moving averages
I suppose by now there are even others. Moving averages are often turned into oscillators by the simple process of detrending them.
Next comes the question: How many ways can you massage this handful of variables in order to come up with a way to detect a trend?
The conclusion of it all is that virtually all trend-finding techniques are correlated. As soon as one computer algorithm detects a trend, so do most other computer algorithms. The result is a mass of buying coming into a move up, and a mass of selling coming into a move down. Instead of prices trending, they begin to move in the direction of the momentum detected by the computer algorithms.
Now, what about the computers programmed for value analysis? As prices move strongly upward, those computers programmed to look for relative value suddenly discover that prices are now too high. The value computers issue a sell signal. Buying and selling collide massively in some type of topping formation. Ultimately, selling overcomes buying, and prices reverse direction. Within a short space of time the trend-following computers detect the fact that prices are now moving down. They enter the market by selling, and prices drop until the value-programmed computers detect that prices are now too low relative to where they have been before. Value-programmed computers issue a buy signal and the swing—consisting of an up-leg and a down-leg—is now complete.
I admit this is a somewhat simplified view of what takes place, and, as mentioned earlier, a trend in either direction driven by true supply and demand factors will generally defeat the value-programmed computers so that the trend in prices will continue.
Regardless of whether prices turn at the end of a trend or whether they reverse as a result of the exhaustion of supply-demand factors, the turn is often marked by a reversal bar. Let’s look at those now. There are a number of different types, but all have a high degree of reliability and are generally low risk trades, due to the fact that a tight protective stop can be used.
In all cases of reversal bar entry signals, the best and most reliable signals take place after a strong swing or trend.
Reversal bars occur in all markets and in all time frames. Reversal bar moves generally are relative to the time frame involved. As a rule, the longer the time frame, the greater the move will be in the opposite direction. Such resulting momentum is naturally expected—a reversal bar on a monthly chart is logically greater than a similar move on a five-minute chart.
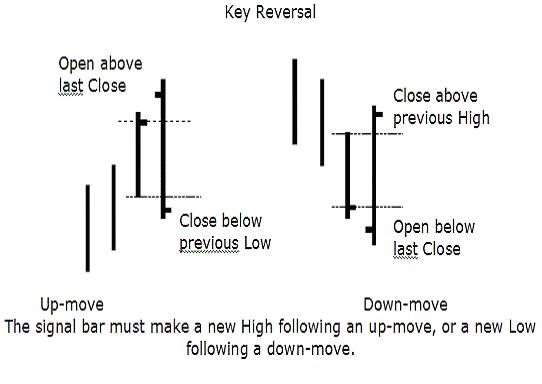
Key Reversal Notes:
After an up-move:
The Close must be lower than the previous bar’s Low
The price bar must make a new High
The Open must be higher than the previous bar’s High
After a down-move:
The Open must be lower the previous bars’ Close
The bar must make a new Low
The Close must be higher than the previous bar’s High
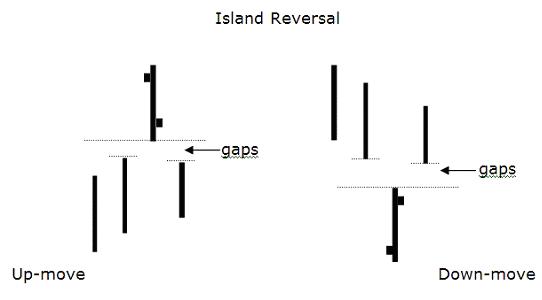
Island Reversal Notes:
After an up-move:
The bar’s Low is higher than the High of previous price bar and the following price bar (a gap on both sides of the reversal bar).
After a down-move:
The bar’s High is lower than the Low of the previous price bar and the following price bar (a gap on both sides of the reversal bar).
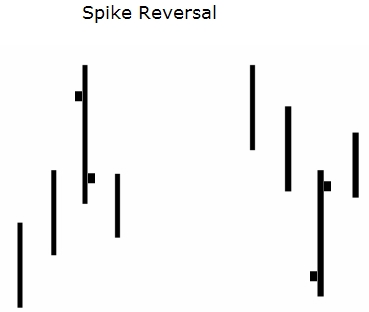
Spike Reversal Notes:
A Spike High reversal after an up-move:
Displays a High considerably above the price bars on either side.
An Open higher than the Close.
A Spike Low reversal after a down-move:
Displays a Low considerably lower than the price bars on either side.
An Open lower than the Close.
Reversals show a change in direction. Either the change is real or it isn’t. This is why you want to use a tight protective stop in trading them. You don’t want to give such trades much room. However, the percentages are definitely with you on reversal bars, so do a bit of testing for the market and time frame you wish to trade. You should be able to come up with a percentage of times that reversal bars will work in your favor.
I’ve shown the three basic types of reversals. There are of course, variations of these three. You can make your trading life much simpler by learning to use the Law of Charts and the Traders Trick entry. You might also want to consider taking one of our “Recorded Webinars”.
Being a contrarian trader means not just following the crowd. It means being willing to break the rules when necessary!
Statistics show that the “crowd” loses close to 80% of the time position trading, and very close to 90% of the time day trading. Why would anyone want to do what all those people are doing?
So, what is it the crowd is doing? For the most part they are struggling with Fibonacci numbers, a variety of indicators—some of which are proffered as having magical qualities—reading books by authors who never made it as traders, and thrashing around with mechanical trading systems, which are said to work all the time, when it is plain as the nose on your face that such a thing is impossible.
It seems that considering the high percentage of losers in this business you are repeatedly being warned that trading isn’t all that easy, and truthfully, it's much harder than it looks.
Think about it for a minute: If trading were easy, if it were really possible to make a lot of money quickly being a trader, why would anyone want to be a plumber, or an electrician, or an engineer, or ….
It seems that many traders fall into two categories. The first category is the wild gambler, who thinks rules have no meaning and wonders why anyone would try to set them. At the other extreme is the absolute conformist who tries to exactly follow the rules, as if there were some great virtue in doing that.
Have you ever run into a system trader who will boastfully tell you how proud he is of having stuck to a system with great discipline, following it exactly until he lost all his money? Bragging about his discipline as though it had some sort of virtue to it? In reality, that kind of trader is a lemming who happily runs off the edge of a cliff only to drown in a sea of his own stupidity.
Neither extreme is the best for trading. You don’t want to be a total rule breaker and you don’t want to be a total rule follower, and for sure you don’t want to follow the crowd because the crowd is usually wrong.
As a trader, you have to find the right balance between extremes—breaking and following rules—and following or not following the crowd. It takes maturity derived from trading experience, self-examination and a solid concerted effort to act independently, and it is essential to develop this skill in both those areas.
Following the crowd is a natural human tendency. It appears that there is safety and comfort in numbers. But such a situation is certainly not true in trading. Group dynamics just don’t seem to work very well when it comes to trading the markets. From time to time there have been partnerships that worked, but they are few and far between. In all the years I’ve been in the markets, I’ve known only one partnership that worked, and it was structured in such a way that one person did all the research and the other person made the trading decisions and performed the actual trading. Nevertheless, people somehow feel secure when they follow the crowd.
I grant you that not everyone follows the crowd in the same way or to the same degree, but it is the contrarian who views the crowd to see what they are doing, and then does the opposite. In my own case, I am contrarian in the following way: When everyone is hot to trade the e-minis, I avoid them, preferring to trade where the crowd is not looking. I find lots of great opportunities by looking around, being eclectic and discovering trades that meet my criteria for profit potential, tradability, and personal comfort.
I tend to be adaptive most of the time, adapting my trading management to setups offering me high potential for successful trades.
When the mob is losing their shirts in the e-mini, I am trading options with at least a 75% chance of producing a winner. When the crowd is thrashing around trying to daytrade forex, I am trading spreads with at least an 80% chance of bringing home a profit. I am not averse to trading anything, anywhere. I trade Exchange Traded Funds and individual shares. Why not? Some of them have excellent potential.
I find that instead of searching for opportunity, most of the people losing money in the markets are looking for rules to follow, indicators to dream up, and systems to pursue. The crowd spends an inordinate amount of time backtesting.
If you are going to trade, it is time to matriculate to the real world of trading. We are no longer in school or on the job where to be successful, it was critical to follow the rules and it might have been essential to protect your self-interests and stay within the parameters of acceptable behavior. In school and on the job it was important to develop a clear sense of individual values so that you could be somewhat self-sufficient within the boundaries of the group.
The contrarian trader is eclectic to the extent that he or she can follow the crowd when it seems right, but go his or her own way when it's necessary to protect self-interests. What the contrarian trader does that others will not or cannot bring themselves to do, is to go the opposite way when it seems that everyone else is going the same way.
Time and again history has proven that when everyone is buying and a market seemingly will never stop going up, that is the time to sell. And when something has sold down to the point where no one wants it and the media are all screaming out that it is the end for this market then it is time to take a trade the opposite way from the crowd, and become a buyer—that is what it means to be a true contrarian.
Contrarian traders heed the frequent warnings about the pitfalls of following the crowd. When no one wanted gold and the media screamed about how gold was a relic whose time had passed into history, it was buying time. When everyone was selling the Nasdaq and the media screamed “end of the world for tech stocks” it was again time to buy.
When you read in the media that a market it too volatile and too dangerous for trading and they flash warnings for their readers to stay out, that is the time to be looking to be an option seller. Options sellers make money by selling volatility. If you are a contrarian option trader, you aren't looking for safe markets. You are looking for volatility, reasonable risk, and a good chance for making a big profit. Most of the time, it means going your own way—the way that is opposite the mob.
Being a contrarian requires thinking like a contrarian, guessing what the crowd will do next, and anticipating how the movement of the crowd can benefit your trading.
When virtually everyone has taken the position that the market is headed in a particular direction, who is going to be left to push the trend further? It is precisely then that a countertrend begins and moves the market in the direction of the contrarian trade. The challenge is predicting when that turning point will occur, anticipating it, and developing a trading plan to capitalize on it.
Philippe Gautier: Administration and New Developments
Developer: Joe Ross
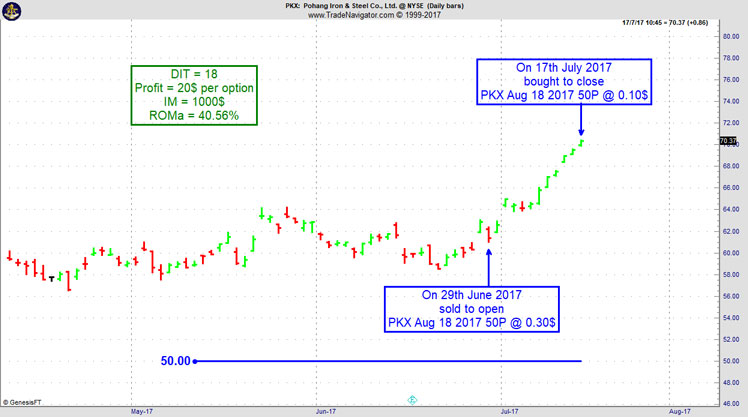
On 28th June 2017 we gave our IIG subscribers the following trade on Pohang Iron & Steel Co (PKX). We sold price insurance as follows:
On 29th June 2017, we sold to open PKX Aug 18 2017 50P @ $0.30, with 49 days until expiration and our short strike 20% below price action.
On 17th July 2017, we bought to close PKX Aug 18 2017 50P @ $0.10, after 18 days in the trade
Profit: $20 per option
Margin: $1,000
Return on Margin Annualized: 40.56%
With implied volatility extremely low, we still managed to sell price insurance 20% below price action and well below a major support level, making the trade particularly safe.
We have also added new types of trades for our IIG daily guidance since 2016, "no loss" propositions with unlimited upside potential, still using other people's money to trade.
I will answer some follow-up questions of a past video related to Pinbars, give recommendations on Forex brokers and why it's so hard to trade successfully on a 5-min chart. Enjoy!
Feel free to This email address is being protected from spambots. You need JavaScript enabled to view it. with any questions or whatever is on your mind about trading.
To view previous published Chart Scan newsletters, please log in or click on "Join Us,"
shown above, to subscribe to our free "Members Only" section.
A WEALTH OF INFORMATION & EDUCATION:
Joe Ross-Trading Educators' popular free Chart Scan Newsletter has been published since 2004.
Note: Unless otherwise noted, all charts used in Chart Scan commentary were created
by using Genesis Financial Technologies' Trade Navigator (with permission).
Legal Notice and Copyright 2017 Disclaimer - Published by Trading Educators, Inc.
Chart Scan is a complimentary educational newsletter.
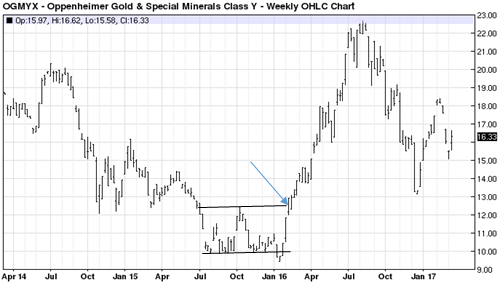
We received a question asking whether or not the Law of Charts works with Mutual funds. The answer is yes it does but the concept is more easily seen on a weekly chart because daily charts show only the Closing price for mutual funds.
The chart shown is Oppenheimer Gold and Special Minerals Class Y mutual fund, which rises when the with the price of gold and other minerals, and falls and falls when the price of gold and other minerals fall. Please note: Some mutual funds are inverse funds where shares in the fund rise when prices fall, and fall when prices rise. The chart shows the entry on a breakout from a Trading Range on exactly the 29th weekly bar. The breakout is that long bar you see as prices break through the Trading Range. The Law of Charts states that breakouts from consolidations are most likely to occur on bars 21-29.
The arrow shows a potential entry one tick above the high of the range. Notice that share prices have recently formed a 1-2-3 low.
Consider the following: As a trader you are in a business. Your strongest opponent has plenty of capital. He follows a program and he does it without emotion. He is totally aware of the fact that no one knows where the next tick will fall. Whereas he usually has good insights regarding the major forces that drive the market, he does not fool himself into thinking he can explain the vagrancies of price movement intraday or even from day to day. He knows that no one truly can. The successful trader has learned his lessons by actually trading. This is a business driven by fear, greed, and selfishness, and very few worthwhile pointers are given out by the industry, other traders, or the myriad of so-called trading gurus who plague the pages of trading magazines and pages of their websites. The most valuable information is closely guarded and not often put in books or on web pages. Learning about trading is a ‘forever’ experience. As the markets change and as we adjust to them, we learn. The learning is ongoing. It stops only when you no longer trade. During the time we trade we can always improve. Trading is a great business for those who master it, and those who master it are traders who have mastered themselves.
Philippe Gautier: Administration and New Developments
Developer: Joe Ross
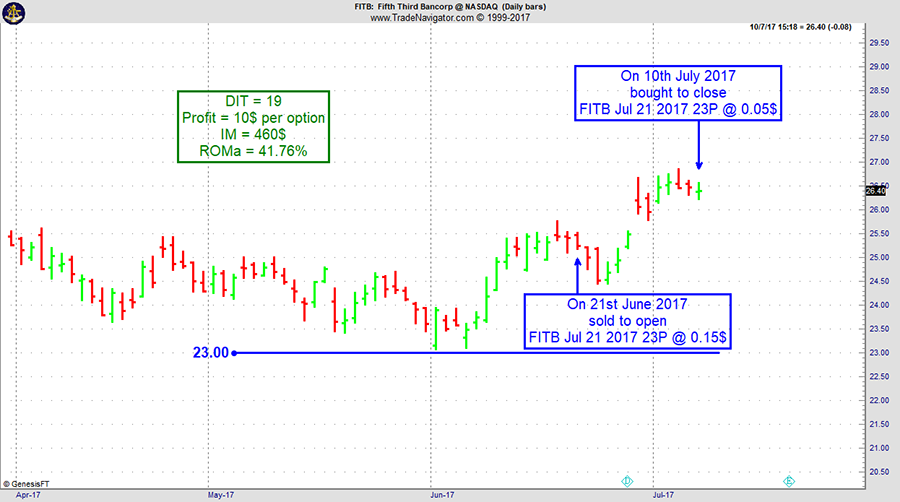
On 20th June 2017 we gave our IIG subscribers the following trade on Fifth Third Bancorp (FITB). We sold price insurance as follows:
On 21st June 2017, we sold to open FITB Jul 21 2017 23P @ $0.15, with 30 days until expiration and our short strike 10% below price action.
On 10th July 2017, we bought to close FITB Jul 21 2017 23P @ $0.05, after 19 days in the trade.
Profit: $10 per option
Margin: $460
Return on Margin Annualized: 41.76%
With implied volatility extremely low, we still managed to sell price insurance 10% below price action and below a major support level.
We have also added new types of trades for our IIG daily guidance since 2016, "no loss" propositions with unlimited upside potential, still using other people's money to trade.
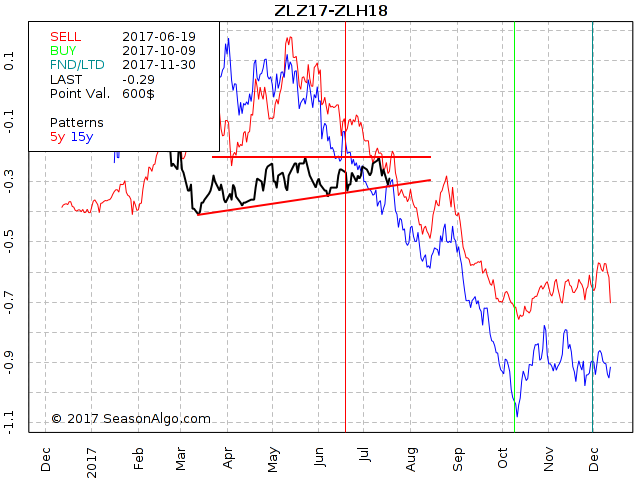
This week, we're looking at short ZLZ17 – ZLH18: short December 2017 and long March 2018 Soybean Oil (CBOT on Globex).
Today we consider a Soybean Oil calendar spread: short December 2017 and long March 2018 Soybean Oil (chart above). The spread has been trading sideways for a long time making slightly higher lows with highs around -0.2. For an entry it either needs to break to the down-side or move back up to the upper side of the range.
Also the seasonal statistic looks promissing with 14 winners during the last 15 years and a max. daily drawdown of only $192 in 2011.
Do you want to see how we manage this trade and how to get detailed trading instructions every day?
I would like to share a video that provides answers to trading related questions. Feel free to This email address is being protected from spambots. You need JavaScript enabled to view it. with any questions or whatever is on your mind about trading.
To view previous published Chart Scan newsletters, please log in or click on "Join Us,"
shown above, to subscribe to our free "Members Only" section.
A WEALTH OF INFORMATION & EDUCATION:
Joe Ross-Trading Educators' popular free Chart Scan Newsletter has been published since 2004.
Note: Unless otherwise noted, all charts used in Chart Scan commentary were created
by using Genesis Financial Technologies' Trade Navigator (with permission).
Legal Notice and Copyright 2017 Disclaimer - Published by Trading Educators, Inc.
Chart Scan is a complimentary educational newsletter.
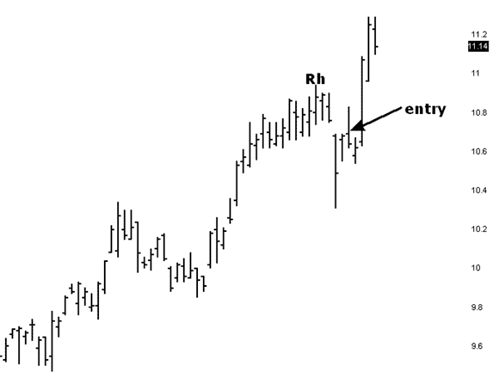
The chart below shows something I feel we need to learn about the Traders Trick (TTE). Prices reached a high of 10.94 and then retraced for two days. Those two days made identical highs [at 10.90]. Prices then dropped again, and again we had two identical highs [at 10.69]. The TTE rules say that after 4 bars of correction you are no longer to enter a trade based on the TTE. However, the rules also state that when expecting a continuation towards the upside, equal highs count as only one bar of correction (retracement). So, although we have 4 bars in the correction, because of the equal highs we count this as only two bars of correction. Now you can see why we made an entry 1 tick above 10.69. What happened afterwards is of no consequence to the rule I am showing you here. In accordance with your money and trade management, you made a little, took a loss, or made a lot on this trade. I will tell you only that we made a little.
Do you do an awful lot of research into a market before you attempt to take a trade in it? Do you look at fundamentals and try to glean as much information as you can about the underlying? Do you feel that you are doing a more than adequate job of information seeking, but are still not as much as a breakeven trader? Are you beginning to feel that you are doing something wrong?
Well, it could be that you are suffering from information overload. It could also be that you are gathering information about the wrong things. People have a tendency to believe that the accuracy of their trading increases with more information. This is one of the illusions of knowledge—that more is somehow better—that more information increases your knowledge about something and improves your decision- making ability. But that is not necessarily true—increased levels of information do not always lead to greater knowledge. There are three reasons for this. First, people tend to interpret new information as confirmation of what they previously believed. You believe what you want to believe—you are biased, even if you are not conscious of the fact. Second, some information doesn't help us at all in making predictions, and can even mislead us. Finally, we often do not have the training, experience, or skills to interpret the information correctly.
You have to closely examine the kind of information you are looking at and determine its real value to the markets you are trying to trade. I have seen traders keeping elaborate records of everything they are doing as they trade. They keep files full of articles and reference materials which they pore over prior to making a trade. But is all this really necessary? I doubt it. It is much better to trade what you see without having to find justification for every trade through research.
Philippe Gautier: Administration and New Developments
Developer: Joe Ross
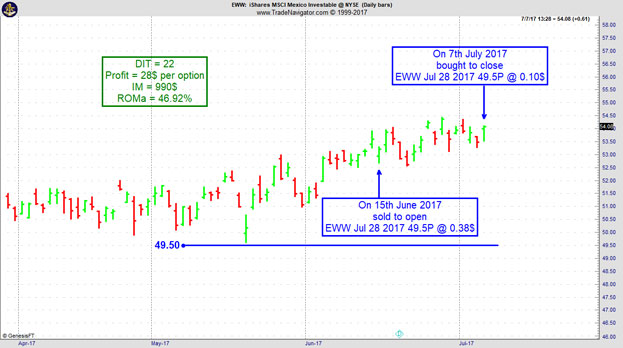
On 14th June 2017 we gave our IIG subscribers the following trade on iShares MSCI Mexico Investable ETF (EWW). We sold price insurance as follows:
On 15th June 2017, we sold to open EWW Jul 28, 2017 49.5P @ $0.38, with 43 days until expiration and our short strike 9% below price action.
On 7th July 2017, we bought to close EWW Jul 28, 2017 49.5P @ $0.10, after 22 days in the trade.
Profit: $28 per option
Margin: $990
Return on Margin Annualized: 46.92%
We have also added new types of trades for our IIG daily guidance since 2016, "no loss" propositions with unlimited upside potential, still using other people's money to trade.
The winning rate or percentage of winning trades are very common statistics. And while it can be a useful metric, it can also be misleading, so let's have a look!
The winning rate or winning percentage tells you how much percent of the trades in a backtest (or real past trades) have been winning trades. So if you have 100 trades in total, and 75 of those trades closed with a profit, you have a winning rate of 75%. Now the first thing to notice here is how those winning trades are defined. Are breakeven-trades included? What about commissions? If you have 100 winning trades in the E-Mini Dow Future and each of those trades was closed at 1 tick profit ($5) and you pay $7.50 per round turn, you actually lost money even if you hit your profit target 100% of the time.
Which leads us to the next question. What was your profit to loss ratio? Without knowing how much money was made on the winning trades and how much was lost on the losing trades, the winning rate is completely useless. Here’s an extreme example. Let’s say you have 90 out of 100 winning trades, a winning rate of 90%. Sounds great right? But what if on average you had an average profit of $100 per winning trade ($100 x 90 = $9000) but an average loss of 1000$ per losing trade ($1000 x 10 = $10000)? Right, you'd have lost $1000 even with a winning rate of 90%. Of course, this also works the other way around, if you only have 10% winners, but those are 10 times the size of your 90% losing trades, you’ll come out ahead!
Don't forget to always have a look at the profit/loss ratio and don't get all excited right away if you see a very high winning rate.
To view previous published Chart Scan newsletters, please log in or click on "Join Us,"
shown above, to subscribe to our free "Members Only" section.
A WEALTH OF INFORMATION & EDUCATION:
Joe Ross-Trading Educators' popular free Chart Scan Newsletter has been published since 2004.
Note: Unless otherwise noted, all charts used in Chart Scan commentary were created
by using Genesis Financial Technologies' Trade Navigator (with permission).
Legal Notice and Copyright 2017 Disclaimer - Published by Trading Educators, Inc.
Chart Scan is a complimentary educational newsletter.
I had a bit of fun scalping the eMini S&P 15-minute chart. I figured out that the best time to do it was between 07:30 AM U.S. and 14:45 PM (Central Time). Sometimes the best trades are made simply by just looking around for stuff to do, and what I saw in the eMini S&P from past days gave me a chance to test a strategy I was thinking about using.
Caution: When using a strategy such as the one I will show you, don't expect it to work all the time, or for a very long time. No doubt, shortly after this issue of Chart Scan comes out, it will stop working. Do you want to know why? It's because if a lot of people jump onto it, the market will adjust, and the strategy will stop working.
There is a wise saying which came into being primarily since the advent of mechanical trading systems, and it goes something like this: "Your system will stop working when someone else builds his system based on your system." Can you see the truth in that? It is because of that reality that it is best to scout around for what may be working recently, and why it is a waste of time to backtest a system or method to see if it has worked for the last 10 years. You can't trade history you are forced to trade the present in an attempt to take advantage of the future.
When scalping, it is vital to understand the mind set needed for this kind of activity. You must not allow yourself to look for the big trade. You must not allow yourself to look for how much you can make by riding a winner. The discipline calls for seeking a set number of ticks, pips, or points, and then taking your money. You must have absolutely no regrets about missing out on what happens after you have taken your money--you must exit at your money objective. This is not to say that you cannot come up with a management scheme that allows for only part of your money to be taken at an objective, and then developing a scheme for trailing a stop in case the move continues. You might even have two objectives for a trade, maybe more.
The idea behind a scalp trade is to find a very high percentage trade and then use a lot of shares or contracts, so that you make a pile of money on only a very small move. You have to be fast, so I suggest you do this kind of scalping only in fully electronic markets like the eMini S&P. Also, be sure there is sufficient volume to enable your scalp. You will be badly hammered by the market if you go long with a lot of size in a market that is not trading sufficient volume to handle that size in the time interval you are trading.
Example: A market is trading a volume of only 70 contracts in a 15-minute period, and you enter with a 50 lot. You will definitely move the market, and there will be only 35 potential fills to take the other side of your trade. You would be overtrading.
Example: A stock is trading a volume of 9,000 shares in a 15-minute period, and you decide to enter a trade for 5,000 shares. Do you see what will happen to you? There are only 4,500 potential fills for your position. You would be overtrading.
With those things in mind, and probably a few I've forgotten, let's look at how I traded the eMini S&P.
I have placed arrows pointing to the available trades. My objective was to get .75 per trade on a lot of contracts. There were 6 trades in all, and 100% winners. One of the trades made only .50 and one made only .25. The remaining 4 trades made .75. Total made was 3.75 points. On the surface, that is not a lot for a day's work. But I did a lot of contracts. I'm not telling how many, but you can figure out for yourself how many you need to do. If you wanted to make $1,875 you would have had to trade a 10 lot. Of course, that would have been the gross amount. Commissions and fees would have reduced your take-home pay.
What was the magic method? Here it comes, but it is not the Holy Grail of trading. The five trades were all breakouts of inside bars, bought or sold at the high or low of the inside bar. Take a look:
What does all this have to do with the Law of Charts? The Law of Charts states that the breakout of the high or low of any bar is an entry signal. In my book Day Trading, I describe major, intermediate and minor entry signals. Every book or article I've written, every seminar or webinar I've given, is and has been, in one way or another, based on the Law of Charts. If you haven't studied it, get it. There is no charge for it.
Dear Joe, Sometimes I absolutely dread sitting down to trade. I have had so many bad experiences that I’m not sure I can pull the trigger. Is there anything I can do about it?
What happens to us as we trade colors the way we see things in the market and influences the way we approach them. We take a big hit in a particular market, and we decide never to trade there again. Or, when we have a great trade in a market, it produces pleasure, so we try to trade there again as soon as we can.
How do you envision the markets overall? More importantly, how do you conceive of your role in the market? Do you see the markets as potentially hazardous arenas in which you must be very, very careful? Do you see them as though everyone in them is out to take your money? Or do you view them as a place in which there is dynamic profit opportunity?
Each time you sit down to your trader workspace, do you feel uncomfortable and wish you were somewhere else? Or are you really eager to jump into your work, look over your charts, and get down to trading? Does plowing through new material feel like a lot of hard work, or does it excite you to learn new information that will add to your ability as a trader?
The way you envision the markets will have a powerful influence on your actions! So it's absolutely necessary for you to be very much aware of just what your perception is and what past experiences colored your perception. You need to honestly assess your vision of - and feelings towards - the markets and your role in them. It will surely be time well spent.
Here's something to think about: the longer you sit in front of your screen, the more bad experiences you are going to have. The thing that defeats most day traders is that of overtrading. As you continue to sit in front of your trading screen, your focus and your sensibilities become increasingly numb. The longer you sit there, the more the probabilities increase in favor of your making bad decisions and wrong trades.
Let me ask you a question that may put the entire situation into perspective for you. Have you ever seen old people in a nursing home sitting hour upon hour staring at the TV screen? If you haven't, can you picture what it would be like? Almost everyone has seen people who either by choice or circumstance, sit all day watching TV. They sit and watch the "boob tube" hour after hour. What do you suppose this is doing for their minds? Do you think they are becoming increasingly sharp? Is sitting there all day helping them to grow? What would you say is happening to their minds? Are they not going to suffer from an increasing amount of atrophy as they fail to think - as they fail to use their minds?
When I see a trader sitting in front of his trading screen all day long, it generates the same kind of picture for me as when I see someone watching TV all day. They are destroying their minds. At least with TV you might learn something. But what are you learning watching a cursor tick up and down hour after hour?
Trading is a terrible occupation if all you do is trade. Taking signals from a mechanical trading system is one of the most mind numbing, emotionally crippling things anyone can do. The shorter the time frame being watched, the worse it is. Is it any wonder that 90% or more of wannabe day traders last only 3-6 months in the market?
A successful trader has two major things going for him/her: 1. Plenty of money to have an excellent life-style. 2. Plenty of time to do some good in this world. But if you sit and trade all day, what do you have to show for it in the end? What have you produced that is of benefit to anyone but yourself?
I'll let you answer that. But my suggestion to you is that you strive to trade less, not more. Learn what the good trades look like, and then trade them only when they occur. And when they do occur, focus your money - trade as many contracts on the good trades as you can. Don't trade more of the time on lots of trades, trade lots of contracts less of the time on the good trades.
Use your time and money to help those less fortunate than you. After all is said and done, it is more blessed to give than to receive. Do you know what the word "bless" means? It is a verb meaning to "make happy." Paraphrased, that old saying translates to "you will be a happier person if you 'give,' than if all you do is strive to 'get.'" But if you are busy spending all your time on a 1-minute chart trying all day long to get, you're not going to be able to get much of the happiness that is available from giving.
Philippe Gautier: Administration and New Developments
Developer: Joe Ross
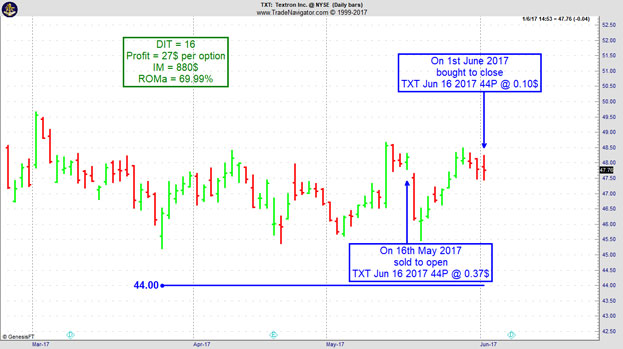
On 15th May 2017 we gave our IIG subscribers the following trade on Textron Inc. (TXT). We sold price insurance as follows:
On 16th May 2017, we sold to open TXT Jun 16, 2017 44P @ $0.37, with 30 days until expiration and our short strike 8% below price action.
On 1st June 2017, we bought to close TXT Jun 16, 2017 44P @ $0.10, after only 16 days in the trade, for quick premium compounding.
Profit: $27 per option
Margin: $880
Return on Margin Annualized: 69.99%
We have also added new types of trades for our IIG daily guidance since 2016, "no loss" propositions with unlimited upside potential, still using other people's money to trade.
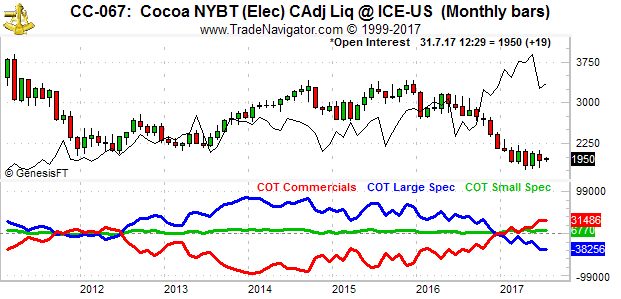
This week, we're looking at Cocoa trading at the ICE. What caught my first attention was the net long position of the Commercials. As you can see on the chart below it is at an all time high with the Large Specs at an all time low.
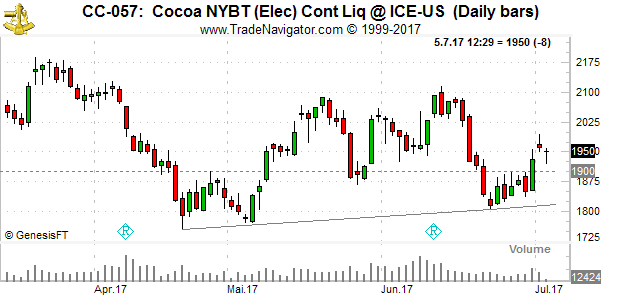
On the second chart below you can see that we are (slightly) in an up-trend since April with making (slightly) higher lows. The break above 1900 might be another sign for Cocoa to move higher.
Because of above reasons you might want to look into selling Cocoa puts using a far out of the money strike price. I’d prefer the December puts with a delta of about 10.
Do you want to see how we manage this trade and how to get detailed trading instructions every day?
In this video Marco reviews an "Outside Bars" pattern as an entry signal. He shows you how if it works as an entry signal in the Russell 2000 Mini Future and how to evaluate entry signals in general by using a systematic approach.
To view previous published Chart Scan newsletters, please log in or click on "Join Us,"
shown above, to subscribe to our free "Members Only" section.
A WEALTH OF INFORMATION & EDUCATION:
Joe Ross-Trading Educators' popular free Chart Scan Newsletter has been published since 2004.
Note: Unless otherwise noted, all charts used in Chart Scan commentary were created
by using Genesis Financial Technologies' Trade Navigator (with permission).
Legal Notice and Copyright 2017 Disclaimer - Published by Trading Educators, Inc.
Chart Scan is a complimentary educational newsletter.
"Teach our students the truth in trading - teach them how to trade,"
and
"Give them a way to earn while they learn - realizing that it takes time to develop a successful trader."
Derivative transactions, including futures, are complex and carry a high degree of risk. They are intended for sophisticated investors and are not suitable for everyone.
There are numerous other factors related to the markets in general or to the implementation of any specific trading program which cannot be
fully accounted for in the preparation of hypothetical performance results, and all of which can adversely affect actual trading results.
For more information, see the Risk Disclosure Statement for Futures and Options.