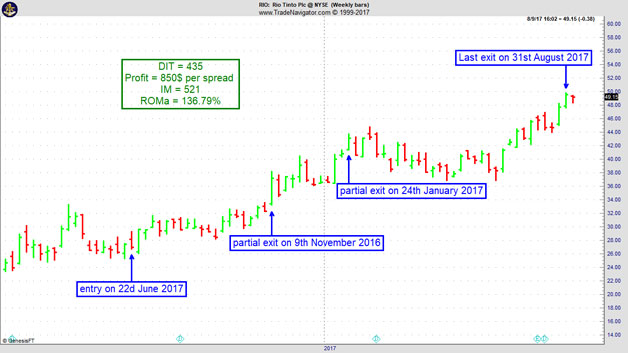
Trades in Stock Options. Receive daily trade recommendations. Can you imagine discovering a way to trade that promises instant income? If you think such a method is impossible, think again. It is definitely achievable, and everything you need to know is available online for one low price that includes special three-part online webinars.
Ambush is a time-proven mean-reversion day trading System focused on a variety of Futures markets around the globe. With Ambush Signals you can now easily follow the Ambush System on a subscription basis for educational purposes.
If you didn't fail early in your trading business, then you have probably been around long enough to realize that many of the problems you encounter as a trader are those that derive from your own individuality. Such problems are common among traders and, in fact, common among all human beings. Seeking spiritual help from a power much greater than your own is the area I address in the "Spiritual Side of Trading".
There isn't one “correct” way to trade the markets. While it may be tempting to emulate your favorite “Market Marvel”, in the end it’s really crucial to match your trading style with your personality. Some traders are methodical and almost compulsive in their tactics, carefully backtesting their strategies, scrutinizing all possibilities and taking sound precautions to ensure success. Other traders are more laid back, taking risk and uncertainty in stride, confident enough to formulate trading plans as they go along, finding opportunity as it happens. Again, there is no best approach. The approach you use to trade the markets depends on your unique personality and what you are comfortable with.
Above all, to trade successfully, the critical requirement is self-confidence. Developing a sense of confidence requires the accumulation of real life experience – becoming acquainted with various market conditions and discovering how you react to them. Once you have rock solid confidence based on copious experience, the way you approach trading is a matter of preference.
It is vital to your performance to be yourself, and not try to be someone you aren’t just because you think there’s ultimately a “right” way to trade. You must discover what works best for you, and what you need to do to trade profitably. The only standards that matter are your own.
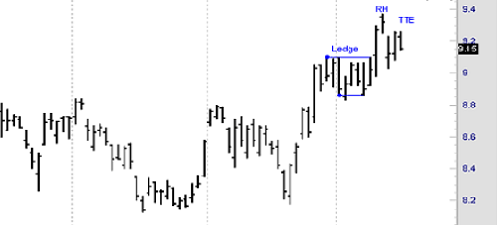
Prices for a stock I was trading broke out of an extended trading range on September 27, 2015. Almost immediately prices began to form a nine bar ledge with matching highs at 9.10 and matching lows at 8.87 and 8.86. The Law of Charts states that a ledge formation must contain at least four price bars, but no more than ten price bars. Prices broke out to the upside of the ledge on the tenth bar (October 11, 2015), and were followed the next day with the recent high. The Law of Charts states that the first failure of prices to continue in the direction they were going subsequent to the breakout of a ledge constitutes a Ross hook. There was a potential double high Traders Trick entry to go long showing on the chart. A breakout one tick above the double high at 9.26 offered a consideration to buy at 9.27. However, as we show in our online seminar Traders Trick, Advanced Concepts there are refinements that can make the probabilities for a winning trade approach the 90th percentile.
Notice also that entry on the breakout from a ledge is taken only in the direction of the previous trend or swing.
The single most important component of the personality related to personal achievement is self-esteem. Self-esteem is simply how much an individual likes himself and correlates to high achievement on a one-to-one basis. The more an individual likes himself the higher levels of performance he can achieve in any area of his life. Traders should always have at least one physical or mental activity every week that helps them feel good about themselves, like chess or golf. After a trader takes a loss or makes a mistake, he should consider going to a mirror looking himself in the eye and repeating the phrase, “I like myself,” with intensity, at least five times. This should boost the trader's self-esteem despite his losses, assuming he committed no trading discipline violations.
To reach high performance and personal achievement, understanding the three components of the self-concept is beneficial. The Ideal Self is a mental picture of the trader a person would like to become, a composite of the all positive qualities admired in other traders. Schwager's “Market Wizards” is filled with these admirable characters with their winning personalities. The Self Image is the inner mirror of the person a trader thinks he really is, and relates how he interacts with others on a day-today basis. A person seldom reaches levels of achievement beyond his self-image limitations. The Self-Esteem is how much a person likes himself. The more a person likes himself the higher levels of achievement are possible. These three components of the personality are always changing every moment. The self-aware trader shapes these personality components to compliment his goal achieving efforts to profitably trade the markets.
Ambush made new all time equity highs! Be on the lookout for Special Pricing in next week's newsletter with Marco Mayer's Ambush ebook and Ambush Signals.
Learn all you need to know about our Ambush Signals service during this presentation by Marco Mayer. What is the Ambush System, what's the idea behind it and how does Ambush Signals make trading Ambush so much easier!
To view previous published Chart Scan newsletters, please log in or click on "Join Us,"
shown above, to subscribe to our free "Members Only" section.
A WEALTH OF INFORMATION & EDUCATION:
Joe Ross-Trading Educators' popular free Chart Scan Newsletter has been published since 2004.
Note: Unless otherwise noted, all charts used in Chart Scan commentary were created
by using Genesis Financial Technologies' Trade Navigator (with permission).
Legal Notice and Copyright 2017 Disclaimer - Published by Trading Educators, Inc.
Chart Scan is a complimentary educational newsletter.
I know I often write about spreads, and it is because there are some important lessons to be learned about spread trading. One of my favorites is learning to spread when I need more time for a market to decide which way it wants to go.
One day, I got myself tangled up short in a May silver futures trade. Due to circumstances beyond my control, I ended the day still in the market with May silver going nowhere. It was struggling to find direction, but it didn't seem to be going anywhere.
I found myself down a bit by the end of the day and, because sometimes I am persistent in trying to turn a trade into a winner if I can find a way, I decided to spread off by going long the July contract. I was down only a few ticks, and prices were not yet close to my stop loss when I entered the spread long July and short May. The chart shows what happened. I got out with a win, and now I'm standing aside until things begin to rock and roll once again. Sometimes you get lucky!
Why do traders bail out of some markets to go to other contracts? Wouldn’t it be better to learn one market and stick with it?
The main reason traders bail out of a market is that they are not making any money. This has happened in various ways. In the currencies in the 1990s, for instance, lot sizes became too big for the market movers to fade (take the opposite side). The big players did not want to fade the trades of the smaller locals in the pit. In some instances, the smaller locals were standing around with their hands in their pockets for lack of something to do. Some locals were forced into conglomerates that took away their freedom to trade as they pleased. If they wanted to stay in the pit, they had to team up with other traders and together, as a group, they would fade the large orders that were/are coming into the pit. This meant that the biggest of the small traders would fade let's say a 500-lot order. He would then parcel out all the contracts he didn't want to the smaller traders: “Okay, you take 50, and you take 20, and you take 10, and you take 30,” etc.
If you didn't take what was parceled out to you, you would never again trade in the pit. It was either take it, or get out of the pit. No one would trade with you if you refused even one segment that was parceled out to you. That’s not exactly a free market type of situation. If you lost, then the "boss" trader would try to make it up to you, but this was seldom possible. In other words, your own trades depended entirely on someone else's judgment and ability to trade. The end result was the beginning of Forex as a major venue for currency traders. What happened then is that many currency traders moved to other markets.
What are the pit traders doing now that the best markets have moved to electronic trading? Just as with anything else, if you can't make money where you are, you move on. Some are moving on to other careers. Others are trying for success through trading from a screen. But here's a startling statistic: "Ninety percent of pit traders fail at trading from a screen."
So why does anyone leave one market for another? You leave when you can no longer make money. In 2003 I stopped trading the e-mini S&P 500. I was unable to make money there. That is not to say that others can't make money there, but for the way I like to trade, I had to move to other markets, and I found plenty of other markets in which to trade. To some extent, I had to change my trading style in order to succeed, but the changes were minor. I went from trading only the S&P 500 in open outcry to trading several markets other markets electronically. Being eclectic, I go where I am able to succeed.
Philippe Gautier: Administration and New Developments
Developer: Joe Ross
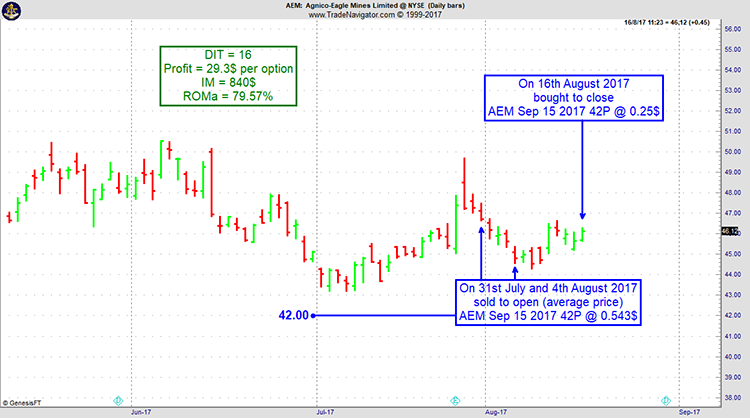
On 30th July 2017 we gave our IIG subscribers the following trade on Agnico-Eagle Mines Ltd (AEM). We sold price insurance as follows:
On 31st July 2017, we sold to open AEM Sep 15 2017 42P @ $0.435 (average price), with 45 days until expiration, with our short strike about 11% below price action.
On 4th August 2017, we sold to open AEM Sep 15 2017 42P @ $0.65 on a GTC order for the second half of our position.
On 16th August 2017, we bought to close AEM Sep 15 2017 42P @ $0.25, after 16 days in the trade for quick premium compounding.
Profit: $29.30 per option
Margin: $840
Return on Margin Annualized: 79.57%
We have also added new types of trades for our IIG daily guidance since 2016, "no loss" propositions with unlimited upside potential, still using other people's money to trade.
Drawdowns are an unavoidable fact in trading that's tough to deal with. But you probably already noticed that and might have encountered some of the serious issues this can lead to during your trading career. Maybe you tend to stop trading a system or switch systems always at the wrong time. Or worse. But as I've written about these issues before, here's a mindset that has helped me a lot to deal with drawdowns in the long run.
Things got a lot easier for me once I started to treat trading a system or just following a specific trading plan or strategy like an investment. Let me explain.
Let's say you believe in the success and growth of a certain company, Apple for example. Therefore you decide to invest a certain amount of money in it and buy the stock. You get in at $100. Right after you bought the price of the stock goes down to $95. You're down 5% and probably a little bit disappointed about your bad timing. If you're sane that's where you stop worrying. You won't start questioning your investment because the price of the stock dropped $5. You still believe in the company, nothing fundamental changed so you just keep your stocks. A year later Apple trades at $140 and you're quite happy but it might have been a volatile journey up to $135 during the year. Again though that's no big issue as you expect this. Stock prices can be volatile and you don't expect them to move higher in a straight line!
Why not apply the same mindset to trading a system? Take a certain amount of money and invest it into the strategy. As long as you believe in the strategy and the drawdown is within what you expect, why worry? Just keep on trading it, stop worrying about the daily ups and down and questioning it on every little drawdown. Of course, if something fundamental changes or you hit unexpected drawdowns you act. But otherwise, it really helps to treat it like an investment, leave it alone and let it do its thing.
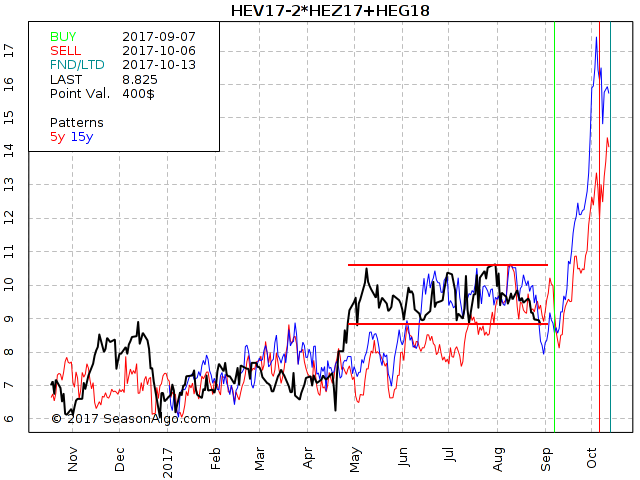
This week, we're looking at the HEV17 – 2*HEZ17 + HEG18 Butterfly Spread: long 1 October 2017, short 2 December 2017, and long 1 February 2018 Lean Hogs (CME on Globex).
Today we consider a Lean Hogs Butterfly Spread: long 1 October 2017, short 2 December 2017, and long 1 February 2018 Lean Hogs (elec. symbols: HEV17 – 2*HEZ17 + HEG18 or HEL1V17 on CQG). The Butterfly Spread has been in a range since May as you easily notice on the chart above. For the next few weeks, the spread usually moves to the up-side as shown by the blue (15 year seasonal) and red (5 year seasonal) line on the chart. Will this also happen this year? Of course, we never know for sure but the spread closed higher on 10/06 compared to 09/07 during the last 20 years. Statistically speaking, there is a high chance we will see higher prices of the spread during the next few weeks.
Happy trading,
Andy
Do you want to see how we manage this trade and how to get detailed trading instructions every day?
To view previous published Chart Scan newsletters, please log in or click on "Join Us,"
shown above, to subscribe to our free "Members Only" section.
A WEALTH OF INFORMATION & EDUCATION:
Joe Ross-Trading Educators' popular free Chart Scan Newsletter has been published since 2004.
Note: Unless otherwise noted, all charts used in Chart Scan commentary were created
by using Genesis Financial Technologies' Trade Navigator (with permission).
Legal Notice and Copyright 2017 Disclaimer - Published by Trading Educators, Inc.
Chart Scan is a complimentary educational newsletter.
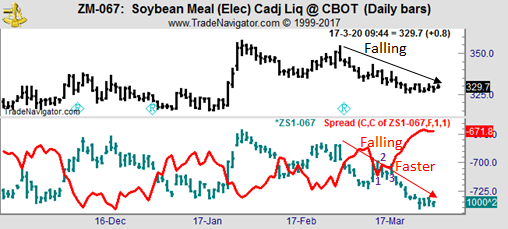
A spread can be profitably entered even though prices on both legs of the spread are moving down. As you can see both soybean meal and soybeans were moving down, only prices for soybeans (lower chart) were moving down more steeply and faster than prices for soybean meal. This is a situation for creating a spread between the two.
You can see the spread line begin to rise in late February. The spread formed a 1-2-3 low and then broke out above the #2 point.
At this point in time it is of no importance whether this spread is seasonal or not. The fact is that it can be entered simply my mere observation. Prices falling on one hand and prices falling faster on the other. The beauty of spread is that they are based on reality, rather than price manipulation. There is a fundamental reason why soybean prices are falling faster than soymeal prices. We don’t have to know the reason why this is happening. We have only to look and see the truth.
Someone wrote in: “Will trading eventually be done by programmed computers and not by people? Are we really headed that way?”
The answer is that it is already true. I read that at times 90% of daily trading in the stock market is computerized trading.
The computer age is bringing about unprecedented change in the markets. Even now it is altering the manner in which we conduct business, interpret events, gather information, and keep ourselves entertained.
While computers can expand our intellectual horizons, they can also limit creative interpretation. There is a tendency these days to let computers do the work of designing and discovering rather than relying upon intuition and imagination. All too often this is taking place even when it flies in the face of reality.
In a business context, computers reduce problems to statistical probabilities without necessarily considering the broad effects of events and relationships. No computer can keep you safe from those events which come unexpectedly, and which cause markets to go berserk. Wars, sudden shifts in political power and alliances, and natural disasters, can cause markets to become suddenly and extremely volatile. Even when statistics take such extremes into account, how do you defend yourself if you are long and a market suddenly crashes? Prices can leap right over your protective stops. A severe crash can shut the market down, and when it reopens you could be staring at a huge loss.
I’m not saying that computers shouldn’t be used to prove or disprove theories. But keep in mind that the intuition of the human mind has not yet been duplicated by electronic circuitry. Our educated insights are the critical tools with which we learn and comprehend how markets work.
Philippe Gautier: Administration and New Developments
Developer: Joe Ross
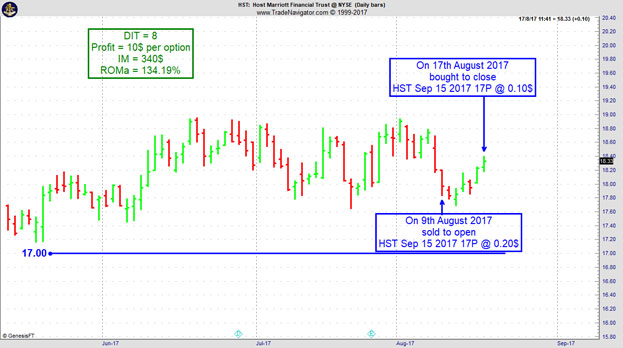
On 27th July 2017 we gave our IIG subscribers the following trade on Host Marriott Financial Trust (HST). We sold price insurance as follows on a GTC order as we could not get filled initially at our minimum price:
On 9th August 2017, we sold to open HST Sep 15 2017 17P @ $0.20, with 36 days until expiration.
On 17th August 2017, we bought to close HST Sep 15 2017 17P @ $0.10, after 8 days in the trade for quick premium compounding.
Profit: $10 per option
Margin: $340
Return on Margin Annualized: 134.19%
By patiently waiting for a retracement to get our minimum fill price, we could exit the trade very quickly.
We have also added new types of trades for our IIG daily guidance since 2016, "no loss" propositions with unlimited upside potential, still using other people's money to trade.
There are so many different instruments to trade like stocks, bonds, futures, spot forex, options and so on. And even when you decide to get into futures, there are tons of futures out there! So where to even start? I was as confused as anyone else about this when I started trading.
That’s why it probably feels good to focus on just one market in the beginning. "I just trade the EUR/USD" or "I only trade the ES" or "I'm a Gold trader" are common statements out there. And that’s not a bad thing. It’s almost impossible to start otherwise, you have to over simplify things in the beginning. Otherwise, you’d never get started trading at all.
But at some point, you should move on and expand your trading world. There are times when it’s almost impossible to make a profit in the EUR/USD or when it’s better to stay away from the ES. During these times maybe Gold or Crude Oil or AUD/USD are providing really good trading opportunities.
Especially as a day trader, you got to go where the action is. I’ve seen many traders going under because they kept on trying to milk a dead cow. That’s why recognizing when it’s time to look elsewhere is one of the most important skills to survive in the long term.
Don’t get marries to a single market, don’t keep on throwing good money after bad just to prove to your ego that you can get the money back from that market. Be flexible, go where the easy buck is.
There’s almost always a low hanging fruit…and usually, you know where it is. You’re just too stubborn to take it.
Many traders seem to have trouble understanding this concept. They cannot get their mind around it. Some are able to attain a composed calm and harmony when they are winning, but go berserk when losing. Others become defeatist when things turn bad. Still, others become resigned or go on tilt in various ways.
They try to abolish losing completely from their trading, and do everything in their power to avoid it. The solution they choose is to tighten up their trading to the nth degree. But unfortunately, swings in fortune are part of the game and need to be included. They must be worked with and controlled, not eliminated.
This attempt to turn trading into a black-and-white game goes like this: “I’ll trade absolutely safely. I will stay only in perfect trades, and if they are not perfect, then I’ll drop out.” On paper, this seems foolproof. The problem with this strategy is that you get trapped whenever you are in the gray areas (which is often). Trading is dynamic and constantly changing, with many rough edges. Trying to be too perfect is like trying to keep your clothing and life vest perfectly arranged during a river-rafting trip. You must roll with the water as it is moving along, not try to confine and control it!
Finally, there is also the frustration aspect that occurs if you try to banish all losses from trading. Stress occurs whenever a loss happens – anger, despair, indignation, outrage. Every trade becomes a life-and-death matter. This is the result of telling yourself that you must never fail. By including losses in the system, however, we anticipate them and thereby remove all the power from them. We are cool and composed; calmly factor them in, and move on.
"He who fears being conquered is sure of defeat".
- Napoléon Bonaparte
To view previous published Chart Scan newsletters, please log in or click on "Join Us,"
shown above, to subscribe to our free "Members Only" section.
A WEALTH OF INFORMATION & EDUCATION:
Joe Ross-Trading Educators' popular free Chart Scan Newsletter has been published since 2004.
Note: Unless otherwise noted, all charts used in Chart Scan commentary were created
by using Genesis Financial Technologies' Trade Navigator (with permission).
Legal Notice and Copyright 2017 Disclaimer - Published by Trading Educators, Inc.
Chart Scan is a complimentary educational newsletter.
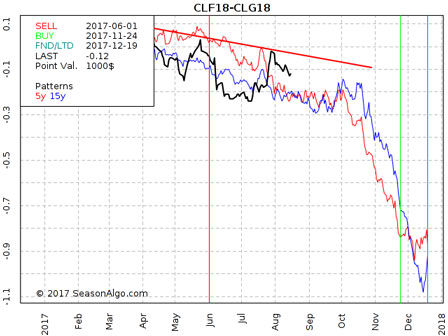
This week, we're looking at short CLF18 – CLG18: short January and long February 2018 Crude Oil (NYMEX at Globex).
Today we consider a Crude Oil calender spread: short January and long February 2018 Crude Oil (elec. symbols: CLF18 – CLG18 or CLES1F8 on CQG). The spread has been in a down trend since the beginning of 2017 trading now close to the upper side of its down-trend channel. Because there is only one month of difference between the two legs, the risk is at a manageable level of about $300 per spread contract. The spread should gain stronger momentum regarding seasonality to the down-side in later months (October and later) but a trader might already now scale into the trade.
Do you want to see how we manage this trade and how to get detailed trading instructions every day?
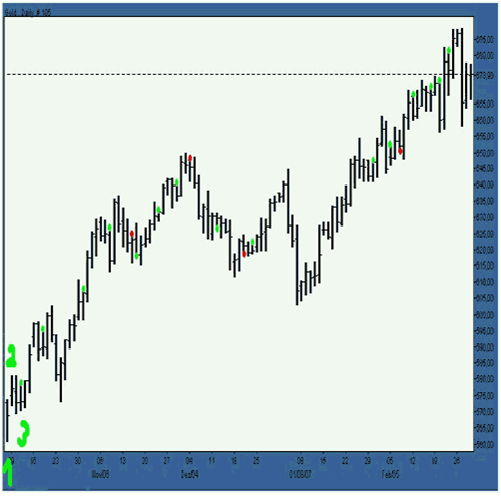
This week I lifted the chart I want to show you from one of our students, and it shows you how he trades gold using only Traders Trick Entries. You’ll have to look closely to see the green and red dots
"I traded lots of gold lately and thought I should share this chart as an example of how nice TTEs [Traders Trick Entries] can work.
"It's a daily-chart of gold. It starts with a 1-2-3, where I luckily bought and I'm still in with 1/3 of my initial position using natural supports to trail my stop.
"The green dots shows TTEs that 'worked,' the red dots are TTEs that 'failed.' For me they worked when they reached the point of the RH where I usually take profits, and move my stop to break even, or did a large enough move to take some profit, and did not go below the last day's low where I trail my stop when getting into a position.
"Of course I wouldn't have traded all of those TTEs; some of them are much too near the RH so that they don't allow to take enough profit at the RH. Some don't look 'good', and some come too close together. But just if you had taken them blindly, you still would have won big using the right money-position-management."
Notice that he says, "Of course I wouldn't have traded all of those TTEs.” Over the years from our own experience and feedback from our students there have been a number of refinements made to the way we select and trade the TTE. You can discover the filters we use to achieve close to 90% accuracy when selecting which TTE to trade. The material is covered in an online webinar “The Traders Trick, Advanced Concepts.”
Do you ever dream about winning the lottery? There are actually people who have such good luck that they repeatedly enter contests and win. They win so often that if they wanted, they could count on winning, even though they are essentially trying to capitalize on chance. They develop a "lottery mindset" in that they approach life by counting on rare chance events. The rest of us aren't so lucky, and we don't live our lives counting on a fluke like winning the lottery. We work hard, master a profession, and work steadily to make a living. In many ways, top-notch traders approach their profession in the same diligent way. They don't view trading as recreational gambling, and count on a fluke to make a profit.
Many people do experience key life-changing events. We have all heard of people who needed a lucky break and got it. You often hear of actors who with their last 50 bucks went on an audition and landed a job and ended up as a star of a hit sit-com. You probably know of friends who were desperately searching for a job for months, and needed a job fast! With only a week's worth of resources left, they found a job. It can also happen in sports. Olympic athletes may practice their entire life for "one moment in time" when they can perform at their best. But there is some luck involved. A family member may pass away or they may become ill, and it may throw them off their game. Sure, they have rare talents, but the Gold Medal winners are also lucky enough to have everything go their way. There are times when life can come down to a few key moments. It's a little like playing Lotto and hoping that you'll win.
Even though profitable traders don't approach trading as if they are playing the lottery, they all have at least one big winning trade in their careers. Do people make huge profits capitalizing on a once in a lifetime trade? Sure they do, but the question you need to ask yourself is, "Do I want to trade hoping to make all my profits on a fluke?" Do you want to approach trading with a lottery mindset? If you do, you'll always be on edge and you will have difficulty trading with discipline. You'll tend to take big chances, and you may end up losing big. It's better to trade more prudently. That doesn't mean never taking a risk or pushing yourself to invest a little more capital when you hit upon a winning streak. What it does mean, though, is controlling over-confidence. Don't seek out those one or two trades a year that will make up for all you've lost. There's an advantage to using a more methodical approach: Continue to search for solid, high probability trade setups, outline detailed trading plans, and trade prudently with unwavering discipline.
Philippe Gautier: Administration and New Developments
Developer: Joe Ross
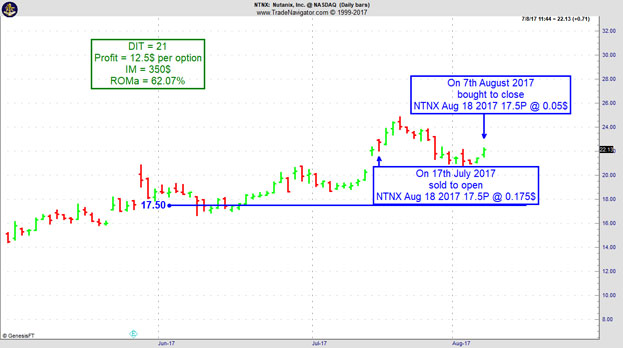
On 16th July 2017 we gave our IIG subscribers the following trade on Nutanix Inc (NTNX). We sold price insurance as follows:
On 17th July 2017, we sold to open NTNX Aug 18 2017 17.5P @ $0.175 (average price), with 31 days until expiration and our short strike 21% below price action.
On 7th August 2017, we bought to close NTNX Aug 18 2017 17.5P @ $0.05, after 21 days in the trade.
Profit: $12.50 per option
Margin: $350
Return on Margin Annualized: 62.07%
When the trade was given, $VIX had closed at 9.82, a particularly low level historically. But by widening our choice of underlying stocks (a recently introduced stock in September 2016 in that case), we can still find safe trades with quite decent levels of premium.
We have also added new types of trades for our IIG daily guidance since 2016, "no loss" propositions with unlimited upside potential, still using other people's money to trade.
This first episode, Marco Mayer answers trading related questions sent in from viewers like you!
Feel free to This email address is being protected from spambots. You need JavaScript enabled to view it. your questions or whatever is on your mind about trading.
To view previous published Chart Scan newsletters, please log in or click on "Join Us,"
shown above, to subscribe to our free "Members Only" section.
A WEALTH OF INFORMATION & EDUCATION:
Joe Ross-Trading Educators' popular free Chart Scan Newsletter has been published since 2004.
Note: Unless otherwise noted, all charts used in Chart Scan commentary were created
by using Genesis Financial Technologies' Trade Navigator (with permission).
Legal Notice and Copyright 2017 Disclaimer - Published by Trading Educators, Inc.
Chart Scan is a complimentary educational newsletter.
For many years I have maintained that there is a law that governs the formation of charts. I call it The Law of Charts.
I don't know why charts behave the way they do, but I do know that if the underlying data consists of highs and lows, you will see 1-2-3s, areas of consolidation, and Ross hooks™.
My first understanding of the law came when I saw the formations with which so many are now familiar. To my thinking, the patterns we see on a price chart are caused by the action and reaction of humans to their perception of value. However, it took me some time to realize that what differed among charts was the impetus that caused them to form The Law of Charts patterns.
I first became suspicious of this when I could see that the line charts created by price spreads formed the same patterns as those formed on a bar chart. Spreads consisted of connecting the values at which the spreads closed from one day to the next. There was no high or low each day as with a bar or candlestick chart.
Then I came across a set of data for gas meter readings in Southern California. They, too, formed the patterns of The Law of Charts. It was then I realized that I was indeed looking at a law. Only the impetus was different. The law was a constant. The impetus in this latter set of data was usage. The usage of natural gas varied, thus giving it highs and lows.
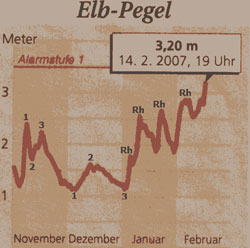
A few years ago a trader in Germany sent me the chart you see below. It is a chart depicting water levels in the Elbe River. As you can see, The Law of Charts really does exist, and it really is a law - not a theory or a system as people often refer to it when they ask me about it. You do not trade The Law of Charts, you find a way to implement the fact it exists. The Traders Trick is one of many implementations that I have figured out.
A market may be nervous when it goes into consolidation. It may be nervous when you see lots of dojis and flip-flopping – opening high one day and closing low, and then opening low and closing high the next day. A market may be nervous when it is backing and filling – opening on gaps and then filling in those gaps, or trading way up or way down, only to finish back where it started, or at an extreme opposite to the way it traded most of the day.
A market is illiquid when the tick volume is low for any given period, and this continues over a space of many periods. To know what normal tick volume is, you must study what it was during periods when you are able to trade normally with decent fills. It is illiquid when both open interest and daily volume are low. It is illiquid when the tick size is erratic, and you see many large ticks mixed in with smaller ticks.
A market is too volatile when it becomes a fast market. It is too volatile when slippage on fills is excessive regardless of whether this occurs when the tick size is excessive, the market is illiquid, or the market is frequently under fast market conditions. A market is too volatile when it shoots way up to an extreme high relative to where prices have been on a report or news item, and then right back down again to a relatively extreme low. The opposite is also true when the market shoots down first and suddenly reverses and moves up, with both moves to relative extremes.
All of the above have been true from time to time in all markets, almost all the time in some markets. It is best to trade with caution at those times or perhaps to not trade at all.
Philippe Gautier: Administration and New Developments
Developer: Joe Ross
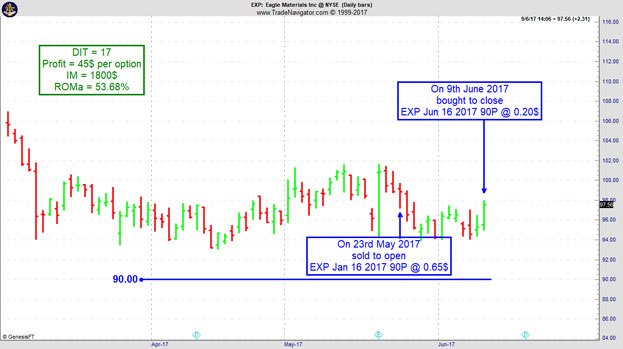
On 18th May 2017 we gave our IIG subscribers the following trade on Eagle Materials Inc (EXP). We sold price insurance as follows on a GTC order as we could not get filled initially at our minimum price:
On 23rd May 2017, we sold to open EXP Jun 16, 2017 90P @ $0.65, with 23 days until expiration.
On 9th Jun 2017, we bought to close EXP Jun 16 2017, 90P @ $0.20, after 17 days in the trade for quick premium compounding.
Profit: $45 per option
Margin: $1,800
Return on Margin Annualized: 53.68%
With implied volatility being so low, we often have to wait for a few days or more to get filled at our minimum price. We prefer to miss a trade rather than selling poor premium levels.
We have also added new types of trades for our IIG daily guidance since 2016, "no loss" propositions with unlimited upside potential, still using other people's money to trade.
Because of a random luck factor, it is possible for failure to raise its head at any moment. Consequently, we can’t sidestep or ignore it; we have to find a place for it in our overall system.
This is more profound than it seems. Any trader must be flexible enough to adapt not only to changing events, but also to the vagaries of chance, and the harmony continued in spite of it.
Trading, as it unfolds from the traders perspective, is experienced as an alternating of "in harmony" and "out of harmony" – things going right, things going wrong. These must be bracketed together and contained underneath the larger harmony.
Adapting to random surprise wrenches thrown into your plans, while still remaining in harmony, is the challenge of trading.
Including failure in our trading strategy also has another quality. It brings about humility. Factoring it into our trading means realizing that while we may win 50 percent of the time, we will also lose the other 50 percent – working with this fact rather then fighting it.
Defeats in trading are not really defeats, anyway — they are more like trial balloons we keep sending up, knowing in advance that a certain number of them are going to get shot down. Therefore, trading is really a process of two steps forward and one step back. The one step back part will always seem like a defeat, will always feel like a defeat, but is not a defeat – simply part of the process.
In this video, I explain a service called Ambush Signals. What is the system, the idea behind it and how Ambush Signals makes trading Ambush so much easier!
Feel free to This email address is being protected from spambots. You need JavaScript enabled to view it. with any questions or whatever is on your mind about trading.
To view previous published Chart Scan newsletters, please log in or click on "Join Us,"
shown above, to subscribe to our free "Members Only" section.
A WEALTH OF INFORMATION & EDUCATION:
Joe Ross-Trading Educators' popular free Chart Scan Newsletter has been published since 2004.
Note: Unless otherwise noted, all charts used in Chart Scan commentary were created
by using Genesis Financial Technologies' Trade Navigator (with permission).
Legal Notice and Copyright 2017 Disclaimer - Published by Trading Educators, Inc.
Chart Scan is a complimentary educational newsletter.
"Teach our students the truth in trading - teach them how to trade,"
and
"Give them a way to earn while they learn - realizing that it takes time to develop a successful trader."
Derivative transactions, including futures, are complex and carry a high degree of risk. They are intended for sophisticated investors and are not suitable for everyone.
There are numerous other factors related to the markets in general or to the implementation of any specific trading program which cannot be
fully accounted for in the preparation of hypothetical performance results, and all of which can adversely affect actual trading results.
For more information, see the Risk Disclosure Statement for Futures and Options.










 Trading Video - Ambush Signals