Trades in Stock Options. Receive daily trade recommendations. Can you imagine discovering a way to trade that promises instant income? If you think such a method is impossible, think again. It is definitely achievable, and everything you need to know is available online for one low price that includes special three-part online webinars.
Ambush is a time-proven mean-reversion day trading System focused on a variety of Futures markets around the globe. With Ambush Signals you can now easily follow the Ambush System on a subscription basis for educational purposes.
If you didn't fail early in your trading business, then you have probably been around long enough to realize that many of the problems you encounter as a trader are those that derive from your own individuality. Such problems are common among traders and, in fact, common among all human beings. Seeking spiritual help from a power much greater than your own is the area I address in the "Spiritual Side of Trading".
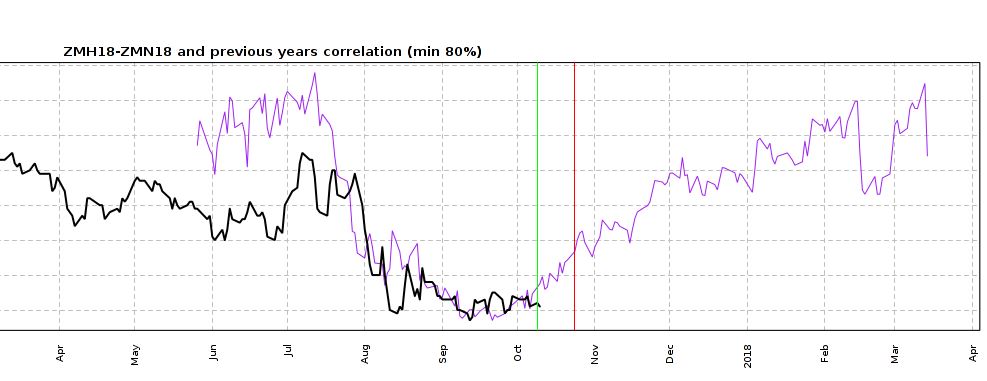
This week, we're looking at ZMH18 – ZMN18: long March 2018 and short July 2018 Soybean Meal (CBOT on Globex).
Today we consider a Soybean Meal calender spread: long March 2018 and short July 2018 Soybean Meal (elec. symbols: ZMH18 – ZMN18; ZMES2H8 on CQG).
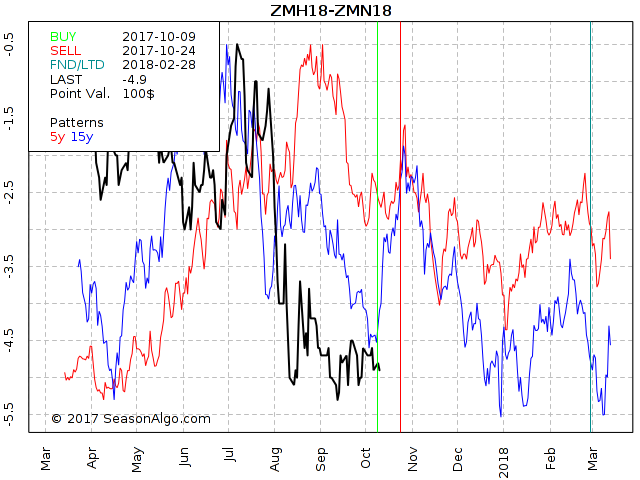
As you may have noticed, we are looking at a different chart today. The chart above is a so called “Correlation Chart” showing the correlation between the current Soybean Meal spread (March 18 – July 18) and the years 82, 99, 07, and 09. The spread has been following nicely its 4 Year correlation for the last few months. Will the spread follow the correlation during the next few weeks as well? Of course, we don’t know but together with the seasonal tendency to the up-side in October (chart below, there is a good statistical chance the spread will move higher.
Do you want to see how we manage this trade and how to get detailed trading instructions every day?
This week we continue the discussion of sideways markets we started a week ago:
A good example of sideways price action is usually seen at the end of a trend or swing. Following a 1-2-3 low formation, the probabilities favor some form of consolidation. There is a word for this type of consolidation — “accumulation.” However, consolidations following a 1-2-3 high formation are called “distribution.” Consider what you have seen on charts. How many Vee bottoms and tops have you seen compared with how many consolidating tops and bottoms form up?
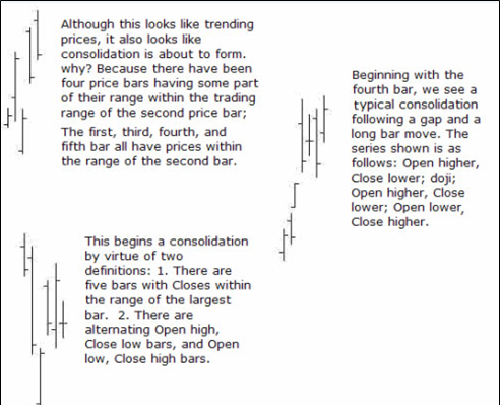
What are the first clues that prices may be getting ready to consolidate? Can consolidation be spotted while it is still in the birth canal? Let’s take a look:
The question becomes how to trade effectively inside a sideways market. It's important for you to know, because at any time markets can and do go into prolonged consolidations — sometimes remaining in them so long that it becomes difficult to make a living without a good understanding of how to trade such markets.
In the next issue of Chart Scan we will take a look at how it might be done.
If there is one factor that drives the inflation-deflation cycle, it is the effect and trend of interest rates. The bond/note market is the foundation of the stock market, and makes its existence possible. Interest rates compete with all other forms of investment for capital. When rates are rising, the stock market is less attractive because government bond and note yields are guaranteed, while stock market dividends and profits are not. Falling interest rates, which may stimulate inflation, precipitated the largest stock market increase in history. Real interest rate yield equals the inflation rate subtracted from interest rate yields. A 5% bond yield and 7% inflation rate erodes the purchasing power of money annually by two times.
Notes and bonds are not really controllable by the FED. The market pretty much decides what those will be. There is a great fallacy perpetrated by the FED which makes people think the FED controls interest rates. The truth is they don’t. All the FED ever does is to react to what is happening in the market. When the yield curve gets too far out of alignment, the Fed raises or lowers interest rates.
However, there's more. The FED does control the money supply. The FED prints money with no accountability. They create money out of thin air. With the removal of the M3 statistic, the lack of control is even more prominently displayed. The FED is almost entirely responsible for long-term inflation. If you or I were to print money with no accountability, we would be put in prison for counterfeiting. Yet the FED continues to print counterfeit money to the extent that people on fixed incomes suffer tremendously from the falling dollar. In effect, by printing tons of money the FED has devalued the dollar to the point of excess. In the last 10 years the purchasing power of the dollar has declined considerably.
Philippe Gautier: Administration and New Developments
Developer: Joe Ross
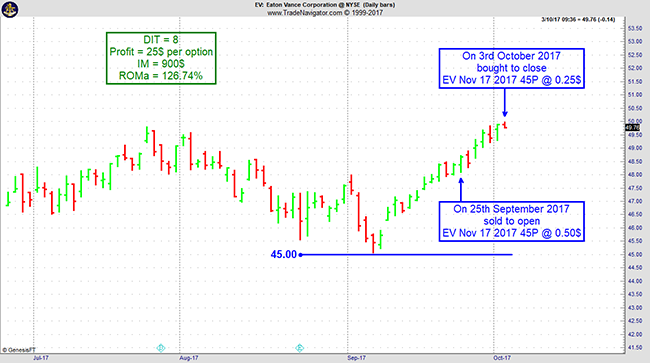
On 24th September 2017 we gave our Instant Income Guaranteed subscribers the following trade on Eaton Vance Corporation (EV). We sold price insurance as follows:
On 25th September 2017, we sold to open EV Nov 17 2017 45P @ 0.50$, with 52 days until expiration and our short strike about 7% below price action.
On 3rd October 2017, we bought to close EV Nov 17 2017 45P @ 0.25$, after 8 days in the trade for quick premium compounding.
Profit: $25 per option
Margin: $900
Return on Margin Annualized: 126.74%
We have also added new types of trades for our Instant Income Guaranteed daily guidance since 2016, "no loss" propositions with unlimited upside potential, still using other people's money to trade.
Philippe
Receive daily trade recommendations - we do the research for you!
Find out the most common, deadly mistakes traders can make, and that's averaging into a losing position. Learn insights as to why this is so tempting, and why you should avoid it at all costs.
To view previous published Chart Scan newsletters, please log in or click on "Join Us,"
shown above, to subscribe to our free "Members Only" section.
A WEALTH OF INFORMATION & EDUCATION:
Joe Ross-Trading Educators' popular free Chart Scan Newsletter has been published since 2004.
Note: Unless otherwise noted, all charts used in Chart Scan commentary were created
by using Genesis Financial Technologies' Trade Navigator (with permission).
Legal Notice and Copyright 2017 Disclaimer - Published by Trading Educators, Inc.
Chart Scan is a complimentary educational newsletter.
This week we are beginning a multi-part series on trading in consolidation. I want to show you how to trade inside a consolidation. But first we need to see a few basics to build up to "how to do it."
Let's begin with a basic truth: every market is in consolidation between the highest high it ever made and the lowest low. However, within that consolidation are trends, swings, and smaller consolidations from 4-bar ledges to trading ranges extending for more than 20 bars.
To trade within a consolidation, we must know as early as possible that a market is indeed consolidating. As we go through this series, I'll show you how to tell.
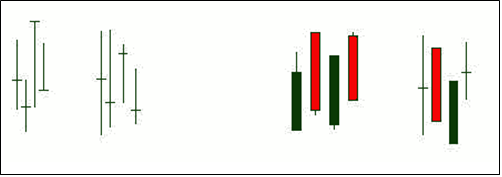
When we see an /\/\ or \/\/ on the screen, we know we are in a consolidating area. I know from your communications that many of you have a hard time recognizing consolidation. One way to spot consolidation is through the use of candlesticks.
Candlesticks offer a visual aid for spotting consolidation. Let's see how. If you see a group of dojis in a row, or a group of alternating green and red candles in a row, you are looking at consolidation. Any combination of alternating dojis and candlesticks constitute consolidation. Consolidation always has a minimum of four bars. When I say any combination of dojis and candlesticks, I mean that you might get two or more black candles in a row, followed by one or more red candles. The opposite is also true you might get two or more red candles in a row followed by one or more black candles. The congestion often starts with a doji followed by alternating red and black candles.
Consolidation may be telling you there may be confusion about price. Consolidation may be telling you that there is no oversupply or excessive demand. Supply and demand are in equilibrium, and so the market goes sideways. Consolidation can also mean less order flow into the markets. Prices are at a level where buyers are willing to buy and sellers are willing to sell, but there is nothing known that would cause impulsive, emotional buying and selling. and momentum and thrust are mostly missing.
I believe trading is far more an art than a science. For one thing, if trading were a science, then we should all be able to enter the same trade at the same time, and exit at the same time, getting identical results. We all know that just isn’t so. Yet if trading were scientific, we should be able to get identical results by doing the same thing. I believe such expectation describes the “scientific method.”
In addition, if trading were scientific, we should be able to come up with a “get rich” formula that would work all the time. We could then all retire and never have to work again. We all know this isn’t so either.
When we, as traders, make a trading decision, most of the time we do not fully know why we are making that decision.
You look at a market, you think about taking a trade in that market, and at some point you pull the trigger. You have thought of dozens of things in the time interval leading up to your entry. If I were to ask you, "Exactly why are you buying what you are, or why are you selling what you are?" you would probably not be able to give an accurate answer. You may be able to give a few reasons, but it will most likely not be the full answer. A lot of your decision to enter is subconscious. You do not really know why you entered, especially if you are day trading. To that extent it is more an art than a science, because you cannot fully demonstrate why you are doing what you are doing.
But you could say, "I fully know what I'm doing. I am taking the trade because I am following the signals of my method or system." Wonderful, you have just proved my point. When you are blindly trading signals from a method or system, you truly don't know why you are taking the trade. You are essentially acting like a robot, pre-programmed to follow signals whether or not they make sense.
I am not disparaging trading that way. If a method or system produces winning results, then what you are doing is following a statistically proven plan. All methods and all systems are based on statistics. The odds on any single trade are never more than 50% win or lose. However, the probability for a succession of trades is quite another story. If you are trading a method that wins seven out of ten times that you enter, and the method has produced a loser three or four times in a row, then the probability for a successful trade increases each time you enter the market. Sooner or later, over a series of trades, you are going to have the result of seven winners against 3 losers. That is statistically valid; however, it is not exactly rocket science. You will have proven that trading is an art — the art of following a statistically valid plan.
Philippe Gautier: Administration and New Developments
Developer: Joe Ross
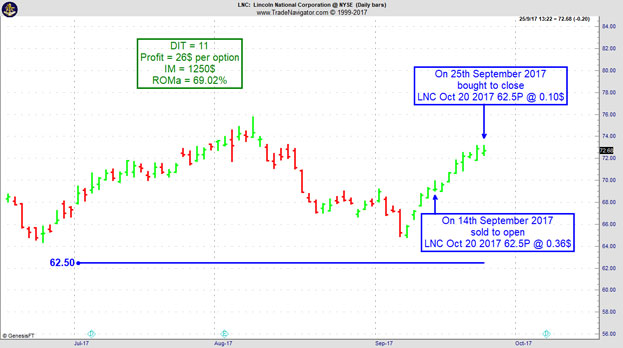
On 13th September 2017 we gave our Instant Income Guaranteed (IIG) subscribers the following trade on Lincoln National Corporation (LNC). We sold price insurance as follows:
On 14th and 15th September 2017, we sold to open LNC Oct 20 2017 62.5P @ 0.36$ (average price), with 35/36 days until expiration and our short strike about 10% below price action.
On 25th September 2017, we bought to close LNC Oct 20 2017 62.5P @ 0.10$, after 11 days in the trade for quick premium compounding.
Profit: $26 per option
Margin: $1,250
Return on Margin Annualized: 69.02%
We have also added new types of trades for our IIG daily guidance since 2016, "no loss" propositions with unlimited upside potential, still using other people's money to trade.
Philippe
Receive daily trade recommendations - we do the research for you!
"Buy low, sell high" is one of the most popular memes in the investment and trading world. And obviously, it does make sense, who wouldn't like to buy low and sell high all the time? I found this to be quite a helpful advice to invest in stocks for example. Wait for a crash, buy it and sell again when prices are back to old highs.
Of course, the problem often is to figure out what's actually a low price and what's a high price. You can also buy high and sell higher to make a profit, which is how trend following works.
So what's the real deal here? I think the actual question to ask is "who's going to buy after me?" or "who's next in line?". Will there be enough traders willing to buy after you did at a higher price? Or if you're short the other way around, will there be sellers standing in line to sell after you did or not?
Think about it. To make a profit that's exactly what needs to happen. If you buy at $100, the only way to make a profit is if there are buyers willing to buy at higher prices. If they don't bid it up after you and you find someone to sell to at a higher price, you won't make a profit. Simple fact most traders are not really aware of.
Obviously, there's always someone who's gonna be the last in line. Someone is going to buy the high of the day/week/month/year/all-time. In poker, there's the popular saying that if you don't know who the patsy is in the round after 30 minutes, it's probably you. That same idea applies to trading. If you don't know why other traders are probably willing to buy at a higher price after you during the day, you might be the last one in the order book to bid at such a high price for today.
Because of that, it's always helpful to ask yourself "Who's gonna buy/sell after me and why?". If you can't answer that question it might be best to skip the trade!
To view previous published Chart Scan newsletters, please log in or click on "Join Us,"
shown above, to subscribe to our free "Members Only" section.
A WEALTH OF INFORMATION & EDUCATION:
Joe Ross-Trading Educators' popular free Chart Scan Newsletter has been published since 2004.
Note: Unless otherwise noted, all charts used in Chart Scan commentary were created
by using Genesis Financial Technologies' Trade Navigator (with permission).
Legal Notice and Copyright 2017 Disclaimer - Published by Trading Educators, Inc.
Chart Scan is a complimentary educational newsletter.
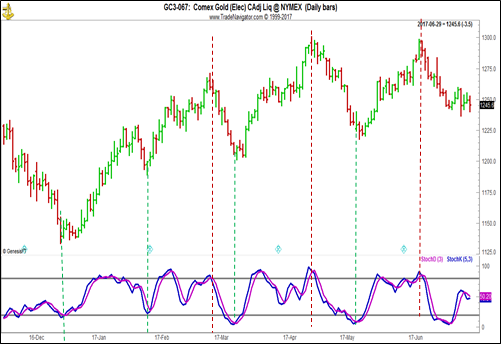
One of my friends sent me the following chart along with his comments as you’ll see below.
Not all my students trade plain vanilla charts, which is usually the way I trade them. Some students use indicators in unconventional ways to improve their trading. The chart below is an example of using Stochastics to confirm changes in momentum in conjunction with ends of swings and trends.
Here's what my friend wrote:
"Hey, Joe...I'm passing along this chart because I thought you'd want to take a look.
You've been talking longer-term recently; I just happened to be looking at the daily GOLD chart this evening. You might be interested to observe how well the Stochastic (5,3,3) has caught the profit-taking retracements, prior to changing direction in this market.
For example, if one made a habit of taking the first breakout following a %K/%D cross (or perhaps even wait for a reversal bar), plenty of dollars could have been made in gold futures. Will prices move higher or lower? We'll have to wait and to see!"
The concept shown in this issue of Chart Scan, along with greater details and even more techniques are covered in our More Special-Setups Webinar.
I get some unusual questions from time to time, and this is one of them.
Certainly, the TICK can be used with Stochastics, as I explain below. The TICK expresses the net total of NYSE stocks that have down-ticked or up-ticked on the last trade. When E-Mini S&Ps are making new intra-day highs, the TICK should be +250 minimum. If the TICK is negative, do not take a long position. When new intraday lows are being made, a -250 minimum value should be recorded. If the TICK reaches over +500, try to buy a Stochastic D line correction at 50 or lower, and expect new intraday highs. After 2 PM CST, the main trading in the T-Bonds is over, and E-Mini S&P prices are prone to rally if they were being pressured by the T-Bonds.
The TIKI does the same thing for the Dow 30 as the TICK does for the NYSE Stock Index. It measures the tick for the 30 DJ Industrial stocks. However, I am not able to tell you exactly how to use it because I haven't really ever looked at it. I'm sure that at a value which shows TIKI to favor a long position, and with the Stochastic at oversold, you would have corroboration for going long. Vice-versa for going short with the Stochastic at overbought.
The TRIN calculates two ratios of up and down volume on gaining and losing stocks. Below 65 the TRIN is bullish; it is bearish above 110. If you seek confirmation of TRIN for a bullish position, you would want a Stochastic reading of 25 or less. If you wanted confirmation of TRIN for a bearish position, you would want to see Stochastic at 75 or more.
Numbers can be very important. Did you know that the probability of financial ruin of a system 50% accurate with a 1 to 1 pay off risking 10% of capital on each trade is .99%; with a 2 to 1 payoff, the probability of financial ruin falls to .008%?
Philippe Gautier: Administration and New Developments
Developer: Joe Ross
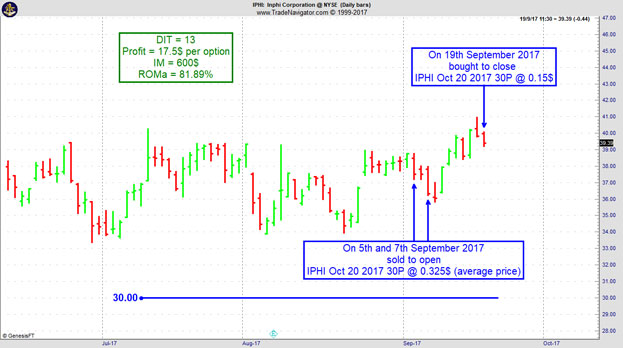
On 4th September 2017 we gave our IIG subscribers the following trade on Inphi Corporation (IPHI). We sold price insurance as follows:
On 5th and 7th September 2017, we sold to open IPHI Oct 20 2017 30P @ 0.325$ (average price), with 44 days until expiration and our short strike about 20% below price action.
On 19th September 2017, we bought to close IPHI Oct 20 2017 30P @ 0.15$, after 13 days in the trade for quick premium compounding.
Profit: $17.50 per option
Margin: $600
Return on Margin Annualized: 81.89%
We have also added new types of trades for our IIG daily guidance since 2016, "no loss" propositions with unlimited upside potential, still using other people's money to trade.
Philippe
Receive daily trade recommendations - we do the research for you!
Learn Futures Swing Trading Strategies with Traders Notebook Outrights
Whether you trade commodities, currencies, financial instruments or indexes, there is a right approach to every market and time frame. You have never experienced support as you will find it with Traders Notebook. We back up and stand behind everything we do. Traders Notebook Outright shows you Futures Trading Strategies that you can also incorporate into your existing personal Day Trading Strategies.
YOU can tap into Joe Ross' and Andy Jordans' decades of hands-on trading experience. There is no need to struggle for years buying one book after another, or one "magical" mechanical trading system after another. You will receive a solid trading education from us! There is no need to knock yourself out learning about a lot of indicators. No need for Elliott Waves, Fibonacci points of confluence, and no need for Gann Theory.
Traders Notebook Outright Guide explains the Outright trading service from Trading Educators. It shows you around on the Outright Campus and how to use the information provided by the service.
Let me share with you one of the most common, and most deadly mistakes traders can make, and that's averaging into a losing position. I will also give you some insights as to why this is so tempting, and shows you why you should avoid it at all costs.
To view previous published Chart Scan newsletters, please log in or click on "Join Us,"
shown above, to subscribe to our free "Members Only" section.
A WEALTH OF INFORMATION & EDUCATION:
Joe Ross-Trading Educators' popular free Chart Scan Newsletter has been published since 2004.
Note: Unless otherwise noted, all charts used in Chart Scan commentary were created
by using Genesis Financial Technologies' Trade Navigator (with permission).
Legal Notice and Copyright 2017 Disclaimer - Published by Trading Educators, Inc.
Chart Scan is a complimentary educational newsletter.
Ambush made new all time equity highs having its best month EVER!
Marco Mayer has extended his 6-Month Subscription Special Offer until September 26th!
Ambush Signals has almost a $15,000 profit so far in 2017 with a maximum drawdown of about $4,000. That’s an excellent ratio of more than 3:1. That’s very, very hard to find in the industry, especially in 2017.
In total the portfolio gained more than $8,000 in August, with 85% winning trades while having made over 1.4 times more profits on winning trades than on losing trades. How’s your favorite market doing with Ambush? Go to the Performance Page!
Personally, I enjoy trading the e-mini Russell 2000. It makes beautiful Law of Charts formations. I take trades in it mostly from the 3-10, minute time frames, but also quite often from the daily chart. The formations are always clean and clear, and the moves tend to be spectacular. As one of our trading friends put it, you get ten ticks to the point with Russell for $100 total, versus only four ticks per point with the e-mini S&P for a total of $50. That makes Russell easier to trade.
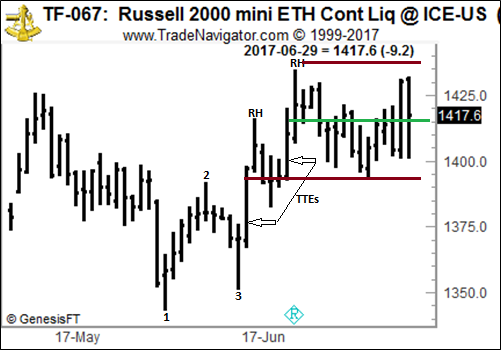
Let's look at a daily Russell chart to see some classic Law of Charts formations that have happened recently.
As you can see, prices reached the low in May with a beautiful reversal bar. Based on that reversal bar, frightened shorts began buying to lock in any profits they might have had from earlier price action. Reversal bar breakout traders joined in the buying, and prices moved from #1 to #2. Again at #2 there was profit taking by longs, and their selling took prices down to where we see #3. There were four correcting bars in the move to #3, at which time there was Traders Trick Entry available for going long.
Prices then proceeded to move past the #2 point, and a Ross hook formed. From the point of the first Ross hook there were three bars of correction, yielding another Traders Trick Entry.
Prices moved up again, formed a second Ross Hook, but then fell back into a 16-bar consolidation. The high and low of the consolidation I showed as brown horizontal lines. The green line is the center of the consolidation.
As I write this, it is not yet clear what will happen from where we see prices on the last bar. But a lot of money was available from the two TTEs.
I was watching an old movie "Coach Carter," starring Samuel L. Jackson. I couldn't help thinking about the many similarities between what a coach must do to prepare his players and what a trader must do to prepare to trade.
Since trading is largely a self-directed business venture, embarking on a trading career requires that you are able to set clearly defined objectives and develop a specific plan for achieving them.
Clearly defined objectives and well-developed plans carry the stamp of success in any professional undertaking.
Imagine an ocean liner departing without a navigational plan, a repairman doing repairs on your refrigerator without full knowledge of the workings of the compressor, or a professional basketball team running onto the court without a game plan.
In each case, the lack of a clearly defined plan in which specific objectives are set and specific steps are outlined can produce disastrous results. Clearly defined plans are essential. The captain sails his ship with plans for the safe and on-time arrival to a destination city. The repairman examines the inner workings of your refrigerator and uses the correct parts and tools to fix the problem. The coach tells the basketball team to run specific plays to defeat the opponent.
Successful trading careers start with plans that specify objectives, which in turn lead to success. There are psychological benefits to establishing objectives and developing plans to reach them. First, you may find your stress levels are reduced. Making a specific plan allows you to detail any vague and seemingly unattainable objectives into clearly defined steps, which in turn make the larger goal seem more reachable. When you have a specific plan, you can more easily identify which steps to do first, and then figure out how you will achieve each one. In addition, you will find that following a plan ensures you stay positive, so you control each aspect of your trading day (instead of its controlling you). This leads to increased confidence and consistency, which leads to increased effectiveness, which in turn leads to advancement towards your ultimate goal.
You must then write down the way you envision your goal. Create a definitive statement detailing as much of it as you can. Be very specific. Then read your objectives aloud every day. They must become believable.
Accordingly, you adjust trade size and protective stops so that you never lose more than your planned amount on any trade.
Now, map out your plan. What is your budget for hardware, software, and education? How much time can you devote? How much money will you use? What trading time frame, or style, matches your personality? For example, if you have trouble making split-second decisions, then scalping is not for you. Perhaps position trading, with a 2 to 5-day hold, better suits your personality.
Maybe you want to target certain markets and become a “specialist” in those markets. Or maybe you prefer to trade spreads or options. What set-ups do you prefer? Become an expert at trading a particular set-up and have it deliver the main part of your gains. Detail your trade, risk and money management strategies. Finally, establish a list of trading rules that you keep close-by.
Once you establish convincing and realistic objectives, and map out a plan that leads to those goals, you will find your trading efforts to be easier, more exciting, and certainly more successful!
Philippe Gautier: Administration and New Developments
Developer: Joe Ross
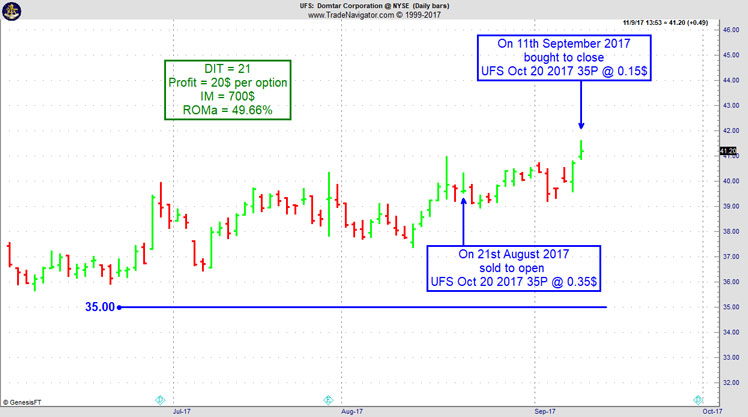
On 20th August 2017 we gave our IIG subscribers the following trade on Domtar Corporation (UFS). We sold price insurance as follows:
On 21st August 2017, we sold to open UFS Oct 20, 2017 35P @ $0.35, with 59 days until expiration and our short strike 12% below price action.
On 11th September 2017, we bought to close UFS Oct 20, 2017 35P @ $0.15, after 21 days in the trade.
Profit: $20 per option
Margin: $70
Return on Margin Annualized: 49.66%
We have also added new types of trades for our IIG daily guidance since 2016, "no loss" propositions with unlimited upside potential, still using other people's money to trade.
The single most important component of the personality related to personal achievement is self-esteem. Self-esteem is simply how much an individual likes himself and correlates to high achievement on a one-to-one basis. The more an individual likes himself the higher levels of performance he can achieve in any area of his life. Traders should always have at least one physical or mental activity every week that helps them feel good about themselves, like chess or golf.
To reach high performance and personal achievement, understanding the three components of the self-concept is beneficial. The Ideal Self is a mental picture of the trader a person would like to become, a composite of the all positive qualities admired in other traders. Schwager's "Market Wizards" is filled with these admirable characters with their winning personalities. The Self Image is the inner mirror of the person a trader thinks he really is, and relates how he interacts with others on a day-today basis. A person seldom reaches levels of achievement beyond his self-image limitations. The Self-Esteem is how much a person likes himself. The more a person likes himself the higher levels of achievement are possible. These three components of the personality are always changing every moment. The self-aware trader shapes these personality components to compliment his goal achieving efforts to profitably trade the markets.
To view previous published Chart Scan newsletters, please log in or click on "Join Us,"
shown above, to subscribe to our free "Members Only" section.
A WEALTH OF INFORMATION & EDUCATION:
Joe Ross-Trading Educators' popular free Chart Scan Newsletter has been published since 2004.
Note: Unless otherwise noted, all charts used in Chart Scan commentary were created
by using Genesis Financial Technologies' Trade Navigator (with permission).
Legal Notice and Copyright 2017 Disclaimer - Published by Trading Educators, Inc.
Chart Scan is a complimentary educational newsletter.
Ambush made new all time equity highs having its best month EVER!
You may remember earlier this year in my previous report when I announced that Ambush had made new all time equity highs. Well, guess what? It didn’t stop there and it literally exploded much higher while having its best trading month ever!
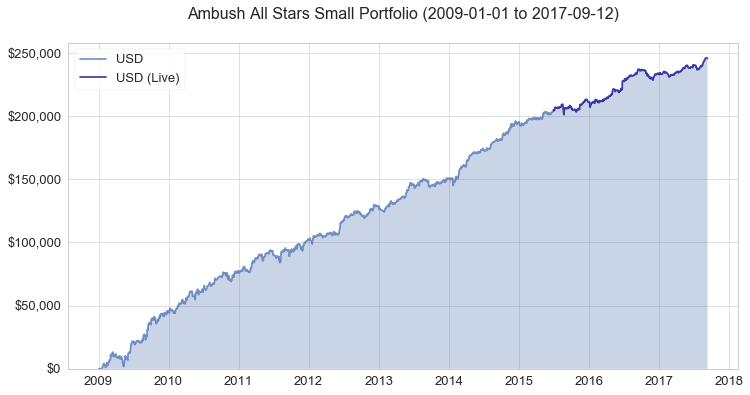
Looking at the whole futures systematic trading industry, 2017 has been an exceptionally difficult year. Of all the systems that I’m following, Ambush is literally the only one that kept performing as usual this year.
Ambush has been around for almost 10 years now but as markets tend to change, I do review Ambush once a year to see if any changes are necessary to adapt to changing market conditions. The last time any significant changes have been required was in July 2015. As you can see on the following chart Ambush kept on performing as expected in live trading.
Funny enough it just beat its pre-live backtest and as of August has been its best trading month EVER! This really says something about a trading method if it beats its historical backtest performance in live-trading doesn’t it?
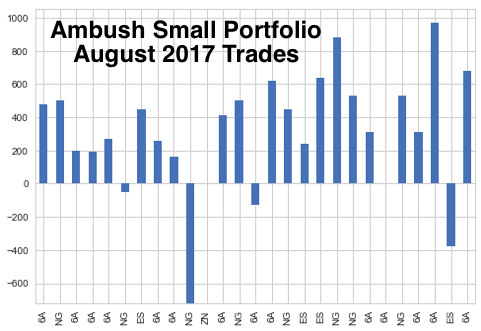
Let’s look at the Ambush All Stars Portfolio for Small Accounts (you can find out more about the sample portfolios on the Performance Page) in August.
Looking at all the August trades in detail, we can see that the profits have been nicely distributed across the different markets.
In total the portfolio gained more than $8,000 in August, with 85% winning trades while having made over 1.4 times more profits on winning trades than on losing trades. Yes, really and yes this is crazy!
Now obviously "crazy" happens and it’s fun to talk about it but of course you want to see more than just a chart showing you what happened last month right? How did the Australian Dollar perform over the years? What are the different portfolios made of? How’s your favorite market doing with Ambush?
To find out about all of the above, simply go to the Performance Page where you’ll find all the stats you need.
Join us and become an Ambush Trader!
The easiest way to follow Ambush is, of course, Ambush Signals. It does all the work for you, allows you to customize what markets you want to see and has a position sizing tool implemented to automatically adjust the positions to your risk preferences.
Each day around 6:30 pm NY Time the Signals are available for you on the Dashboard. You can then place your orders and literally walk away until the next market close!
If you following any System it can be tough in the beginning. It simply needs time to build the confidence needed to make it through drawdowns. What if you’re unlucky and don’t catch Ambush’s best trading month ever when you start trading?
I want you to succeed trading Ambush, so here’s something for you that will strongly increase your odds of success and allow you to easily gain the confidence you’ll need to become a profitable Ambush trader.
I offer you 6 months of Ambush Signals for just $499. That’s a saving of $215, giving you almost two months of Ambush Signals for free. As we usually only offer monthly or 3-months subscriptions, this is a one-time offer!
These 6 months will allow you to get to know Ambush Signals without too much stress or pressure and to follow it for a long enough time period that it simply won’t that much if you’re lucky and start on Ambush’s best trading month ever or not.
Now if you’d prefer to rather generate the signals on your own and want to know the exact trading rules of Ambush, we also have a special offer for the Ambush eBook:
Coupon Code:
Ambush eBook: use "ambush300" to get the Ambush eBook $300 off, for $999 instead of $1299.
Now if you’re thinking that getting a trading method that’s been doing so well for such a nice price is too good to be true, then you’re right. As you might remember we’ve already significantly raised the price of eBook last year. I can’t tell you much more at this point but this might be your last chance to get into Ambush Signals or to buy the Ambush eBook at such a low price.
All Coupon codes are valid only until Wednesday, September 20th. Hurry up and don’t miss out on this rare opportunity!
Today I want to show you something that most educators will not talk about: Drawdowns
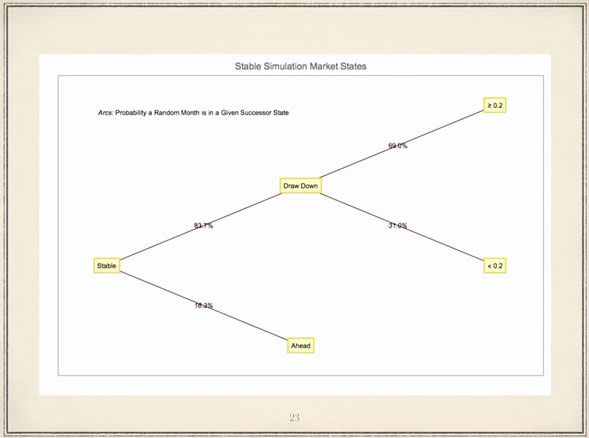
Most of the time as a trader, you will find yourself in periods of draw downs. This means, most of the time after reaching a new equity high you will be under water. That is something most newbies underestimate and one of the main reasons traders fail because they get the idea they will be up most of the time. Inexperienced traders don’t come up with this idea by themselves, of course. It is mainly the trading education industries that tells everyone how easy and how much fun trading is.
The calculation shown below comes from Robert Frey, a math guy, and as you can see, traders might be a significant time in draw down periods.
“Robert FREY - 180 years of Market Drawdowns” has a video on YouTube that is worth checking out.
Sometimes we are so busy looking at the forest that we miss seeing the trees. If you are a day trader it could be you are no longer seeing the trees that are on the weekly chart. This past week I've been looking at weekly charts. What prompted me was that a friend of mine, who has been trading strictly from the weekly charts, wrote to tell me his account is up five-fold. Is yours?
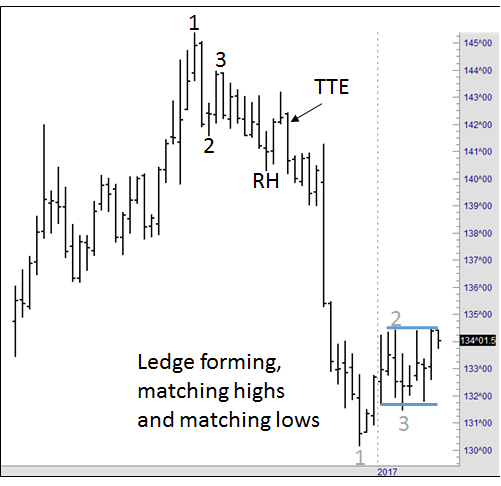
T-Note futures have always been difficult for me to trade as a day trader. So I decided to look at "trees" in the T-Note futures first. I was astonished at what I saw. There were 1-2-3s, Ross Hooks and Traders Tricks.
Yeah! But who wants to trade the weekly chart? What I should have been asking is why haven't I been trading the weekly charts? Trading the weekly charts doesn't mean that you have to sit and watch the market all week long hoping for a trade. With today's automatic trading platforms, there's not a lot of watching to do. Besides, if you are willing to take some money off the table quickly, trades from the weekly chart can be ideal. The moves on a weekly chart, even when small, are typically much greater than you'll get from the same move on a daily or intra-day chart.
Take a look!
The arrow points to a Traders Trick Entry. I would have made a nice bundle on that one. But where was I? Burning up my eyeballs looking for an intraday trade in four other markets.
Several weeks later, prices bottomed out and formed a 1-2-3 low, which has turned into a possible ledge trade. Please notice that when notes move a full point, it is worth $1,000. That means if I had entered at 142^00 and exited at 132^00, I would have made $10,000. As Fagin said the movie “Oliver,” I think I’d better think it out again.
New traders must keep a diary of trades with the following information:
Why trades were initiated
How stops were managed
Where and why they were moved
Why the trade was exited
Personal observations. This trade check analysis will spot any breakdowns in discipline or methodology, and focus the trader on why actions are being taken. What is the purpose of this diary? To help you find your true self. To be a successful trader, you need to find out who you really are.
Traders should also keep a chart of their equity. This can be set up in a spread sheet and graphed. Every win should be added and every loss subtracted. After 20 trades, begin to maintain a moving average of the equity. If your trading equity falls below the moving average, stop trading. Paper trade until the equity curve rises above the moving average, at which point you may trade again using real money.
This little exercise will assist you in keeping your losses small and optimizing your wins. You will trade away your bad periods on paper, or a simulator, while your winning periods will be traded with real money.
We have developed a wonderful tool to help you. It’s called “The Life Index for Traders” and it comes with the “Equity Evaluator.”
Philippe Gautier: Administration and New Developments
Developer: Joe Ross
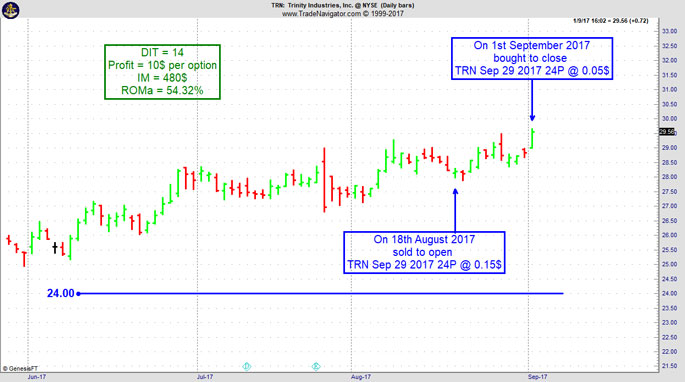
On 14th Aug 2017 we gave our IIG subscribers the following trade on Trinity Industries (TRN). We sold price insurance as follows on a GTC order as we could not get filled initially at our minimum price:
On 18th August 2017, we sold to open TRN Sep 29, 2017 24P @ $0.15, with 41 days until expiration.
On 1st September 2017, we bought to close TRN Sep 29 2017 24P @ $0.05, after 14 days in the trade for quick premium compounding.
Profit: $10 per option
Margin: $480
Return on Margin Annualized: 54.32%
By patiently waiting for a retracement to get our minimum fill price, we could exit the trade fairly quickly.
We have also added new types of trades for our IIG daily guidance since 2016, "no loss" propositions with unlimited upside potential, still using other people's money to trade.
To view previous published Chart Scan newsletters, please log in or click on "Join Us,"
shown above, to subscribe to our free "Members Only" section.
A WEALTH OF INFORMATION & EDUCATION:
Joe Ross-Trading Educators' popular free Chart Scan Newsletter has been published since 2004.
Note: Unless otherwise noted, all charts used in Chart Scan commentary were created
by using Genesis Financial Technologies' Trade Navigator (with permission).
Legal Notice and Copyright 2017 Disclaimer - Published by Trading Educators, Inc.
Chart Scan is a complimentary educational newsletter.
"Teach our students the truth in trading - teach them how to trade,"
and
"Give them a way to earn while they learn - realizing that it takes time to develop a successful trader."
Derivative transactions, including futures, are complex and carry a high degree of risk. They are intended for sophisticated investors and are not suitable for everyone.
There are numerous other factors related to the markets in general or to the implementation of any specific trading program which cannot be
fully accounted for in the preparation of hypothetical performance results, and all of which can adversely affect actual trading results.
For more information, see the Risk Disclosure Statement for Futures and Options.