Trades in Stock Options. Receive daily trade recommendations. Can you imagine discovering a way to trade that promises instant income? If you think such a method is impossible, think again. It is definitely achievable, and everything you need to know is available online for one low price that includes special three-part online webinars.
Ambush is a time-proven mean-reversion day trading System focused on a variety of Futures markets around the globe. With Ambush Signals you can now easily follow the Ambush System on a subscription basis for educational purposes.
If you didn't fail early in your trading business, then you have probably been around long enough to realize that many of the problems you encounter as a trader are those that derive from your own individuality. Such problems are common among traders and, in fact, common among all human beings. Seeking spiritual help from a power much greater than your own is the area I address in the "Spiritual Side of Trading".
Last week we completed the construction of a trading envelope in the 30-year Treasury Bond. The next step is to go back to find out the earliest time we could have constructed the envelope.
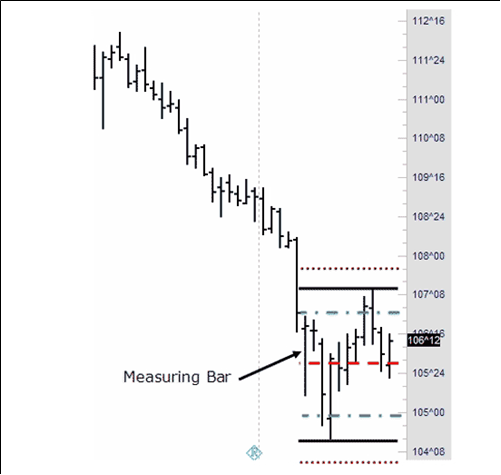
I submit that it must be once prices are seen to be in congestion (11-20 bars).
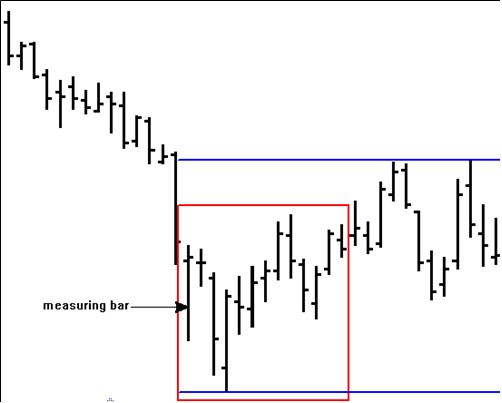
Looking at the chart we see that congestion could actually be defined as 10 bars, all having either Opens or Closes within the trading range of a single measuring bar, comprising a total of 11 bars. That, then, is the earliest point in time at which an envelope could have been constructed.
When a trend begins, always question its durability.
Traders who are in the market for the greater wins are wise to incorporate, when possible, seasonal factors, fundamental factors, technical analysis, and chart analysis. Among those who do, some start with seasonal research and then draw on fundamental knowledge or technical and chart reading expertise to help measure risk and confirm or deny potential reward. Others start instead from a fundamental or technical perspective, and then analyze the seasonal path of least resistance. It’s also important to realize that seasonality is not always on time; seasonal factors can come early or late. The same thing is true of cycle turning points, they, too, can come early or late.
In this issue of Chart Scan, let’s think for a moment about the effects of interest rates. If the Federal Reserve is concerned that a heated economy is stimulating inflationary pressure, the FED will launch a series of rate increases designed to slow growth. The strategy may have its intended effect. But once the strategy begins, you can expect a series of rate increases. However, it would be insane to increase rates when the economy is deflationary. Increasing rates will only make things worse.
When a cooling economy eases pressure on interest rates, financial instruments typically rally. Therefore, a fundamental outlook may encourage tentative long positions in interest rate futures. A trader who first refers to seasonal research before making final trading decisions finds that interest rates tend to peak in April/May, and generally decline into the fourth quarter. What we have observed over the years is that futures all along the yield curve tend to begin trending higher in May/June, which impacts the September Treasury Bonds and moves them higher.
Because big money is most concerned with long-term survival and advantage, trends in interest rates are usually confirmed by two spread characteristics: instruments at the long end of the yield curve outperform the short end, and deferred contracts outperform nearby contracts. A tentatively bullish fundamental trader who considers spreads to be a low-risk alternative to an outright position might find opportunity in certain seasonal spreads. One that you might want to think about for the future is Long June of the following year and Short September of the current year in Eurodollars. There may still time to consider this spread, depending upon when you receive this issue of Chart Scan. You might also consider Long June two years ahead, and short September of next year.
Philippe Gautier: Administration and New Developments
Developer: Joe Ross
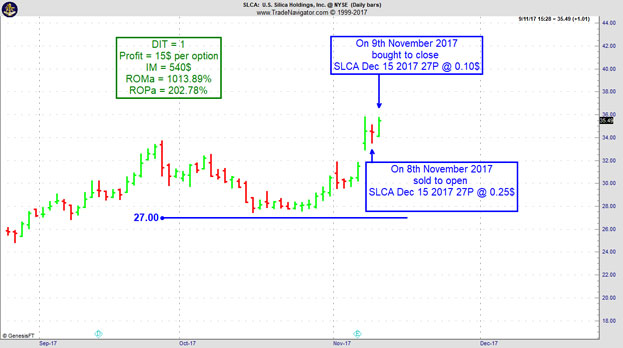
On 7th November 2017 we gave our Instant Income Guaranteed subscribers the following trade on U.S. Silica Holdings Inc. (SLCA). We sold price insurance as follows:
On 8th November 2017, we sold to open SLCA Dec 15 2017 27P @ 0.25$, with 37 days until expiration and our short strike about 22% below price action.
On 9th November 2017, we bought to close SLCA Dec 15 2017 27P @ 0.10$, after only 1 day in the trade for quick premium compounding.
Profit: 15$ per option
Margin: 540$
Return on Margin annualized: 1,013.89%
Return on Principal annualized: 202.78%
Philippe
Receive daily trade recommendations - we do the research for you!
I have another real-world example of manual trade management for you this week.
It’s a day trade in GBP/USD I found myself in a couple of days ago. The GBP has been a really nice market to trade lately providing plenty of swings and volatility.
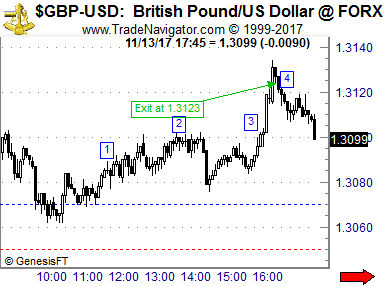
The plan was to get in at a price level where I expected buyers to come into the market around 1.3070, using a relatively tight stop of 20 pips. I had no clear profit target for the trade but wasn’t expecting more than a decent bounce. I also was aware that the market might run into trouble around 1.3120 so I knew I had to watch closer should it approach that level.
Here’s what happened. I got my fill at 1.3070 and shortly after the pound showed me that I wasn’t completely wrong with my idea. Once prices had moved to 1) (see chart) I moved the stop below the lowest low since I got in to 1.3060 to reduce the risk by 50%.
At 2) I was up quite nicely already and moved my stop just slightly below the entry price at to 1.3068. After that prices consolidated between 1.3080 and 90 for a while. Until at 3) prices started to move and exploded about 40 pips within minutes to the upside. This I hadn’t expected, probably some news hit the market.
Now 40 pips isn’t a totally crazy move but I had expected this to take hours so this has been a windfall profit at that point. What to do now? I’ve been up about 60 pips with an initial risk of 20 pips. That’s more than I had been looking for so I could have simply closed out the trade and take the profit. But as the pound was exploding in a parabolic way without any corrections why not just trail the stop really tight and see how far it goes?
That’s exactly what I did at 4) and so I got stopped out at about 1.3120 with a nice profit of 50 pips.
So one way to deal with windfall profits is to not get greedy and start locking them in more and more tight. The more parabolic the move gets, the more aggressive you might want to move your stop. Especially in the currency markets these moves don’t tend to carry on for too long.
Happy Trading!
Marco
Feel free to email Marco Mayer with any questions, This email address is being protected from spambots. You need JavaScript enabled to view it..
To view previous published Chart Scan newsletters, please log in or click on "Join Us,"
shown above, to subscribe to our free "Members Only" section.
A WEALTH OF INFORMATION & EDUCATION:
Joe Ross-Trading Educators' popular free Chart Scan Newsletter has been published since 2004.
Note: Unless otherwise noted, all charts used in Chart Scan commentary were created
by using Genesis Financial Technologies' Trade Navigator (with permission).
Legal Notice and Copyright 2017 Disclaimer - Published by Trading Educators, Inc.
Chart Scan is a complimentary educational newsletter.
Last week I wrote that there were two ratios we would use to compute envelope lines. The second ratio is .146.
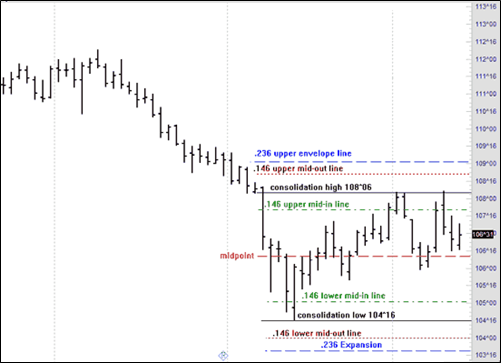
We previously discovered the height of the consolidation as being 3^22. We will now go through a similar procedure to we did last week, using the .146 ratio.
3^22 = 3*32+22 = 118
.146*118 = 17.228 = decimal height of the consolidation.
The high of the consolidation was 108^06.
Converting 108^06 to decimal:
108*32+6 = 3462
Next we add the ratio of .146 of the height to the high of the consolidation, but this time we take a second step as well. We will subtract the ratio of .146 of the height from the consolidation. This will give us two lines: one between the high of the consolidation and the upper envelope line called the “upper mid-out line,” and one between the upper envelope line and the lower envelope line, called the “upper mid-in line.”
3462+17.228 = 3479.228
Converting back to 32nds:
3479.228/32 = 108.725875
.725875*32 = 7 (rounded)
108^23 = upper mid-out line.
3462-17.228 = 3444.772
Converting back to 32nds:
3444.772/32 = 107.649125
.649125*32 = 21 (rounded)
107^21= upper mid-in line.
The lower mid-in line and the lower mid-out lines are computed as follows:
The low of the consolidation: 104^16.
Converting 104^16 to decimal:
104X32+16 = 3344
3344+17.228 = 3361.228
3361.228/32 = 105.038375
.038375*32 = 1 (rounded)
105^1 = lower mid-in line.
We heard from a lot of you that you would like me to continue describing how markets are related. I will intersperse these kinds of tidbits with others. However, since so many asked, today's tidbit is along the lines of how markets relate to fundamentals.
After a breakout, look for a return. Successful returns can beget generous returns.
When a market does finally overcome resistance, penetrate a psychological barrier, or break out of a formation or consolidation, it tends to do so boldly at first. But after its initial thrust, it often needs reassurance. To reconfirm its freedom, it may even return to the very area from which it just broke its constraints.
When traders on the wrong side exit and new participants eagerly enter in the direction of the breakout, the return to retest succeeds in reenergizing, reinforcing, and resuming the new trend.
Futures traders must always expect the unexpected when least expected. Would you, for example, expect prices to be pressured by a surge in supply before a decline in consumption?
Let's look at some relationships in the soybean market.
Brazil harvests soybeans from February through May, during which crushing facilities run at capacity. Flush with new supplies for sale (most soybean oil is consumed domestically), the world's second largest exporter of soybean meal competes aggressively in the world market.
But soybean meal is a high-protein feed supplement for livestock. World consumption is greatest by far during the Northern Hemisphere's cold winter weather, when high caloric intake is required for animals to maintain and gain weight. Conversely, world consumption is lowest during July and August, when grass is available and the weather is hot.
So you might expect soybean meal prices to be especially weak during June, just after Brazil's harvest and just before the heat of the northern summer. But that is not so! Soybean meal has instead been the leader in the grains and soy complex.
Why is that the case? A seasonal transition appears to occur during June. As the surge in South American supplies begins to recede, the market turns back towards old-crop US supplies — perhaps stimulating some change in commercial ownership. U.S. soybean processors, who may have hedged soybean meal during Brazil's harvest in order to protect product prices and profit margins, may now begin covering short positions. Conversely, with low July/August consumption already discounted, the market begins to anticipate a rise in Northern Hemisphere demand — perhaps generating commercial buying.
Although product value within the soy complex has generally begun to favor soybean meal over soybean oil from as early as March, this sudden surge in soybean meal has been especially reflected in spreads between the two right around the middle of June. You might want to mark that on your trading calendar; it has been a high percentage spread trade for many years.
This strength in old-crop soybean meal is also reflected in spreads against new-crop soybean meal. As world demand returns to U.S. supplies, a new crop of soybeans is emerging to offer potentially plentiful new supplies late in the year. So, usually, the old-crop outperforms new-crop, often throughout the rest of the marketing year.
Philippe Gautier: Administration and New Developments
Developer: Joe Ross
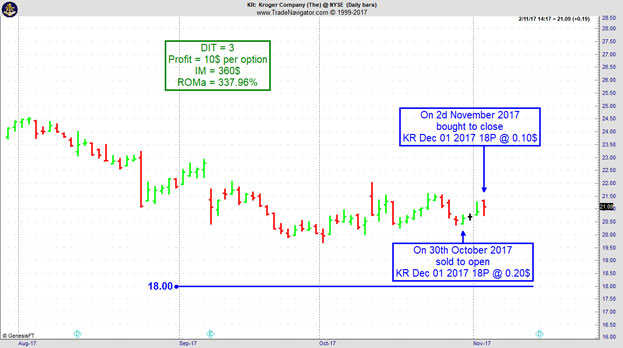
On 29th October 2017 we gave our Instant Income Guaranteed subscribers the following trade on Kroger Company (KR). We sold price insurance as follows:
On 30th October 2017, we sold to open KR Dec 01 2017 18P @ 0.20$, with 31 days until expiration and our short strike about 12% below price action.
On 2nd November 2017, we bought to close KR Dec 01 2017 18P @ 0.10$, after only 3 days in the trade for quick premium compounding.
Profit: 10$ per option
Margin: 360$
Return on Margin annualized: 337.96%
We have also added new types of trades for our IIG daily guidance since 2016, "no loss" propositions with unlimited upside potential, still using other people's money to trade.
Philippe
Receive daily trade recommendations - we do the research for you!
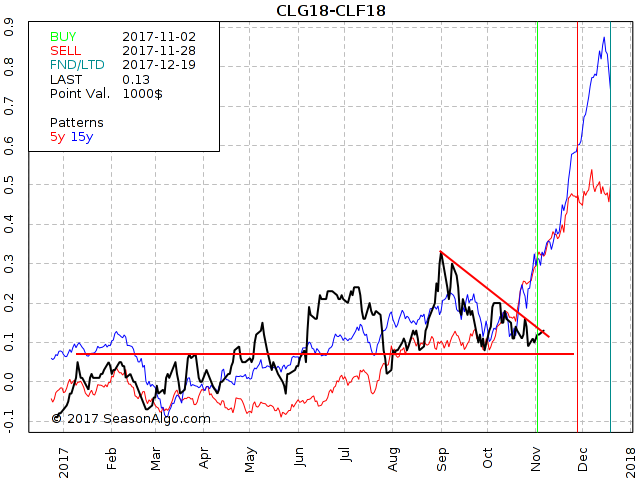
This week, we're looking at CLG18 – CLF18: long February 2018 and January 2018 Crude Oil (NYMEX on Globex).
Today we consider a Crude Light calendar spread: long February 2018 and January 2018 Crude Oil (symbols on CQG for the January – February spread is CLES1F8). The spread has found support around 0.070 several times during the last few months. At the same level, the spread has run into resistance during the first few months of 2017. As long as the spread stays above break even, there is a good chance the spread will follow it seasonal tendency to the up-side for the next few weeks.
Do you want to see how we manage this trade and how to get detailed trading instructions every day?
To view previous published Chart Scan newsletters, please log in or click on "Join Us,"
shown above, to subscribe to our free "Members Only" section.
A WEALTH OF INFORMATION & EDUCATION:
Joe Ross-Trading Educators' popular free Chart Scan Newsletter has been published since 2004.
Note: Unless otherwise noted, all charts used in Chart Scan commentary were created
by using Genesis Financial Technologies' Trade Navigator (with permission).
Legal Notice and Copyright 2017 Disclaimer - Published by Trading Educators, Inc.
Chart Scan is a complimentary educational newsletter.
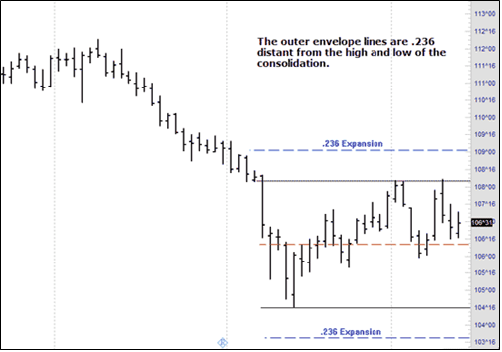
Continuing with the bond illustration to this point, the next step is to compute a couple of very interesting ratios. These ratios are ones I came across long before I ever heard of Gann or Fibonacci. If they turn out to be the same as the ratios of either of them, so be it. I know that I discovered them on my own, and have used them for many decades. They work amazingly well when trading inside consolidation. The ratios are used to create an envelope. The first ratio will be used to compute both upper and lower envelope values.
Last week we discovered that the height of the consolidation was 3^22. We must now take a ratio from the value of the height. The ratio is .236. To compute the ratio we will convert the height from 32nds to decimal.
3^22 = 3*32+22 = 118
.236*118 = 27.848
The high of the consolidation was 108^06.
Converting 108^06 to decimal:
108*32+6 = 3462
Next we add the ratio of .236 to the high of the consolidation to obtain a value for the upper envelope line:
3462+27.848 = 3489.848
Converting that back to 32nds:
3489.848/32 = 109.05774
.05774*32 = 2 (rounded)
The upper envelope line is placed at 109^2
We now have to obtain a value for the lower envelope.
The low of the consolidation was 104^16.
104*32+16 = 3344
Next we subtract the ratio of .236 from the low of the consolidation to obtain a value for the lower envelope line:
3344-27.848 = 3316.152
Converting back to 32nds:
3316.152/32 = 103.62975
.62975*32 = 20 (rounded)
The lower envelope line is placed at 103^20
Next week we will compute another ratio and add it to and subtract from both the high and the low of the consolidation.
Here is an encapsulated generalized view of markets and trading:
Try to develop an inter-market view of how futures markets correlate with one another. Cows are fed grain to fatten them up, so when grain prices rise, expect higher meat prices — ergo, be ready to trade meats from the long side.
If meat prices go up, then so should other food prices like cocoa and sugar for candy bars.
Orange juice, coffee, and pork belly bacon are served for breakfast with eggs, and wheat toast is buttered with (ugh) corn oil margarine. If corn prices rise, the demand for wheat will rise, and both wheat toast and corn oil margarine will rise in price. Lesson: favor grains to the long side.
Half-witted politicians think they are being ecologically responsive by pushing for ethanol, but all this does is push the price of corn higher, then the price of meat higher, and finally the price of a lot of other things higher. Why do I call the politicians half-wits? Because anyone with even the smallest amount of knowledge knows that all you can get from corn as an energy source is exactly what you put into it. One unit of energy in and one unit of energy out.
If the trend in gold and interest rates has been declining, deflation is prevalent. Be ready to trade bonds and notes from the long side.
The opposite trends apply to inflation. When the prices of gold and interest rates are rising, expect most commodities to follow that trend, except independent currencies and the stock market, which decline with rising rates.
Manufacturers increase profits two basic ways without the need for increased efficiency: by lowering labor and raw materials costs, or by raising prices.
When inflation is prevalent, higher raw material costs are passed on to higher finished product costs to maintain a fixed profit margin. The Producer Price Index, PPI, usually increases before the Consumer Price Index, CPI, does. Factory utilization over 85% is thought to forecast rising inflation as well.
Philippe Gautier: Administration and New Developments
Developer: Joe Ross
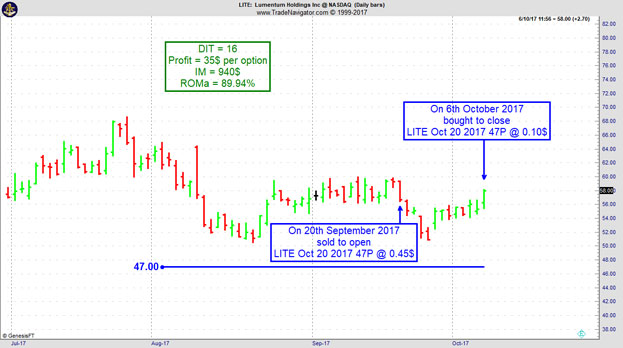
On 19th September 2017 we gave our Instant Income Guaranteed subscribers the following trade on Lumentum Holdings Inc (LITE). We sold price insurance as follows:
On 20th September 2017, we sold to open LITE Oct 20 2017 47P @ 0.45$, with 30 days until expiration and our short strike about 21% below price action.
On 6th October 2017, we bought to close LITE Oct 20 2017 47P @ 0.10$, after 16 days in the trade for quick premium compounding.
Profit: $35 per option
Margin: $940
Return on Margin Annualized: 89.94%
We have also added new types of trades for our IIG daily guidance since 2016, "no loss" propositions with unlimited upside potential, still using other people's money to trade.
Philippe
Receive daily trade recommendations - we do the research for you!
Protective stops have to be related to the strategy and the markets being traded. It is not a good idea to use a $200 stop that might be appropriate on a corn contract in sugar or the soybean market. This is because each market has a different value and different volatility. Protective stops should be linked to the volatility and value of the underlying market.
It is also a major mistake to use a protective stop purely based on your account size and how much you are willing to lose. If you have a $10,000 account and you don't want to risk more than $500 on any given trade, but the stop in this particular market and trade is at $750, you DON'T take the trade. Risk management and money management are major parts of trading, and have to be implemented into your trading strategy.
In this video, Marco talks about why having a view on the direction of a market isn't enough. The reason is that just having a directional view doesn't make a trade...find out why!
Happy trading,
Marco
Feel free to email Marco with any questions, This email address is being protected from spambots. You need JavaScript enabled to view it..
To view previous published Chart Scan newsletters, please log in or click on "Join Us,"
shown above, to subscribe to our free "Members Only" section.
A WEALTH OF INFORMATION & EDUCATION:
Joe Ross-Trading Educators' popular free Chart Scan Newsletter has been published since 2004.
Note: Unless otherwise noted, all charts used in Chart Scan commentary were created
by using Genesis Financial Technologies' Trade Navigator (with permission).
Legal Notice and Copyright 2017 Disclaimer - Published by Trading Educators, Inc.
Chart Scan is a complimentary educational newsletter.
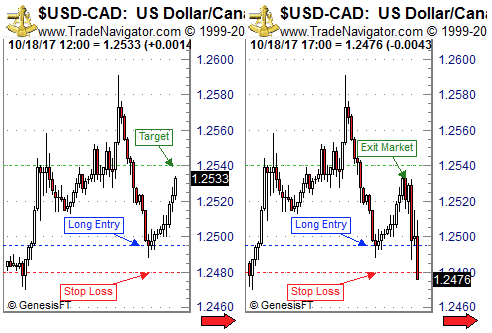
I recently found myself in a day trade in USD/CAD that I’d like to talk about. The exact reason for my entry actually doesn't matter for this article but the idea was to buy the pair at a support level where I expected it to at least temporarily bounce off nicely. The best case outcome for this trade was that it would hit my profit target that I had set shortly after the entry. It would give me a nice profit of more than two times my risk and I set it at a price where I was expecting the potential rally to run into sellers again.
For sure I’ve been lucky with this one as shortly after the entry the market rallied nicely straight up for hours without any significant corrections. So the next morning (entry happened during the night) I was pleasantly surprised that USD/CAD was already approaching my profit target, see below on the first chart the market looked like at that point in time.
USD/CAD was just about 7 pips short of reaching my profit target while my stop-loss was still at the initial stop loss level. I think I’ve read a similar story in one of the market wizards books, but in a summary, the situation was like this. The market was trading very close to my profit target that I had set because I expected sellers around that price level. At the same time, the trade could still turn into a full loss as I hadn’t moved my stop loss.
So, in other words, the potential for further profits was just about 7 pips while my risk was about 53 pips! That’s when you simply cannot be stubborn in a discretionary trade, you got to act!
As this had been such a nice, stress-free rally to that point and I’ve been already so close to the profit target I decided to simply take my money and run. I just got out at the market.
If the profit target had been slightly further away I might have chosen another option. Go down to a lower timeframe and use a tight trailing stop to either get stopped out with a nice profit or have the market run into the profit target.
On the right chart, you can see what happened after that. The rally fizzled and USD/CAD plummeted. So don’t be stubborn in trading!
Happy trading,
Marco
Feel free to email Marco with any questions, This email address is being protected from spambots. You need JavaScript enabled to view it..
In this issue of Chart Scan and in the next, I will be showing you a couple of confirming ways to trade sideways markets. I think you’ll find them interesting.
First, we must have a rule. We can trade in a consolidation only if the height of the consolidation is equal to or greater in dollars than the exchange minimum margin for entering the trade, or the exchange maintenance margin for holding overnight, at the time we realize the market has entered into the consolidation. The choice is yours.
As with all rules, there are exceptions. If a market has great volatility, we can use 1/2 the exchange minimum margin, or 1/2 the maintenance margin. Again, the choice is yours.
My example for this study is the seen on the daily T-Bond chart below. It could have been any market. A market is the market, and a chart is a chart. I'll be switching between two programs because I need to utilize two different studies. Unfortunately, I do not have them both in the same software.
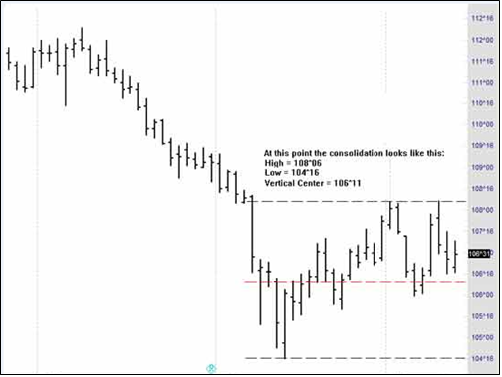
The margin for the T-Bond was $1,620 and the maintenance margin was $1,200. The high of the consolidation was 108^06 and the low was 104^16, for a height of 3^22, which is equal to $3,687.50 — more than enough to meet our rule. In fact, the height was more than enough to meet our rule for great volatility: 1/2 the exchange minimum margin.
Let's get a bird’s eye view of how the bonds dropped into a consolidation area.
Next week we will do some measuring and draw some definitive lines on this chart. For now, let’s see where we can begin counting the consolidation so far.
We must ask: “which bar or Close of which bar most represents the vertical center of the consolidation?”
Stock book values, Price-Earnings Ratios, and stock dividends are not the fundamentals that determine a stock's price trend. Strong increased earnings, preferably over the last five years, are the most bullish fundamental statistic related to the price trend of a stock.
The best P-E ratio for strong rising stocks is over 20. These stocks remain in strong bull markets about 18 months. At the end of a typical bull market move, the P-E ratio will have doubled to over 40.
Stock traders should buy stocks that have increased earnings of 50% greater over the previous quarter minimum and show a solid earnings trend on an annual basis for five years. Be prepared to buy these stocks the moment they break out to the upside on a technical basis, or buy them when they post 52-week new highs. Wal-Mart and Tyson increased over 4000% in the decade of the 1980's. Both of these Northwest Arkansas companies met the above evaluation criteria. Another way to find good stocks is through the CANSLIM method. William O'Neil gives his excellent CANSLIM method away with a free Investor's Daily trial subscription. You might want to try it.
When I was living on a mountain top in South Africa I had only end of day data. The expense of using the Internet was so prohibitive as to make anything else not worthwhile. That is when I developed my own method for selecting stocks. It was really quite simple, and it worked. I have shown it to many of my students and they have seen it work. The method is to look for Traders Trick Entries ahead of Ross Hooks in rising markets.
Here is the "magic" way I did my stock selection: I hope you are ready for this! I typed in stock symbols aa, ab, ac, ad, ae, af, etc. consecutively, until I found a stock that was making a TTE ahead of a Ross Hook. For the next stock, I began with ba, bb, bc, bd, be, bf, etc. I rarely completed a letter series before I found something that met my qualifications. Furthermore, I don't recall having to use a 3-letter symbol to get the trades I wanted. The only qualification was volume, and I insisted on 400,000 shares/day. Sometimes it was drudge work doing it, but it met my other qualification — to be able to trade from any place in the world, including a mountain top, as long as I had a telephone, a modem, and a price chart.
Philippe Gautier: Administration and New Developments
Developer: Joe Ross
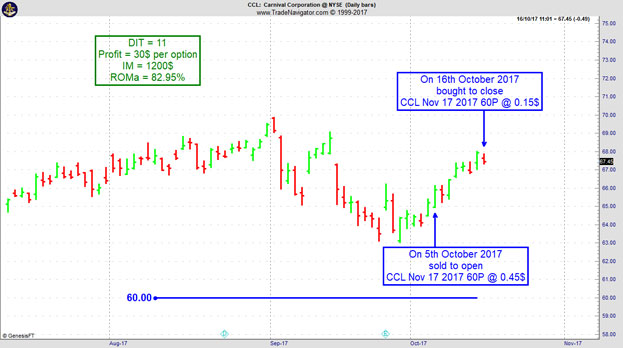
On 4th October 2017 we gave our Instant Income Guaranteed subscribers the following trade on Carnival Corporation. (CCL). We sold price insurance as follows:
On 5th October 2017, we sold to open CCL Nov 17 2017 60P @ 0.45$, with 42 days until expiration and our short strike about 8% below price action.
On 16th October 2017, we bought to close CCL Nov 17 2017 60P @ 0.15$, after 11 days in the trade for quick premium compounding.
Profit: $30 per option
Margin: $1,200
Return on Margin Annualized: 82.95%
We have also added new types of trades for our Instant Income Guaranteed daily guidance since 2016, "no loss" propositions with unlimited upside potential, still using other people's money to trade.
Philippe
Receive daily trade recommendations - we do the research for you!
After a good-sized win or series of wins, you may get a feeling of invincibility with regards to your trading prowess. This could last for a period of time; an invincibility that quickly dismisses from mind the prior long cold spells suffered through, what a struggle it was at the time, how much toil, trouble, and, yes, even luck, that it took.
A state of great ease and relaxation can envelop us. If you won $5,000, for instance, you might feel like, “Heck, now I can lose $1,000 or $2,000, and still be up $3,000.” This feeling of fatness could be self-fulfilling. Of course you are too smart to fall into this trap; you would see it coming.
Unless you take this warning seriously, you might very well lose that money back — at least a serious chunk of it. How am I able to say that with such certainty? Because overconfidence makes one careless. If you do not pay attention to the details and self-control that helped you win in the first place, the likelihood of continuing to be successful rapidly diminishes.
One thing is true in trading: when things are going so well that it is hard to believe what is happening, don't change the disciplines and behavior that are working for you!
To view previous published Chart Scan newsletters, please log in or click on "Join Us,"
shown above, to subscribe to our free "Members Only" section.
A WEALTH OF INFORMATION & EDUCATION:
Joe Ross-Trading Educators' popular free Chart Scan Newsletter has been published since 2004.
Note: Unless otherwise noted, all charts used in Chart Scan commentary were created
by using Genesis Financial Technologies' Trade Navigator (with permission).
Legal Notice and Copyright 2017 Disclaimer - Published by Trading Educators, Inc.
Chart Scan is a complimentary educational newsletter.
I’ve been discussing ways to spot congestion while it is still early in the game. Another way to know when you are in congestion is to see four bars with Opens, Closes, or both, inside the price range of another bar. Typically, you will see a large magnitude price bar, followed by price bars that all Open or Close within the trading range of the larger bar.
Sometimes the large bar occurs within the consolidation and is not the first bar in the series. However, the large bar usually occurs first.
This should not be surprising. I have proven over the years that some form of consolidation typically follows large magnitude bars.
A gap beyond the range of the previous bar is also a large bar move. Why? Because, in effect, prices have moved from the previous bar's close to the open of the bar following the gap. This, too, warns of an impending consolidation.
There is not enough room in this Chart Scan for me to show all the possible combinations of dojis, Open-high, Close-low bars, or Open-low, Close-high bars. Just remember that when you see these things happening, the market is in, or is about to go into, consolidation.
If these consolidation areas hook together, linked at times by single-legged trends, you then have what I call Congestion (11-20 bars) or a Trading Range (21 or more bars).
The question becomes how to trade effectively inside a sideways market. It's important for you to know, because at any time markets can and do go into prolonged consolidations — sometimes remaining in them so long that it becomes difficult to make a living without a good understanding of how to trade such markets.
In the next issue of Chart Scan we will take a look at how it might be done.
Here's a piece of advice: Don’t set goals too high.
A few months ago, happy Harry started trading. He read and heard that it is important to set specific goals and to try to reach them. Harry thought, "I really ought to set high goals for myself; doing that will help me to try hard. I think I'll shoot for a 20% profit per month."
But has Harry set a realistic goal? Dreams of getting rich can be a powerful motivator. However, setting unrealizable goals and then failing to meet them can demoralize Harry and actually defeat his efforts. There's a difference between high hopes and specific goals that you work to obtain, having a methodical and detailed plan.
High performance goals are not always the best goals. Harry may not have the experience or skills to reach a goal that exceeds his abilities. For example, would you try to swim the English Channel if you can't even swim two laps in a swimming pool? You have to avoid making overly high trading goals until you have the knowledge and skills to achieve them.
Nevertheless, here at Trading Educators we observe many novices making the mistake of setting their goals too high. We can understand why they do it, but we always try to dissuade them. Our culture teaches people who are ambitious to set high goals. We are taught that it is necessary to set high standards for ourselves and go out and do whatever it takes to reach them. But studies have shown that what is most important is the way you go about achieving goals.
When aspiring traders set high goals that exceed their skills, they usually fail, feel discouraged, and give up. So if you are an aspiring trader, like Harry, it may not be a good idea to immediately strive for a 20% profit per month.
If you're an aspiring trader, set yourself up to win, but don't set performance goals that are beyond your ability to achieve. Break your overall goal into specific steps, and pat yourself on the back after you succeed at each step. When you become a seasoned trader with advanced skills, you can set out to achieve your high performance goals. But in the early part of your trading career, it's in your best interest to focus on building your trading skills rather than on achieving a huge profit every month.
Philippe Gautier: Administration and New Developments
Developer: Joe Ross
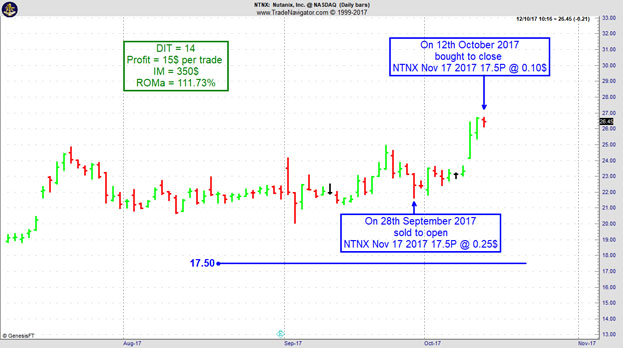
On 27th September 2017 we gave our Instant Income Guaranteed subscribers the following trade on Nutanix Inc. (NTXN). We sold price insurance as follows:
On 28th September 2017, we sold to open NTNX Nov 17 2017 17.5P @ 0.25$, with 49 days until expiration and our short strike about 24% below price action.
On 12th October 2017, we bought to close NTNX Nov 17 2017 17.5P @ 0.10$, after 14 days in the trade for quick premium compounding.
Profit: $15 per option
Margin: $350
Return on Margin Annualized: 111.73%
We have also added new types of trades for our Instant Income Guaranteed daily guidance since 2016, "no loss" propositions with unlimited upside potential, still using other people's money to trade.
Philippe
Receive daily trade recommendations - we do the research for you!
“Steaming”, in poker parlance, is what happens when your queen's-up full house loses to a king's-up full house, or when your four kings lose to four aces. The term undoubtedly comes from the fact that steam begins to come out of your ears as you watch a pile of chips and money slide across the table to another player.
Because poker and trading have much in common, steaming can also happen to you in trading. Just imagine the last trade that moved perfectly into your direction right after your entry. Everything looked just fine, and you thought you would make some nice profit with this trade. But suddenly the market moved against you overnight on some bad news, and the perfect winning trade turned out to be a loser. Does this sound familiar? I'd bet it does.
But what can you do in such a situation? If possible, don't steam, which of course is easier said then done. But while the pain may be real, steaming is counterproductive. Everyone who has traded for some time recognizes that these trades are going to occur. Become annoyed. Become angry, if you must. Then forget about them. Wipe the slate clean. Resist the urge to give these occurrences a lot of emotional weight. Develop the ability to quickly reset yourself back to your normal trading, and reset your passions back to zero. The ability to go from anger and outrage to completely neutral in a very short time is a valuable skill in trading.
Use the time usually devoted to steaming to go back over the last trade in your mind to see if you missed anything. Could you have managed your trade differently? Did you put some extra money on the table that you might have saved? There is always something to be analyzed. Do it neutrally. Turn steam into analysis. Recognize that these things happen, and will balance out if you keep your balance!
To view previous published Chart Scan newsletters, please log in or click on "Join Us,"
shown above, to subscribe to our free "Members Only" section.
A WEALTH OF INFORMATION & EDUCATION:
Joe Ross-Trading Educators' popular free Chart Scan Newsletter has been published since 2004.
Note: Unless otherwise noted, all charts used in Chart Scan commentary were created
by using Genesis Financial Technologies' Trade Navigator (with permission).
Legal Notice and Copyright 2017 Disclaimer - Published by Trading Educators, Inc.
Chart Scan is a complimentary educational newsletter.
"Teach our students the truth in trading - teach them how to trade,"
and
"Give them a way to earn while they learn - realizing that it takes time to develop a successful trader."
Derivative transactions, including futures, are complex and carry a high degree of risk. They are intended for sophisticated investors and are not suitable for everyone.
There are numerous other factors related to the markets in general or to the implementation of any specific trading program which cannot be
fully accounted for in the preparation of hypothetical performance results, and all of which can adversely affect actual trading results.
For more information, see the Risk Disclosure Statement for Futures and Options.