Trades in Stock Options. Receive daily trade recommendations. Can you imagine discovering a way to trade that promises instant income? If you think such a method is impossible, think again. It is definitely achievable, and everything you need to know is available online for one low price that includes special three-part online webinars.
Ambush is a time-proven mean-reversion day trading System focused on a variety of Futures markets around the globe. With Ambush Signals you can now easily follow the Ambush System on a subscription basis for educational purposes.
If you didn't fail early in your trading business, then you have probably been around long enough to realize that many of the problems you encounter as a trader are those that derive from your own individuality. Such problems are common among traders and, in fact, common among all human beings. Seeking spiritual help from a power much greater than your own is the area I address in the "Spiritual Side of Trading".
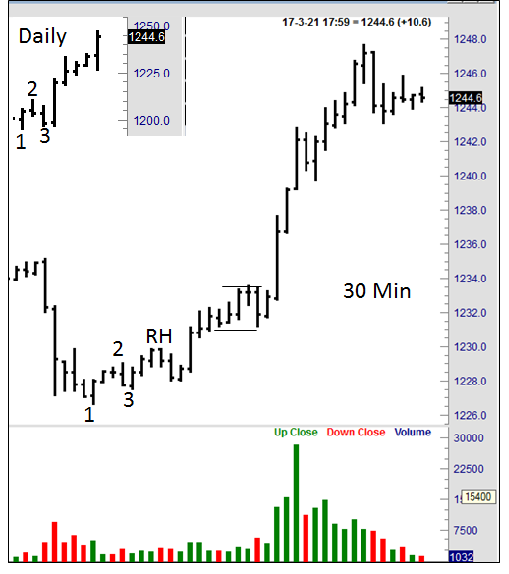
This issue of Chart Scan is about "ledges." Ledges are a formation described in the Law of Charts. A Ledge must occur in a trend. It must consist of not more than 10 bars from beginning to end. A ledge must have two matching highs or very close to matching highs, and two matching or very close to matching lows.
You trade a breakout of the ledge only in the direction of the major trend or swing. The 30-minute Gold chart below contains an almost perfect ledge, with two exact matching lows at 1231.20 and two almost matching highs at 1233.50 and 1233.40. In this case a sell stop was placed at 1233.50. The question is: "What was the direction of the former trend or swing?" We can see that prices had already made a 1-2-3 low, followed by a Ross Hook (RH).
We can confirm that uptrend by going to the daily chart, which I have inset into the graph of the 30-minute chart (upper left corner). What we see is that the direction of the current swing is up. Therefore we trade the breakout of the ledge to the upside.
When you are riding a winner, avoid looking at it all the time. Search out new trades in other markets. Absorb yourself with looking for opportunities elsewhere, if you are the type that must have market action. Diversification is the key word here. But remember, you can afford to take only the very, very best trades elsewhere when you are riding a winner. Don’t blow away the profits you are making on your winner by maniacal trading in other markets.
The best and perhaps the only way to make money in the markets is to cherish and succor your winning positions. Stand back and admire them, appreciate them. Let them develop, unfold, and make you money.
Please don’t confuse staying with winning trades with long term trading. They are not the same. In my own case, most of my long held winners start with a short term daytrade held overnight because I am trading towards the breakout of a major entry signal, such as a Ross hook, or a 1-2-3 high or low.
For most traders, because they don’t have the deep pockets, the patience, or both, to be long term traders, shorter term trading is best. It is in shorter term that the trader with the smaller account can profit.
Here’s a good way to handle your money management: Divide your risk capital into 8 percent segments of declining equity balance. (For example, $10,000 account, risk maximum $800 total on your first trade. If you lose $500, then risk a maximum of 8% of $9,500 on the next trade.)
Such a strategy will allow you to successfully take more than a dozen hits in a row. The odds of such NOT happening are greatly in your favor. With mediocre trade selection or worse, such as the flip of a coin, you should get at least one winner. If you ride that winner, you should come out ahead.
Practice not trading as often as you have been. The brokers are rich enough, you don’t need to trade to make them happy. When you have a winner, reset your stops often, keep them moving.
There’s a saying in poker that you should think about from time to time. It goes something like this: “If you’ve been in the game for twenty minutes, and haven’t yet figured out who the patsy is, then it’s YOU!” Think about that when you run your business of trading. Take your time, be patient, let the markets show you what to do. Let the markets come to you, fill your positions, and then take you for the supreme joyride of making a year’s pay on a single trade. The ride is worth the wait.
Philippe Gautier: Administration and New Developments
Developer: Joe Ross
TRADE WITH NO LOSSES
Here's our latest example!
MU Trade
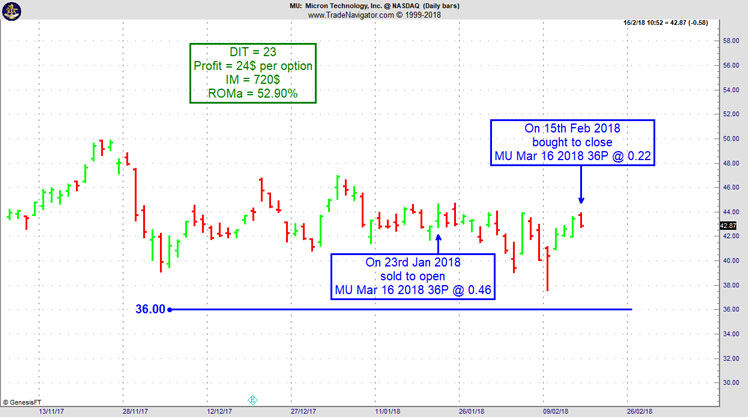
When the put short strike is carefully chosen, we can withstand a sharp downside correction without any trouble. On 22d January 2018 we gave our Instant Income Guaranteed subscribers the following trade on Micron Technology Inc (MU). Price insurance could be sold as follows:
On 23rd January 2018, we sold to open MU Mar 16 2018 36P @ 0.46$, with 53 days until expiration and our short strike about 16% below price action,
On 15th February 2048, we bought to close MU Mar 16 2018 36P @ 0.22$, after 23 days in the trade; our short strike was never challenged during the sharp market correction, we only had to stay a little longer in the trade to close it.
Profit: 24$ per option
Margin: 720$
Return on Margin annualized: 52.90%
Philippe
Receive daily trade recommendations - we do the research for you.
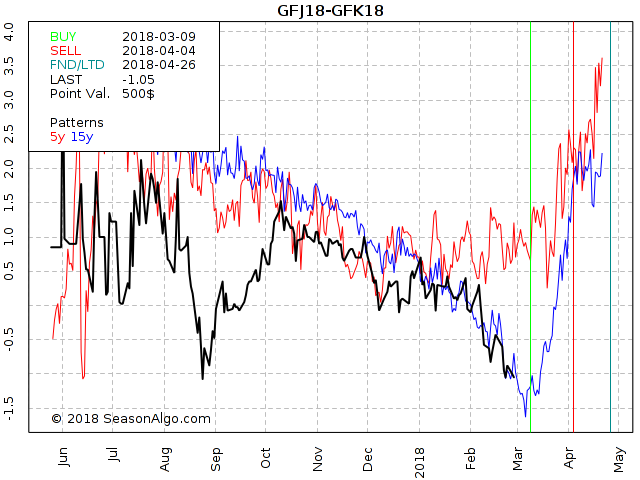
This week, we're looking at long GFJ18 – GFK18: long April 2018 and short May 2018 Feeder Cattle (CME on Globex).
Today we consider a Feeder Cattle calender spread: long April 2018 and short May 2018 Feeder Cattle (CME on Globex). As we can see on the seasonal chart above, the spread usually turns around at the beginning of March and starts to move to the up-side. In addition, the spread reached the August low after moving strongly lower during the last few weeks. Will the August 2017 low hold and will the spread follow it’s 15 year seasonal pattern to the up-side during the next few weeks? Of course, we don’t know yet and I would not want to jump into this spread only because the seasonal pattern looks attractive. But if we get an entry signal from the chart I might jump into this trade using a close stop just below the February low.
Andy Jordan is the editor for Traders Notebook which shows you Futures Trading Strategies in Spreads, Options, and Swing Trades. Learn step-by-step how to trade successfully.
To view previous published Chart Scan newsletters, please log in or click on "Join Us,"
shown above, to subscribe to our free "Members Only" section.
A WEALTH OF INFORMATION & EDUCATION:
Joe Ross-Trading Educators' popular free Chart Scan Newsletter has been published since 2004.
Note: Unless otherwise noted, all charts used in Chart Scan commentary were created
by using Genesis Financial Technologies' Trade Navigator (with permission).
Legal Notice and Copyright 2018 Disclaimer - Published by Trading Educators, Inc.
Chart Scan is a complimentary educational newsletter.
Trading futures is gambling only when you trade them without full knowledge of what you are doing. There is a good measure of self-knowledge required to choose the proper course to follow if you want to become a trader. It has even been postulated that many small traders in the futures markets, without knowing it, secretly want to lose. They jump in with high hopes—but feeling vaguely guilty. Guilty over 'gambling' with the family's money, guilty over trying to get 'something for nothing,' or guilty over plunging in without really having done much research or analysis. Then they punish themselves, for these or other sins, by selling out, demoralized, at a loss.
A trader is gambling when he/she trades from ignorance. The gambler makes his trading decisions on gut feelings, hopes, dreams of getting rich quick, tips from the broker, “inside information” from friends, and from the improper understanding and use of indicators, oscillators, moving averages, and mechanical trading systems. In general, he is looking for a way to shortcut having to truly learn what is going on. Unfortunately, most people who attempt to trade fall into this category.
However, true trading is actually speculation (managed risk). The speculator is willing to accept the risk of price fluctuation in return for the greater leverage that comes with that risk in the hopes of earning a greater profit. The true speculator makes his trading decisions based on knowledge gathered from Information about the behavior of the underlying, seasonality, historical and current trends, chart analysis, fundamentals, the market dynamics, and knowledge of those who trade it.
Andy Jordan is the editor for Traders Notebook which shows you Futures Trading Strategies in Spreads, Options, and Swing Trades. Learn step-by-step how to trade successfully.
I suppose you want to tell me that there is no point in your watching the weekly charts because the risk is too great. But the truth is that the risk on the weekly chart is no greater than the risk on a 1-minute chart — at least not if you handle it correctly. Let's say you decide you can afford to risk $300 on a trade. You may have decided that amount in a number of different ways. It could be a flat amount you are willing to risk on any trade. It could be an amount that is a certain percentage of your account, or it could be that you are willing to risk a certain amount of ticks, pips, cents, or points. Whichever way you have arrived at the $300, the amount still is $300. My point is a risk of $300 is a risk of $300, no more, no less.
Think about this: the move on a weekly chart as it violates last week's high or low is going to have a lot more momentum behind it than a move on a 5-minute chart as it violates the previous 5 minutes' high or low. It takes a lot more momentum energy to overcome a weekly high or low than it does to overcome the high or low of a lesser time frame, wouldn't you agree?
Every trade ever made begins intraday. Day traders enter and get out by the end of the day. Anything else is a position trade, but every position trade begins intraday, regardless of the time frame you are using for your entry signal. I have many times used a weekly chart signal to enter a day trade, simply because the moves are much stronger on the weekly chart than they are on an intraday chart.
Philippe Gautier: Administration and New Developments
Developer: Joe Ross
TRADE WITH NO LOSSES
Here's our latest example!
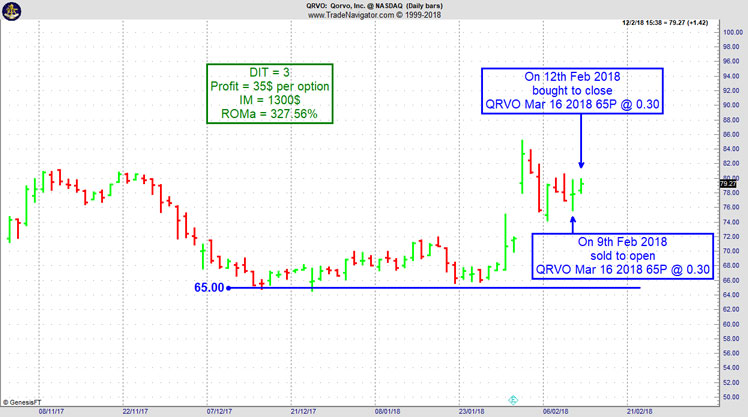
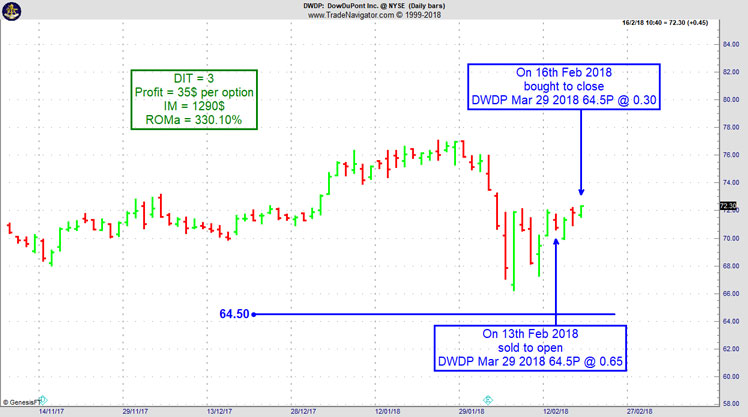
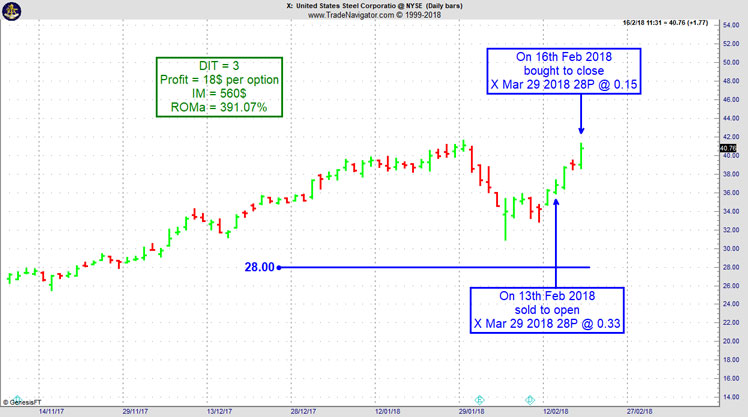
QRVO-DWDP-X
Last week we closed 3 trades within 3 days for annualized returns on margin between 327 and 391%, using spikes in implied volatility (QRVO) or entering at the very beginning of an emerging uptrend (X, DWDP) to maximize the premium sold. All our short put strikes were at a very safe distance from market action.
This is the kind of safe and quick premium compounding we are looking for.
Philippe
Receive daily trade recommendations - we do the research for you.
After the recent harsh correction in the stock markets and cryptocurrencies, many traders and especially investors currently find their accounts in a not so nice drawdown. So I thought this might be a good time to give some advice on how to deal with such drawdowns.
What’s a drawdown? Here’s a quick explanation: You buy one stock of a company at $100 and after a month it’s trading at $120. You’re now having profits of $20 or 20% on your account. Now the stock drops from 120 to 110, that’s $10 off the highs and therefore a $10 or 8.3% drawdown from the so-called high-water mark.
You don’t like these drawdowns at all? Neither do I but the fact is that drawdowns are the norm in trading, not the exception. Most of the time you’re simply not making new all-time highs in your equity curve. Meaning that usually, you’re in some kind of drawdown so if you want to completely avoid drawdowns, stop trading. Or learn how to deal with them.
Here are some tips on how to make it thru these unavoidable trading valleys…
1) Zoom out: You’re long the S&P 500 and woke up to a 10% drawdown recently? That’s bad but hey it more than tripled over the last 10 years and is up more than 65% since early 2016. Heck, it moved up about 20% just within the last year! So yes a 10% drawdown is not nice but seeing it in the right perspective helps a lot to see things actually aren’t that bad. Zoom out and get some distance to see the drawdown in it’s larger context.
2) Switch perspective: You’re in a drawdown and therefore lost money. That’s tough but how does this actually affect your daily life? Is there something you can’t do today you’d have been able to do otherwise? Any real changes in the quality of your lifestyle? Did your wife and kids leave you? If so you surely overtraded! But if not, the only thing that actually changed is your trading account balance. That’s not nice as it’s still real money you could do real things with but being aware that your daily life isn’t actually affected is a healthy thing to remember. It helps to reduce the emotional stress and to get back into the right mindset for trading. Stop the mental drawdown and get back up!
3) Think Long-term: Remind yourself of your long-term goals regarding trading. Why you are you in this business at all. If your plan is practical the current drawdown won’t change it. You can still reach the long-term goal and succeed. See this drawdown for what it is and what happens in every business out there. You’re having a bad month/quarter/year. No reason to close your business right? Same with trading and in a couple of years you won’t even remember that little setback.
4) Look at the past: Have a look at previous similar drawdowns. The S&P had 10% drawdowns in the past, Bitcoin had 50% corrections and the system you’re trading might have had similar drawdowns in the past. This helps to notice that the drawdown you’re in might not be as unusual as you first thought. But what helps most is to notice what happened after these previous drawdowns. That’s what you want to focus on.
5) Move on: Finally you got to accept the drawdown and move on. Everyone has these if you don’t believe me look at other professional traders/funds equity curves. Even the best out there have drawdowns especially if they’re in the game for many years. Not really accepting the drawdown makes you likely to do real mistakes. Or you might end up being paralyzed, unable to put on the next trades and miss exactly what would take you out of the drawdown. So in the end, you have to forget about it and move on!
Happy Trading!
Marco
Feel free to email Marco Mayer with any questions, This email address is being protected from spambots. You need JavaScript enabled to view it..
To view previous published Chart Scan newsletters, please log in or click on "Join Us,"
shown above, to subscribe to our free "Members Only" section.
A WEALTH OF INFORMATION & EDUCATION:
Joe Ross-Trading Educators' popular free Chart Scan Newsletter has been published since 2004.
Note: Unless otherwise noted, all charts used in Chart Scan commentary were created
by using Genesis Financial Technologies' Trade Navigator (with permission).
Legal Notice and Copyright 2018 Disclaimer - Published by Trading Educators, Inc.
Chart Scan is a complimentary educational newsletter.
There is a tendency to become overemotional when trading. Overcoming the propensity to play emotionally requires a conscious commitment to specific trading objectives. This entails choosing a target, developing a strategy, and finding a method for adhering to it. A goal enables you to keep a relatively even keel through good and bad periods, to sustain momentum, and to keep from becoming bored.
Of course, most traders enjoy the process of building up profits, the satisfaction of adept trading, or simply outwitting the crowd. But it is not just the outcome that is important, it is also the process. The tension that accompanies being in the market is an integral part of the overall experience. For profit without risk or loss without care drains much of the pleasure out of the trading process.
Can it hurt your health? I really can’t say. The wrong kind of stress is known to be harmful to your health, but some stress is what makes you perform at your best.
Andy Jordan is the editor for Traders Notebook which shows you Futures Trading Strategies in Spreads, Options, and Swing Trades. Learn step-by-step how to trade successfully.
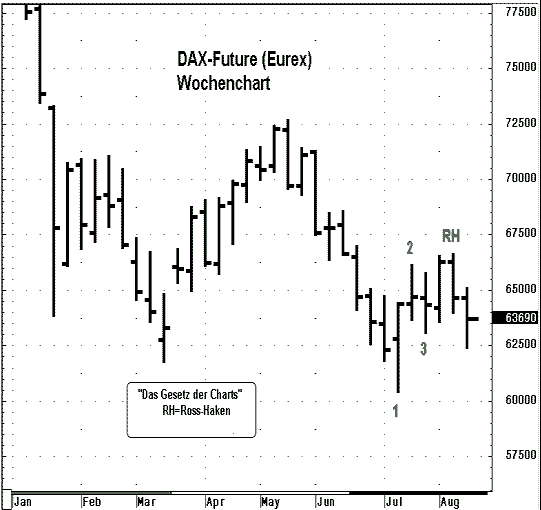
Viewing the chart above, are prices trending or are they consolidating? This kind of question comes up often. According to The Law of Charts, there is a defined trend showing on the chart. But which kind of trend? Is it an uptrend or a downtrend, and how can you tell which it is?
The Law of Charts states that trend supersedes any form of consolidation. That means if you find a trend within an area of consolidation, you must assume prices are trending. At Trading Educators, we call consolidations of 11 to 20 bars "congestion," and consolidations of 21 or more bars "trading ranges" However, in the chart above, if I count from the low marked "1," or even if I count from 3 bars prior to the low marked "1" until the last bar shown, we have nothing visible that can be called either congestion or a trading range. So what do we have?
The chart reveals a correctly marked 1-2-3 low formation. Following the breakout of the #2 point of a 1-2-3 low formation, any failure of prices to move higher is a Ross Hook (RH).
The Law of Charts states that if prices violate the #2 point of a 1-2-3 low formation, we have a defined trend. It further states that if prices were to violate the high or the RH, we would have an established trend.
So based on TheLaw of Charts, we are looking at a defined uptrend. If prices were to violate the RH we would have an established uptrend, but that has not taken place based on the current chart view. I think the rest of the chart can be quite easily understood, even though it is in German. "Wochenchart" just means "weekly chart." "Das Gesetz der Charts" means "The Law of Charts." "Ross-Haken," means "Ross Hook."
What I like best is that in any language, a chart is a chart. For those who might not know, the DAX is traded at the Eurex Exchange.
Philippe Gautier: Administration and New Developments
Developer: Joe Ross
TRADE WITH NO LOSSES
Here's our latest example!
LITE Trade
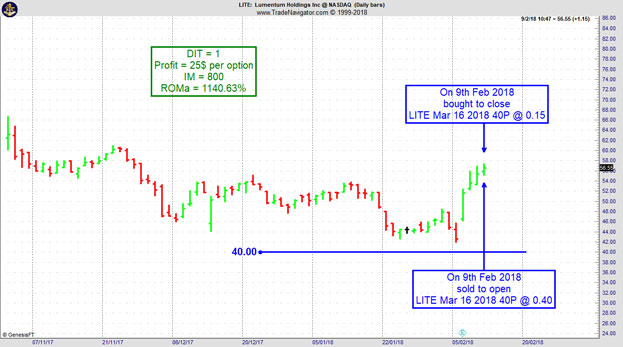
The recent wild jumps in implied volatility can be a disaster for price insurance sellers, or an opportunity for quick profits. On 8th February 2018 we gave our Instant Income Guaranteed subscribers the following trade on Lumentum Holdings Inc (LITE). Price insurance could be sold as follows (not everybody was filled on this one):
On 9th February 2018, we sold to open LITE Mar 16 2018 40P @ 0.40$ (on a GTC order), with 37 days until expiration and our short strike about 28% below price action, making the trade quite safe.
About 10 minutes later, we bought to close LITE Mar 16 2018 40P @ 0.15$, for ultraz quick premium compounding.
Profit: 25$ per option
Margin: 800$
Return on Margin annualized: 1140.63%
Philippe
Receive daily trade recommendations - we do the research for you.
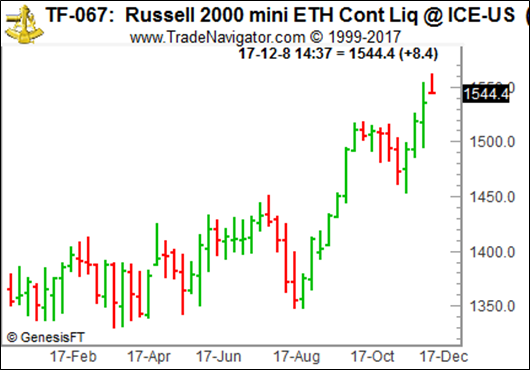
In this video Marco has a look at the "Outside Bars" pattern as an entry signal. He shows you how if it works as an entry signal in the Russell 2000 Mini Future and how to evaluate entry signals in general by using a systematic approach.
Happy Trading!
Marco
Feel free to email Marco Mayer with any questions, This email address is being protected from spambots. You need JavaScript enabled to view it..
To view previous published Chart Scan newsletters, please log in or click on "Join Us,"
shown above, to subscribe to our free "Members Only" section.
A WEALTH OF INFORMATION & EDUCATION:
Joe Ross-Trading Educators' popular free Chart Scan Newsletter has been published since 2004.
Note: Unless otherwise noted, all charts used in Chart Scan commentary were created
by using Genesis Financial Technologies' Trade Navigator (with permission).
Legal Notice and Copyright 2018 Disclaimer - Published by Trading Educators, Inc.
Chart Scan is a complimentary educational newsletter.
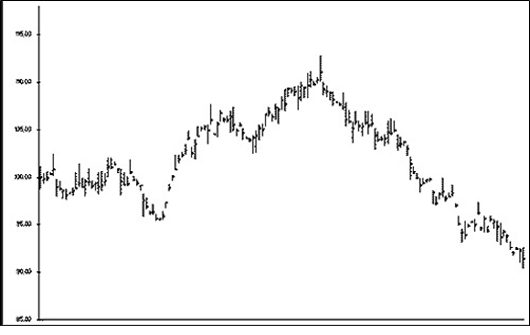
I won't bore you with this subject any more after this next chart. But 2 weeks ago I wrote "I am often challenged with regard to the Law of Charts. 'How do you know it's a law?' The answer is that TLOC can be seen on any chart that makes highs and lows."
Now I will add to that the fact that, if you chart a series so as to get a sequence of recurring events, you can add that series of events to represent a trend. After all, doesn't a series of higher highs and higher lows constitute a trend?
As I have often stated, the impetus for TLOC is the human action and reaction to the movement of prices. However, it is possible to see TLOC in action due to a variety of causes. The chart below shows a series of coin flips.
People have a natural affinity to follow others. It can be very adaptive at times. If you see someone slip on an icy sidewalk, for example, it would be wise of you to start walking slowly and carefully to protect yourself from getting hurt. People are so attuned to others that they mimic their behaviors without knowing it. Psychologists call this phenomenon contagious behavior. Contagious behavior is the unconscious transmission of actions or emotions from one person to another. When trading the markets, we often fall prey to contagious behavior when we react to opinion—opinion of anyone, including our own.
There are both social and biological bases for contagious behavior. It's a pervasive phenomenon. From a social standpoint, researchers have shown that people react automatically to well learned scripts. When we see a set of behaviors happen over and over, we react to this pattern without thinking. Consider a common example while trading the markets: An analyst talks up a stock spurring a few online traders to buy. Next, a few other traders see the initial buying spree, and decide to follow. Soon many people are following the crowd. Research has shown that people can follow the crowd without knowing it. Negative emotions, such as fear and panic, are especially contagious. When people are studied in groups in a laboratory setting, they tend to "catch" unpleasant emotions from others more than pleasant emotions. When you see the masses sell, for example, you are naturally bound to become afraid yourself and start selling. Your natural human affinity to follow others can work against you.
There are also biological reasons that we follow each other. Humans are built to follow others. Research studies have shown that neurons in the brain fire merely by watching someone perform an action. We laugh when others laugh, and we run from a threat when we see others reacting in a panic. Humans are biological, social beings and these social and biological bases of contagious behavior may difficult to beat at times.
Contagious behavior may be difficult to fight, but you must find a way to break away from the crowd. Winning traders often need to go their own way. It is often useful to be a rebel, when necessary. The winning trader steps back from the crowd and tries to identify the optimal point to buy and sell. It is necessary to build up immunity to contagious market behavior. How can you do it? First, anticipate the strong tendency to follow the crowd. If you are aware of the powerful influence of the crowd, you can go against them when you need to. Second, know your personality. Some people are more prone to "catch" contagious behavior than others. Emotions are especially catchy. If you are easily discouraged, you may be prone to catch other people's panic and fear. Third, try not to pay attention to the crowd. Obviously, you can't follow the crowd if you are oblivious to what they are doing. If you make a conscious attempt to try to look at circumstances from an objective view, you will develop the habit of seeing things that way.
It may be difficult to build up immunity to contagious market behavior, but if you increase your awareness of the potential problem, you learn to look inward and go your own way. The more you can think independently, the more you will be inoculated from the contagious opinions and emotions of the crowd.
Philippe Gautier: Administration and New Developments
Developer: Joe Ross
TRADE WITH NO LOSSES
Here's our latest example!
CNDT Trade
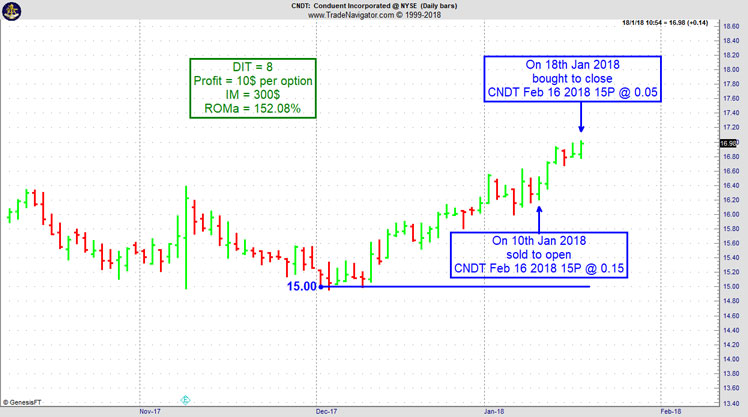
On 5th January 2018 we gave our Instant Income Guaranteed subscribers the following trade on Conduent Incorporated (CNDT). Price insurance could be sold as follows:
On 10th January 2018, we sold to open CNDT Feb 16 2018 15P @ 0.15$ (on a GTC order), with 36 days until expiration and our short strike about 8% below price action
On 18th January 2018, we bought to close CNDT Feb 16 2018 15P @ 0.05$, after 8 days in the trade for quick premium compounding
Profit: 10$ per option
Margin: 300$
Return on Margin annualized: 152.08%
Philippe
Receive daily trade recommendations - we do the research for you.
While we all love trading, we also know that trading can be really tough. Let's face it. Often you just keep on doing your "job" as a trader every day without getting anything but blows from the market.
You don’t get paid even though you're doing a great job. That’s tough and because it’s tough most traders have a difficult time dealing with this. It very quickly can lead you into questioning your whole strategy or worse your ability as a trader. I’ve been trading for almost 20 years now and guess what these periods are still tough times for me. I always thought that one day I'd be able to just trade though these without any negative emotions etc but now I'm quite sure that’s simply a fantasy! As long as money means anything to you, you’ll feel bad when you lose it. And that's actually not really a bad thing. Best you can do is learn how to deal with this and that’s where I happily got quite good in.
Anyway if you have an edge in the market and you keep on going despite taking hits your payday is gonna come. And oh boy, yesterday it did show up for Ambush traders!
Here’s the result for each of the markets for one contract (without commissions and slippage). Not bad for a day trade I’d say!
Looking at the biggest single day gains of the Ambush All Stars Portfolio for Large Accounts which includes many of the ambush markets we can see that it’s been one of the best days ever, actually there have only be 4 other days with even higher results.
Of course this is an outlier and also related to the jump in volatility we’ve seen in many of the markets. But it was also a much needed performance boost as Ambush gave back some of 2017th profits during the last quarter of the year and also didn’t have a great start into 2018. Things finally look much better again now with Ambush being in positive territory for 2018 and having recovered almost 2/3 of the drawdown.
To sum it up: For Ambush Traders, Payday arrived!
Want to become an Ambush Trader too?
Then simply sign up to Ambush Signals. It does all the work for you, allows you to customize what markets you want to see and has a position sizing tool implemented to automatically adjust the positions to your risk preferences.
Each day around 6:30 PM NY Time (yes, it's ready much earlier now than before) the Signals are available for you on the Dashboard. You can then place your orders and literally walk away until the markets close! Can you imagine a more comfortable way to day trade?
Now if you’d prefer to rather generate the signals on your own and want to know the exact trading rules of Ambush, you want to get the Ambush eBook.
Happy Trading!
Marco
Feel free to email Marco Mayer with any questions, This email address is being protected from spambots. You need JavaScript enabled to view it..
Marco Mayer has been nominated at FxStreet for the "Forex Best Awards 2018" in the category "Best Educational Article" for his article "5 Tips to improve your day trading" (link to http://www.tradingeducators.com/blog-page/5-tips-to-improve-your-day-trading). If you also liked the article which of course was published on Chart Scan first and have a minute, help Marco win the Award by voting for his article at https://goo.gl/forms/Z3K8LIjtr6RYz0z62. You'll find Marco's article in the category "Best Educational Article" and can simply select "Don't know" on all of the other categories.
Trading Example - Coffee trading at the ICE Exchange
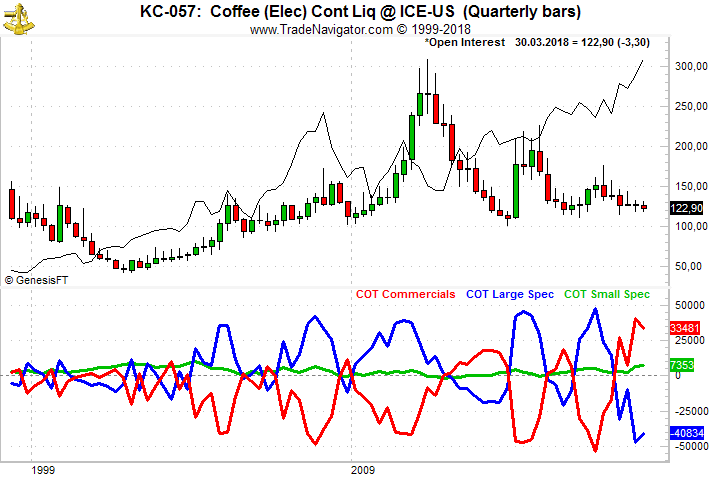
This week, we are looking at Coffee trading at the ICE Exchange.
The main motivation for this trade is the very low Implied Volatility and the extreme net long position of the Commercials. Unfortunately, the position of the Commercials cannot be used to time a trade short term. Most of the time, the Commercials can be found on the right side of the market long term. How can you approach such a market and what strategy can be used? I am usually an option seller, but under these conditions, I would look into buying an options spread using May options. Look for a spread that gives you at least 2:1 profit/loss ratio and use strikes close to the market.
Andy Jordan is the editor for Traders Notebook which shows you Futures Trading Strategies in Spreads, Options, and Swing Trades. Learn step-by-step how to trade successfully.
To view previous published Chart Scan newsletters, please log in or click on "Join Us,"
shown above, to subscribe to our free "Members Only" section.
A WEALTH OF INFORMATION & EDUCATION:
Joe Ross-Trading Educators' popular free Chart Scan Newsletter has been published since 2004.
Note: Unless otherwise noted, all charts used in Chart Scan commentary were created
by using Genesis Financial Technologies' Trade Navigator (with permission).
Legal Notice and Copyright 2018 Disclaimer - Published by Trading Educators, Inc.
Chart Scan is a complimentary educational newsletter.
Marco has been nominated at FxStreet for the "Forex Best Awards 2018" in the category "Best Educational Article" for his article "5 Tips to improve your day trading" (link to http://www.tradingeducators.com/blog-page/5-tips-to-improve-your-day-trading). If you also liked the article which of course was published on Chart Scan first and have a minute, help Marco win the Award by voting for his article at https://goo.gl/forms/Z3K8LIjtr6RYz0z62. You'll find Marco's article in the category "Best Educational Article" and can simply select "Don't know" on all of the other categories.
Kind regards
Marco
Feel free to email Marco Mayer with any questions, This email address is being protected from spambots. You need JavaScript enabled to view it..
You must be disciplined in following the plan of your trade religiously. Once you have closed your position, you should...read more.
Andy Jordan is the editor for Traders Notebook which shows you Futures Trading Strategies in Spreads, Options, and Swing Trades. Learn step-by-step how to trade successfully.
If you want to see how to make a contrarian long-term trade, you might consider looking at the positions on the COT report.
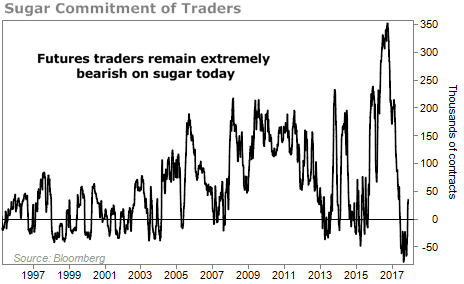
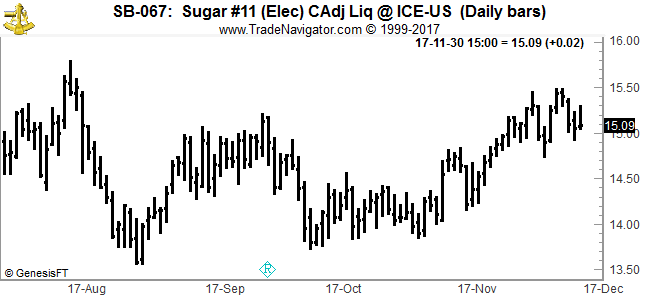
As of November 2017, sugar was really down, and way oversold, but had begun to rally. Sugar prices were down nearly 60% from 2010 and 29% from the previous year. The Commitment of Traders (COT) report revealed that traders were more negative on sugar than ever before.
COT details the real-money bets of futures traders. It tells us whether traders are excited about or disinterested in a commodity market.
That means it's a useful contrarian tool... When traders all agree on an outcome, it's a good idea to bet against them.
And futures traders have become extremely bearish on sugar in recent months. Take a look...
The COT report hit its most negative level ever in August, -77,495. It has rebounded slightly to 34,270 since then.
The negativity is a good thing for traders looking for big opportunity, based on history.
You want to be in sugar when the COT is this negative. Historically, sugar prices have soared when the COT fell below and then rose back above -35,000. Being in sugar when it is this negative has led to dramatically high returns. As I write this, sugar prices have rebounded recently. There are a number of ways you can trade this, here are a few suggestions.
Via the stock market:
Long the iPath Sugar Subindex Total Return ETN (SGG)
Some people live in a world of delusion and fantasy. They see what they want to see and ignore what they don't want to see. Traders are especially prone to this ailment. When your money is on the line, you are consumed with avoiding loss. Trading is a competitive business where few make it in the long term. This fact always lurks in the back of your mind, putting added pressure on you. In the back of your mind, you wonder, "How am I going to make it?" Sure, you know that you must make it and that allowing pessimism to take hold will do nothing more than throw you off track, but the possibility of failure is always there, working behind the scenes to thwart your efforts. With all this psychological pressure it's hard to stay objective. There's a powerful need to see what you want to see.
staying objective is difficult It's important to distinguish between the data and your interpretations of the data. View as neutral both the events and your inclination to impose your interpretations on them. Enter the market without expectations, surrendering to it rather than struggling with it for personal gain.
How can you stay objective? The first thing you must do is trade with money you can afford to lose and manage your risk. If your entire financial future is on the line on a single trade, you will be consumed with anxiety, self-doubt, and frustration. But if you risk relatively little on a single trade, you'll know deep down that you can live with the negative consequences should the trade be a loser. It's useful to follow the old trading adage, "Risk so little capital on a trade that you ask yourself, 'Why am I even bothering to put on this trade?”
The second thing you must do to stay objective is to take your ego out of the trade. You cannot control the markets, so why put your ego on the line with your money? Don't make winning or losing a personal issue? Why put your ego on the line with each trade? Why gloat when you are lucky enough to have the odds work in your favor and sulk when the odds go against you? It's not personal in the end. There's little you can do but stay calm, try your best, and accept where the markets take you. Ironically, if you can identify and control what you can (such as risk management and a sound trading strategy), and accept what you cannot (the outcome of a trade), you will feel calm and be able to trade in a peak performance mindset. And the calmer you feel, the more open you will be to seeing the markets as they are, rather than what you want them to be.
Philippe Gautier: Administration and New Developments
Developer: Joe Ross
TRADE WITH NO LOSSES
Here's our latest example!
GDX Trade
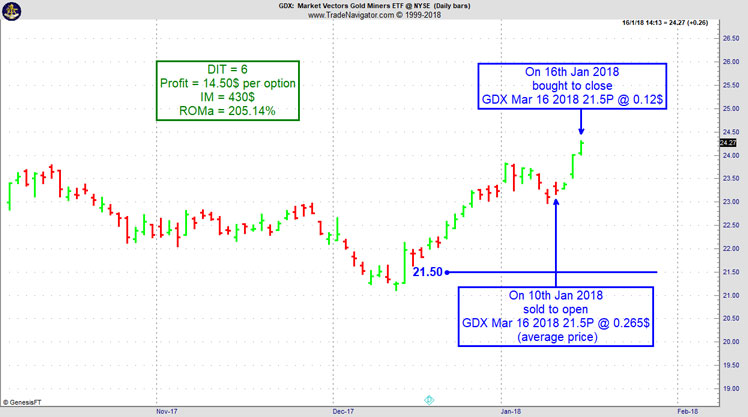
On 9th January 2018 we gave our Instant Income Guaranteed subscribers the following trade on Market Vectors Gold Miners ETF (GDX). Price insurance could be sold as follows:
On 10th January 2018, we sold to open GDX Mar 16 2018 21.5P @ 0.265$ (average price), with 66 days until expiration and our short strike about 7% below price action.
On 16th January 2018, we bought to close GDX Mar 16 2018 21.5P @ 0.12$, after 6 days in the trade for quick premium compounding.
Profit: 14.50$ per option
Margin: 430$
Return on Margin annualized: 205.14%
Philippe
Receive daily trade recommendations - we do the research for you.
To view previous published Chart Scan newsletters, please log in or click on "Join Us,"
shown above, to subscribe to our free "Members Only" section.
A WEALTH OF INFORMATION & EDUCATION:
Joe Ross-Trading Educators' popular free Chart Scan Newsletter has been published since 2004.
Note: Unless otherwise noted, all charts used in Chart Scan commentary were created
by using Genesis Financial Technologies' Trade Navigator (with permission).
Legal Notice and Copyright 2018 Disclaimer - Published by Trading Educators, Inc.
Chart Scan is a complimentary educational newsletter.
"Teach our students the truth in trading - teach them how to trade,"
and
"Give them a way to earn while they learn - realizing that it takes time to develop a successful trader."
Derivative transactions, including futures, are complex and carry a high degree of risk. They are intended for sophisticated investors and are not suitable for everyone.
There are numerous other factors related to the markets in general or to the implementation of any specific trading program which cannot be
fully accounted for in the preparation of hypothetical performance results, and all of which can adversely affect actual trading results.
For more information, see the Risk Disclosure Statement for Futures and Options.