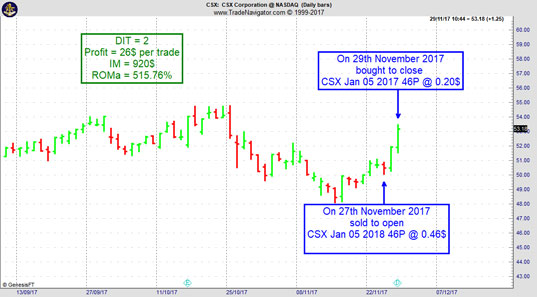
Trades in Stock Options. Receive daily trade recommendations. Can you imagine discovering a way to trade that promises instant income? If you think such a method is impossible, think again. It is definitely achievable, and everything you need to know is available online for one low price that includes special three-part online webinars.
Ambush is a time-proven mean-reversion day trading System focused on a variety of Futures markets around the globe. With Ambush Signals you can now easily follow the Ambush System on a subscription basis for educational purposes.
If you didn't fail early in your trading business, then you have probably been around long enough to realize that many of the problems you encounter as a trader are those that derive from your own individuality. Such problems are common among traders and, in fact, common among all human beings. Seeking spiritual help from a power much greater than your own is the area I address in the "Spiritual Side of Trading".
When prices on a daily chart remain contained, traders can become complacent, and vulnerable to emotional breakouts.
When prices trade in a range for an extended time, the market begins to depend on those prices. Traders make assumptions and plans about such markets, and tend to trade accordingly. Sometimes those plans can extend well into the future, in turn generating other plans contingent on a certain level of continuing price containment.
But what if prices break out of that range? Complacency gives way first to surprise, then to denial, sometimes to desperation. The latter can eventually induce panicky behavior, driving prices even further.
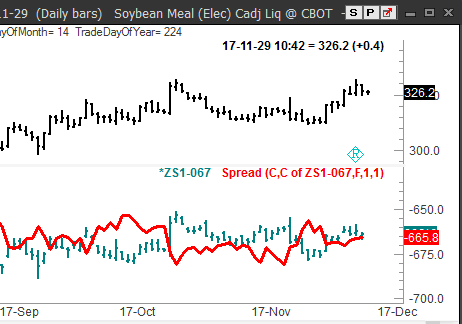
The chart below shows a currency spread (line chart overlay) long Soymeal (upper bar chart) and short Soy beans (lower bar chart). As you can see, each of the two markets is in a trading range, and so is the spread.
The human mind is capable of extreme optimism. We have a strong need to win. This need can be so strong that everything looks rosy. For example, you may look backward at old charts and think, “It’s easy to see winning patterns.” Behavioral economists call this optimism, ‘hindsight bias.’ When we know how a stock price moved in the past, we think it all seemed inevitable when we look backward. For example, if you looked at a rise in stock price over the past few years, you may think in hindsight that it was inevitable. People have been positive about stocks.
Profits have been good, and of course, stock prices went up. You may have also seen the decline at times as being inevitable as well. If too many investors buy, prices were bound to go down a little eventually. The patterns all make sense in hindsight. The problem, however, is that people have difficulty seeing these patterns in foresight.
People are, indeed, too optimistic. Our thinking can be biased and self-serving. We can falsely believe that good quality setups are easy to spot, and we can convince ourselves that success is assured. But our expectations don’t always match reality.
The mind is prone to bias and unrealistic optimism. That’s why it is crucial to cultivate a healthy sense of skepticism. Skepticism isn’t the same thing as pessimism. A pessimist falsely distorts reality to the point that he or she believes that even a reasonable plan is doomed. A skeptic is optimistic yet is also realistic. No trading plan is foolproof. You may look back at old charts and see a foolproof way to make money. But history only repeats itself when it does (and sometimes it does not), and the mind can make it all look so obvious in hindsight. The markets don’t always cooperate with you. The winning trader is the person who questions a trading plan before executing it. He or she tries to anticipate what could go wrong, and thinks of ways to work around these potential setbacks. Being a healthy skeptic can be difficult at times, but the cautious optimist usually ends up making the most profits in the end.
Philippe Gautier: Administration and New Developments
Developer: Joe Ross
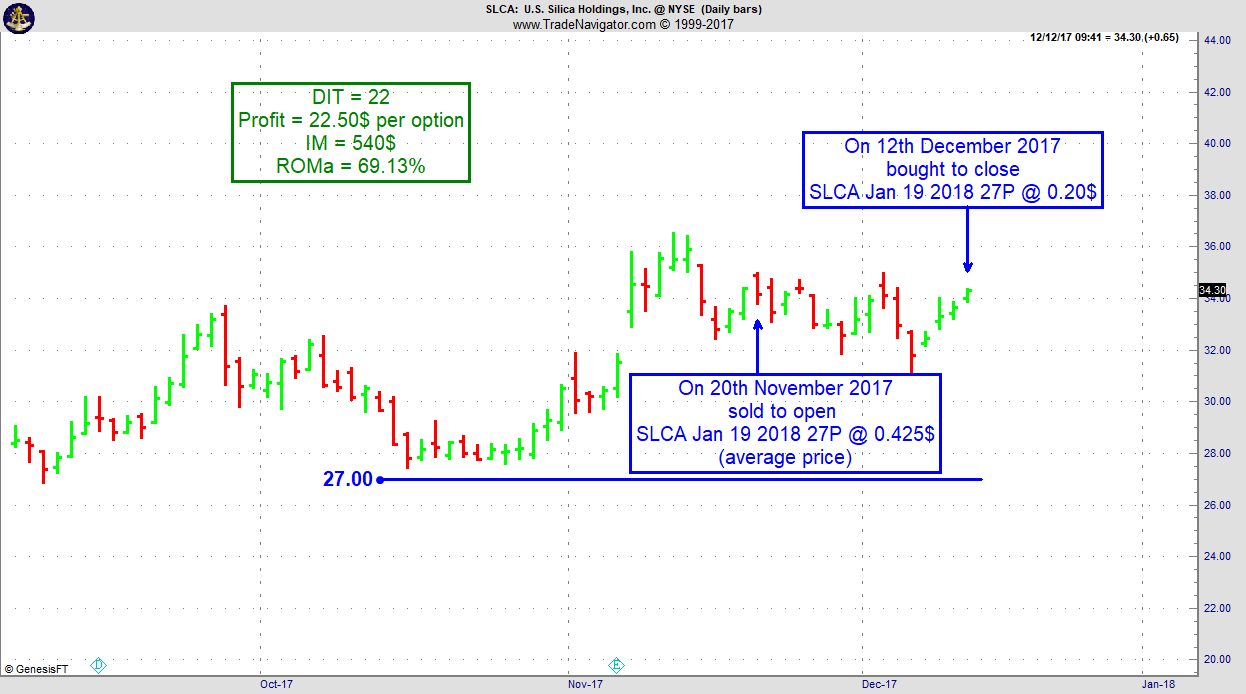
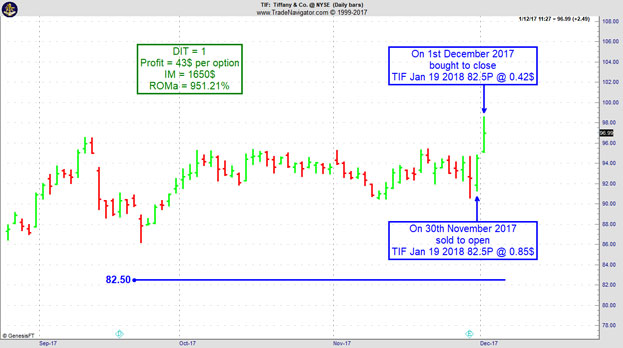
On 19th November 2017 we gave our IIG subscribers the following trade on U.S. Silica Holdings Inc (SLCA). We sold price insurance as follows:
On 20th November 2017, we sold to open SCLA Jan 19 2018 27P @ 0.425$ (average price), with 59 days until expiration and our short strike about 21% below price action.
On 12th December 2017, we bought to close SLCA Jan 19 2018 27P @ 0.20$, after 22 days in the trade
Profit: 22.50$ per option
Margin: 540$
Return on Margin annualized: 69.13%
Philippe
Receive daily trade recommendations - we do the research for you!
Learn all you need to know about our new Ambush Signals service during this presentation by Marco Mayer. What is the Ambush System, what's the idea behind it and how does Ambush Signals make trading Ambush so much easier!
Happy Trading!
Marco
Feel free to email Marco Mayer with any questions, This email address is being protected from spambots. You need JavaScript enabled to view it..
To view previous published Chart Scan newsletters, please log in or click on "Join Us,"
shown above, to subscribe to our free "Members Only" section.
A WEALTH OF INFORMATION & EDUCATION:
Joe Ross-Trading Educators' popular free Chart Scan Newsletter has been published since 2004.
Note: Unless otherwise noted, all charts used in Chart Scan commentary were created
by using Genesis Financial Technologies' Trade Navigator (with permission).
Legal Notice and Copyright 2017 Disclaimer - Published by Trading Educators, Inc.
Chart Scan is a complimentary educational newsletter.
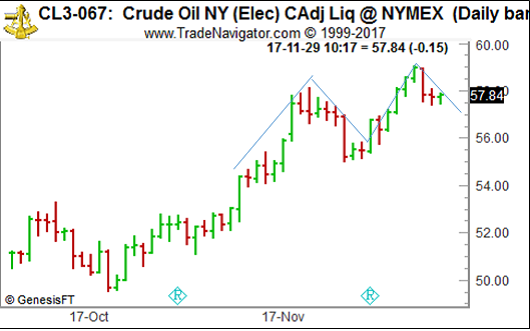
This is a question I am being asked quite often these days. The answer is that I honestly don't know. But from a purely technical analysis point of view, it is. On the daily chart, crude seems to be forming an m-shaped top. Some old-timers would even label it as a left shoulder and a head that could end up with a heads and shoulders top. The neckline seems to be right around 57.00. Of course, all of this is in the eye of the beholder.
What do we see on a daily chart basis via The Law of Charts? Prices are definitely still trending, making higher highs and higher lows. I've marked the /\/\ such as it is, so you can see it as well. So, from the point of view of chart analysis, we appear to have the probability of a top in crude oil, but in actuality prices are still trending.
Will the top form as a sideways price action known as distribution? Again, who knows? I don't even pretend to know. There are too many other factors involved. Crude oil is now a political football, as well as an economic enigma.
As far as the weekly chart is concerned, crude is still in an uptrend, having not broken any uptrend lines.
Can crude oil go much higher? Absolutely! Especially with the uneducated move the U.S. Congress is likely to make if they decide to regulate trading in crude oil.
I do not believe that this is a time to make any kind of definitive decision to short crude oil, but if you can't stand the suspense, maybe you could buy an at-the-money option straddle. Then if/when crude makes up its mind, you simply drop the losing side.
If you're like most traders, you expect to win. You put your time and energy into finding high probability setups, and after all the studying, searching, and theorizing, when you think you have come upon a good idea, you want it to work. Unfortunately, the markets don't always cooperate. You have to go where the markets take you. In the end the markets are always right. How do you react when things don't go your way? Do you feel upset? Are you angry? Do you want to get even?
When things don't go your way, it's very human and understandable to feel frustrated and angry. People experience anger when they feel that they have been unfairly wronged. It's easy to get angry while trading the markets. You expect to win. You were counting on winning. And when the markets don't cooperate, you feel a little hurt. Your ego is dinged and you are angry with someone: fate, yourself, imaginary institutional traders who are out to get you. The possibilities are endless. If you want to find someone to be angry with, you can find it, but it isn't very productive.
Anger can be a dangerous emotion when trading the markets. When you feel angry, you are ready to put up a fight. You have a powerful inclination to focus all of your energy and resources on fighting, seeking revenge, and looking for any sign of provocation. It's hard to think clearly when you are angry. Sound decision-making requires you to remain calm, focused, and flexible. There's no reason to be angry at the markets. Here's how you can be less angry at the markets.
First, don't personify the markets. Anger is an interpersonal emotion. We are usually angry with someone because we believe that he or she has purposely tried to harm us. The markets may consist of people making trades, but it doesn't make sense to make up imaginary relationships with the markets. There is nothing that is personal going on. You are merely making it personal, and taking setbacks personally, as if someone were out to wrong you. The people participating in the markets may engage in actions that thwart your goals, but their actions are not directed toward you personally. It is best to look at the markets as an abstract impersonal entity. Pretend you are playing a videogame. The more impersonal you can make trading, the better you will feel, and the more profits you'll realize.
Second, don't expect anything to go your way. Practice radical acceptance. Whatever happens, happens, and there is little you could have done to change things. (All you can do is limit your risk.) Anger is felt when our expectations have been shattered. One expects to profit from a trade, and when the profits are not realized, he or she may become angry, seek revenge, and want to get even. However, it isn't useful to have high expectations in the markets. Don't depend on the markets to fulfill your goals or meet your expectations. Assume that anything can happen. Indeed, in dealing with the markets, it's almost a given that you will lose money, so it is not useful to expect to make money on every trade. Just accept what you can get. Using this thinking strategy will make you feel calm.
The more you can stay calm while trading the markets, the more profitably you will be. Don't get frustrated, angry or upset. Take all setbacks in stride and enjoy the process of trading. You'll find you'll be calmer, focused, and more profitable.
This week, we're looking at 1000*CLN18 – 420*HON18: long July 2018 Crude Oil and short July 2018 Heating Oil (NYMEX on Globex).
Today we consider a Cotton calender spread: long July 2018 Crude Oil and short July 2018 Heating Oil (NYMEX on Globex). After being in a long down-trend, it looks like the spread might want to turn around to the up-side following its seasonal pattern. While the 15 year seasonal pattern shows an up-trend between October and January, the 5 year seasonal pattern shows the start of the seasonal up-move at the beginning of December. Energy spreads using two different markets (so called inter-market spreads) are usually very volatile and therefore need a wide stop. A risk of at least $1,500/spread seems to be appropriate for this spread. Please Note: because Crude Oil and Heating Oil have a different value per price tick we need to multiply the buy side by 1,000 and the sell side by 420 to plot the correct equity chart. The spread is 1:1.
Learn how we manage this trade and how to get detailed trading instructions every day!
One of the best performing Ambush markets this year has been the 5-Year T-Notes Future (ZF). Actually its performance just hit new all-time-highs!
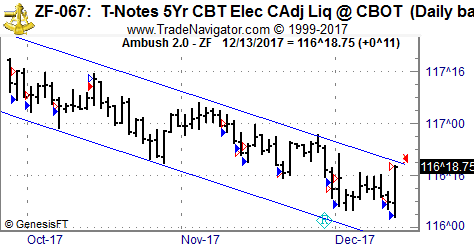
The interesting part here is that this market actually has been trending most of the time. While it’s been in an uptrend during the first part of the year, it’s now been trending lower in an almost perfect channel:
Now as you probably know, Ambush is a mean-reversion method so how is this possible? The answer is that Ambush is hitting that sweet spot of getting into trades usually towards the end of an up- or downswing in the markets and stays in only for a single day.
At the same time this market has been trending lower rather slowly. This creates a very nice environment for Ambush to trade in. Meaning ZF and Ambush are in perfect sync and having a really nice dance!
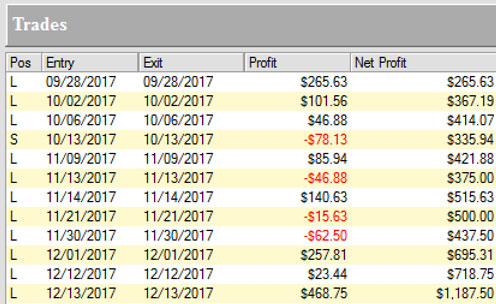
Here’s the trade details of all trades visible on the chart and as you can see ZF is quite a small contract you can trade nicely even with a small account:
Become an Ambush Trader today!
Simply sign up to Ambush Signals. It does all the work for you, allows you to customize what markets you want to see and has a position sizing tool implemented to automatically adjust the positions to your risk preferences.
Each day around 6:30 PM NY Time (yes, it's ready much earlier now than before) the Signals are available for you on the Dashboard. You can then place your orders and literally walk away until the markets close! Can you imagine a more comfortable way to day trade?
Ambush eBook
Now if you’d prefer to rather generate the signals on your own and want to know the exact trading rules of Ambush, you want to get the Ambush eBook. Here’s a hint: we’ve already significantly raised the price of eBook last year and probably we’ll do the same soon in 2018. So if you’re interested in buying the eBook, go for it now.
Happy Trading!
Marco
Feel free to email Marco Mayer with any questions, This email address is being protected from spambots. You need JavaScript enabled to view it..
To view previous published Chart Scan newsletters, please log in or click on "Join Us,"
shown above, to subscribe to our free "Members Only" section.
A WEALTH OF INFORMATION & EDUCATION:
Joe Ross-Trading Educators' popular free Chart Scan Newsletter has been published since 2004.
Note: Unless otherwise noted, all charts used in Chart Scan commentary were created
by using Genesis Financial Technologies' Trade Navigator (with permission).
Legal Notice and Copyright 2017 Disclaimer - Published by Trading Educators, Inc.
Chart Scan is a complimentary educational newsletter.
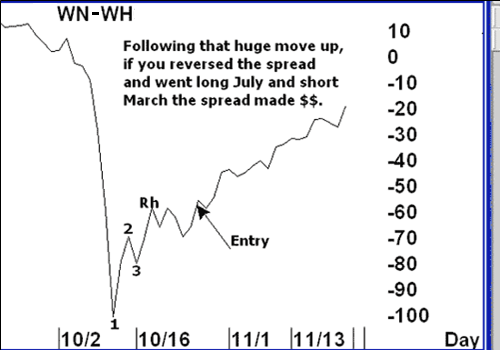
I think many traders should take the time to learn a lot about spread trading. Sometimes I wonder why more people are not trading spreads. There are incredible advantages available for trading them: no stop running, low margins, most efficient use of your capital, more and steeper trends, seasonality, mathematical correlation — the list goes on and on.
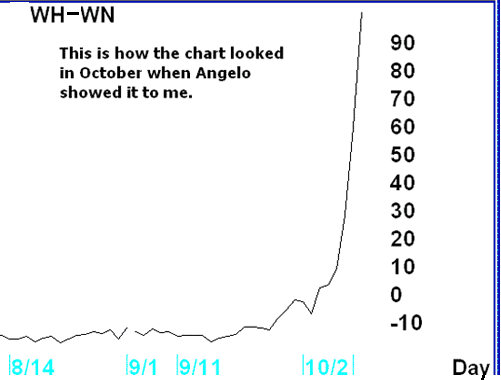
I love the spread shown to me by my friend Angelo when we were together in October. Take a look!
Spread trading is quietly kept secret. Why? Because spread trading completely eliminates stop running. Do you think the insiders want you to know that? What would they do if they didn't have your stops to run?. Follow this link to find out more!
IS IT TRUE THAT MARKETS TREND ONLY 15% OF THE TIME?
The statement that charts trend only 15% of the time is true only in the most general sense. There is almost always something trending somewhere, in some time frame. Trending means the market is moving from a definable top to a definable bottom, or from a bottom to a top. If traders cannot define the trend on one chart, they should look at another time period chart for the same stock or commodity, where the trend is more evident. You might even consider using tick charts, where each bar represents a certain number of ticks (or pips forex). There are many instances where a tick chart can be set to a number of ticks (pips) that will present a trending market in a market that presents as sideways using time charts. However, be aware that with tick charts you never know when you are going to get a new bar, and that the bars can suddenly change shape.
Believing markets trend only 15% of the time, popularly espoused by market technicians, is in one sense foolish. Long accumulation phases on daily charts, experienced by markets like sugar and silver, may not readily expose their trends until weekly and monthly charts are examined. Once the accumulation phase is identified, traders must wait for valid breakouts to occur before entry. The Latin roots to the word accumulate means to "add to the pile." A cumulus cloud is a pile of water vapor. There are three common congestion phases, and accumulation at the market bottom is one of them. The up move and down move have congestion phases as the market digests previous gains and losses, then usually continues the trend prior to the congestion. Congestion occurrence in the distribution phase, at a market top, is opposite the low range accumulation congestion phase. Congestion phases usually have low volatility and well defined five- to ten-day high and low price ranges, the opposite of the volatile distribution phase at market tops.
You can find seasonality in all markets but I personally think there is a big difference in “reliability” or “strength” of seasonality in the markets. I personally think seasonality is strongest in the commodity markets. In all markets where you have a physical product and a production cycle during the year. Because the production cycle is always the same you get typical seasonal behaviors in these markets. Other markets, like the indices, also show a seasonal pattern but I think it is not as strong as in the commodity markets. Anyway, seasonality is only one criterion besides others and I would never recommend any entry just based on statistics. You have to look at the current chart of the current spread to see what is going on. That’s what we have to trade!
"Buy low, sell high" is one of the most popular memes in the investment and trading world. And obviously, it does make sense, who wouldn't like to buy low and sell high all the time? I found this to be quite a helpful advice to invest in stocks for example. Wait for a crash, buy it and sell again when prices are back to old highs.
Of course, the problem often is to figure out what's actually a low price and what's a high price. You can also buy high and sell higher to make a profit, which is how trend following works.
So what's the real deal here? I think the actual question to ask is "who's going to buy after me?" or "who's next in line?". Will there be enough traders willing to buy after you did at a higher price? Or if you're short the other way around, will there be sellers standing in line to sell after you did or not?
Think about it. To make a profit that's exactly what needs to happen. If you buy at $100, the only way to make a profit is if there are buyers willing to buy at higher prices. If they don't bid it up after you and you find someone to sell to at a higher price, you won't make a profit. Simple fact most traders are not really aware of.
Obviously, there's always someone who's gonna be the last in line. Someone is going to buy the high of the day/week/month/year/all-time. In poker, there's the popular saying that if you don't know who the patsy is in the round after 30 minutes, it's probably you. That same idea applies to trading. If you don't know why other traders are probably willing to buy at a higher price after you during the day, you might be the last one in the order book to bid at such a high price for today.
Because of that, it's always helpful to ask yourself "Who's gonna buy/sell after me and why?". If you can't answer that question it might be best to skip the trade!
Happy Trading!
Marco
Feel free to email Marco Mayer with any questions, This email address is being protected from spambots. You need JavaScript enabled to view it..
To view previous published Chart Scan newsletters, please log in or click on "Join Us,"
shown above, to subscribe to our free "Members Only" section.
A WEALTH OF INFORMATION & EDUCATION:
Joe Ross-Trading Educators' popular free Chart Scan Newsletter has been published since 2004.
Note: Unless otherwise noted, all charts used in Chart Scan commentary were created
by using Genesis Financial Technologies' Trade Navigator (with permission).
Legal Notice and Copyright 2017 Disclaimer - Published by Trading Educators, Inc.
Chart Scan is a complimentary educational newsletter.
This week we are going to see how to use the Law of Charts to stay out of a bad trade. Part and parcel with the Law of Charts is one of the implementations of the “Law” using the Traders Trick Entry (TTE).
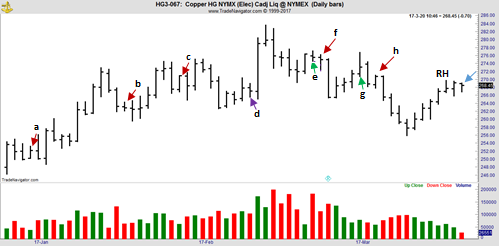
I want to call your attention to the New York, Comex Copper futures. Look first at the blue arrow which points to Friday’s price bar. Notice that on Monday there is a TTE to go long 1 tick above Friday’s high for entry ahead of a violation of the Ross hook (RH), which is the high of the recent leg up.
The question I propose to you is this: Should you consider taking that TTE? In order to determine an answer, let’s look at a bit of history. Beginning from left to right using the red and purple arrows, let’s see how the TTE fared previously in this particular market.
There was a TTE to go long ahead of a Rh at “a”. Had you gotten long you didn’t get very far and may very well have been stopped out, as prices ended up at the low of the day. There was a TTE to go long at “b”. Following that trade there was a similar move against you with prices moving lower before rallying a bit at the close. The same thing happened at points “c.” and at “d” the TTE to go short ended up in disaster. The TTEs at “f” and “h” were not filled, but the TTEs at “e” and “g” turned out to be good trades. However, the TTE to go short at “e” is the only one that took prices out of the trading range.
An additional consideration is that there is very little room for making a profit between the high of the current TTE (blue arrow) and the point of the RH. What else can we know about trading in the copper market?
Daily volume has been falling and Friday’s volume was very weak. Weak volume indicates poor liquidity. It takes many buyers hitting the offer and many sellers hitting the bid to create a liquid market. Absent real liquidity, all you have is the chance for a few insiders to run the stops. That is what we saw on Friday and at the Traders Tricks were not so good.
What else do we know? Copper is a somewhat thinly traded and notoriously crooked market. If you don’t know about things like that, you have no business trading.
Avoid illiquid markets. Be sure to check volume. How much is it on average and is it steady day after day. And perhaps the greatest lesson of all should you happen to leap before you look--never, ever trade on hope or stay in a trade based on hope. If you are wrong, get out. If you don't have the discipline to do that, you shouldn't be trading.
Joe Ross has put together a special recorded online webinar: "The Traders Trick – Advanced Concepts." In it you will learn how to use the Traders Trick Entry (TTE) as one of your tools, very likely your greatest trading tool and setup. This webinar will last about 1 hour 52 minutes. Follow this link to find out more and watch it today!
Is learning the trading business like learning any other business?
The importance of how you learn the business of trading cannot be minimized because of the factors that determine your success or failure. Learning the business of trading is basically no different from learning any other business. Winning means learning major guidelines and concepts that you repeat so often in your own behavior that they become good habits. These good habits then become automatic behavior patterns, which are formed as brain pathways by the rewards you get for trading well and the punishment you receive from trading poorly. When you associate yourself with other traders, try to associate with those who are building their personal net worth, not just talking about it. True success is silent. Try not to do something just because everyone else is doing it. Successful traders are rare. If the crowd is doing it, watch out!
If you'd like to turn all your hours of effort in studying the markets into profitable trading, to rid yourself of the mental gridlock that often plagues traders, and to truly become an intuitive trader, then you'll want to read this very important book to make money trading - Trading Is a Business.
Philippe Gautier: Administration and New Developments
Developer: Joe Ross
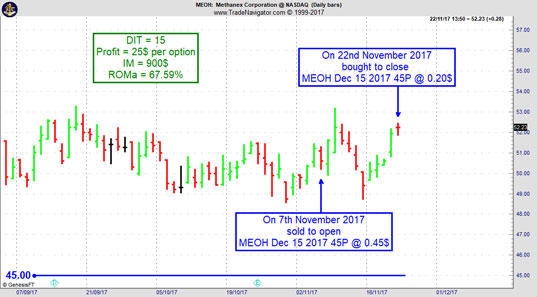
On 7th November 2017 we gave our Instant Income Guaranteed subscribers the following trade on Methanex Corporation (MEOH). We sold price insurance as follows:
On 7th November 2017, we sold to open MEOH Dec 15 2017 45P @ 0.45$, with 38 days until expiration and our short strike about 12% below price action.
On 22d November 2017, we bought to close MEOH Dec 15 2017 45P @ 0.20$, after 15 days in the trade for quick premium compounding.
Profit: 25$ per option
Margin: 900$
Return on Margin annualized: 67.59%
Philippe
Receive daily trade recommendations - we do the research for you!
This week, we're looking at CLN18 – HON18: long July 2018 Crude Oil and short July 2018 Heating Oil (NYMEX on Globex).
Today we consider an inter-market spread in the energies: long July 2018 Crude Oil and short July 2018 Heating Oil. The spread has been in a down-trend for several months but seems to slow down. As we can see on the seasonal chart the July Crude Oil usually outperforms the July Heating Oil during the time between 12/06 and 01/18. Because we are spreading between two different markets the spread requires high margin and high risk of about $1,000 to $1,500.
Learn how we manage this trade and how to get detailed trading instructions every day!
What to do around news events or when the market starts to move strongly caused by some news that just hit the market? I’m sure this is one of the most common questions traders ask themselves every day. At least I do!
If you’re new to trading and actually take this as a serious business, not just another place to gamble here’s my answer: Don’t trade shortly before or after news releases and come back when the market is back to normal. The odds of getting into trouble are much higher than making a profit if you don’t know what you’re doing.
On the other side if you’re an experienced trader you might have recognized that it’s not all black and white when it comes to trading news. Yes, volatility can get crazy, liquidity can be worse than usual and often you’ll just get stopped out of trades before the market takes off. But often this is also the time when the market does make major moves and to survive as traders it’s helpful if you can capture some of these. That’s especially true in news driven markets like the currency markets.
What I like to do when the setup is right is to fade the initial market move at price levels where I consider the market too stretched to move through. Here’s what I watch out for:
Get into trades only with limit orders, the odds of getting negative slippage are too high using market orders. Using limit orders chances aren’t bad you’ll get positive slippage on a regular basis.
Cancel any orders that are close to where the market is trading before the news. Odds are they’ll get filled simply due to the volatility in the market.
Fade the move at support/resistance points where the market might be too stretched to move through on the first attempt. Moving to a lower timeframe to look for reversal patterns can be helpful if you don’t like blindly fading a strong move.
Use small stops and multiple R targets. This will only work if you capture > 3R winners on a regular basis. Many of these trades will not work out and often you’ll have to take a full loss.
To achieve this, don’t scale out. You don’t want to hit that 5R profit target with only 1/3 of your position on! Instead, trail your stop and tail it tighter the more parabolic the move gets.
Have a far-off profit target in place in case the market goes crazy enough to make it there.
Here’s an example from this Monday of such a trade in GBP/USD. It’s a very nice example and most trades don’t turn out that nicely but showing a losing trade that just stopped me out would be boring right? I had planned to buy around 1.3290 but as the news hit the board I canceled the order. But just in case the market would go there I put in a new entry order at a much lower price (see chart). I got filled there when the pound really was sold off and about 2 hours later the market unexpectedly hit my profit target. While the pound was moving higher I kept on moving up my stop but luckily didn’t get stopped out before the target was hit.
Happy Trading!
Marco
Feel free to email Marco Mayer with any questions, This email address is being protected from spambots. You need JavaScript enabled to view it..
To view previous published Chart Scan newsletters, please log in or click on "Join Us,"
shown above, to subscribe to our free "Members Only" section.
A WEALTH OF INFORMATION & EDUCATION:
Joe Ross-Trading Educators' popular free Chart Scan Newsletter has been published since 2004.
Note: Unless otherwise noted, all charts used in Chart Scan commentary were created
by using Genesis Financial Technologies' Trade Navigator (with permission).
Legal Notice and Copyright 2017 Disclaimer - Published by Trading Educators, Inc.
Chart Scan is a complimentary educational newsletter.
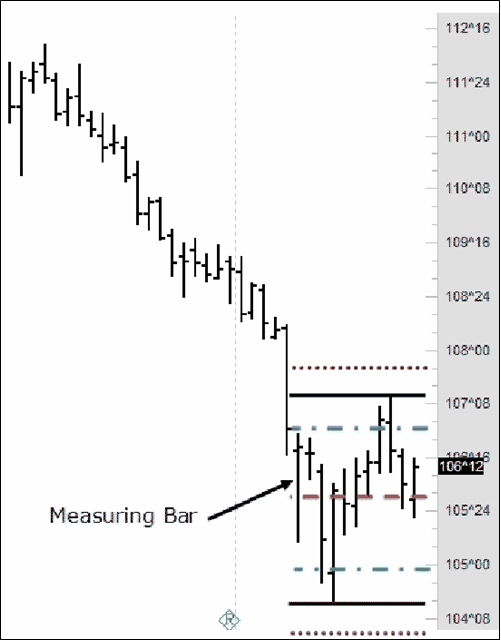
We have been taking this series one step at a time. I have drawn the trading envelope at the earliest possible time — the time I was first able to identify congestion (11-20 bars). Prices had entered the upper trading zone between the congestion high and the .146 inner zone (dash-dot green line). The entry was on the 8th bar from the left including the measuring bar.
Once prices entered that zone, I was looking to go short 1 tick below the inner zone line. Assuming I was trading 10 contracts, and because I could afford it, I placed my initial stop loss 1 tick above the congestion high. My objective was to liquidate 7 contracts at the midpoint line (red line). If prices would reach the midpoint line, I would move the protective stop on 1 contract to break even and the protective stop on 2 contracts to protect 50% of my profits. As you can see from the chart, I was filled as prices exited the inner zone. Two bars later I was filled at the midpoint line. On the last bar on the chart you can see that my 50% stop was hit.
Because the bar that hit my 50% stop was a reversal bar, I moved my breakeven stop to 1 tick above the high of the last bar on the chart. The following day (not shown) I was stopped out there. I was paid to trade on all parts of my position. That’s all I ever ask of a market.
Markets can and do spillover from one to the other. We saw this back in 2007, and we can now see how dangerously close we were then and are now to a melt-down.
Until early in 2007, I had never heard of US subprime lending. On hearing the detail, it left me with a sense of wonderment.
“You mean, the borrower lies about his income (no job, no income, no hope) and the lender offers exceptionally low 'teaser' interest rates, with the proviso of these going up by half (!) within two years, and nobody screamed?”
And then they took such loans, bundled them with better loans, sliced and spliced the end result like so much rope, got rating agencies to apply the last rites, and sold them on to unsuspecting institutions looking for yield enhancement (a little extra margin, magnified sixteen times by leveraging, so that anything small really started to look impressively large)!
And that house of cards was supposed to remain intact?
If you had never tasted snake-oil before, this was your golden opportunity. About a $1 trillion of the stuff was written, first Fed estimates were that $100bn would go bad, but add the misadventure of any misguided leveraging, and the final bill would be about $250bn.
That would have sunk the US banking system. But because banks securitized and offloaded the stuff faster than they generated it, relatively little stuck to banks, except to the extent that their asset management funds invested in such stuff.
Anyway, the $250bn was spread around the world, at least 10% in Japan, a goodly portion in Europe and a fair amount in lower Manhattan. The losses would rest where they fell. Rest in peace.
Meanwhile, financial markets in their entirety couldn't quite figure where all the bodies were buried. A few hedge funds owed up (and folded). A few banks wrote off early and got mostly ignored. A few latecomers owed up and got clobbered. But by then the greater universe was on a witch hunt, while pulling away from leveraged corporate debt as well.
Banks became wary of counterparty banks. “Are you still good?
A rush for Treasury bonds ensued, sinking such bond yields. A flight to safety was in progress.
On 10 August it got so bad that European money market rates no longer reflected central bank targeted rates. Trust was out of the window and the willingness to deal getting thin indeed. Liquidity was drying up. The ECB, faced with banks being unable to get funds, injected $130bn, followed shortly by Fed and BoJ.
Another week and US credit markets generally seized up, with heavy spillover into equity markets, as uncertainty bit and induced risk aversion, good assets were sold to cover bad credit losses, and basically everyone lost their nerve.
Even Japanese housewives reversed positions, dumping Aussie and Kiwi and causing the Japanese Yen to shoot through the roof as the carry-trade got liquidated.
Not a moment too soon the Fed finally capitulated, but not in the usual way. The unusual twist was to lower only the discount rate by 0.5%, halving the penalty the banks pay to go into the central bank to cover their liquidity needs.
Would it be enough? If liquidity didn't improve, with massive volatility marking most markets as investors tried to re-establish value where anarchy ruled, the Fed at some point had to capitulate for real and go the whole hog, even lowering fed funds rate once, twice or even three times by 0.25%.
It proved to be an interesting year. Instead of being floored by bird flu, or getting fallout from US nuking of Iranian nuclear facilities, the world got old-fashioned credit failure, coupled to stress-testing leveraged universes.
Philippe Gautier: Administration and New Developments
Developer: Joe Ross
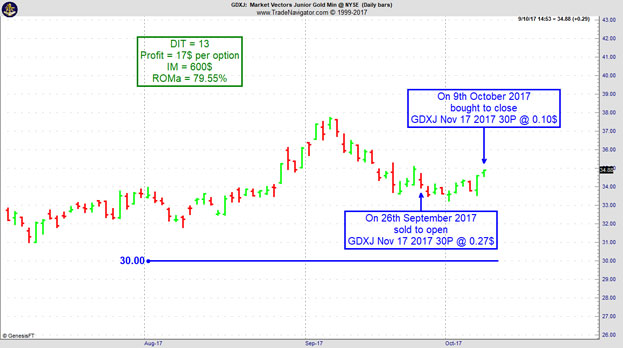
On 25th September 2017 we gave our Instant Income Guaranteed subscribers the following trade on Market Vectors Junior Gold Min (GDXJ). We sold price insurance as follows:
On 26th September 2017, we sold to open GDXJ Nov 17 2017 30P @ 0.27$, with 51 days until expiration and our short strike about 14% below price action.
On 9th October 2017, we bought to close GDXJ Nov 17 2017 30P @ 0.10$, after 13 days in the trade for quick premium compounding.
Profit: 17$ per option
Margin: 600$
Return on Margin annualized: 79.55%
Philippe
Receive daily trade recommendations - we do the research for you!
If it was easy to win at trading, there would be more millionaires. The techniques for trading are simple. The age-old question is how to balance patience, wisdom, and prudent care against going for the grand slam.
In trading, pulling the trigger on when to trade equally important as all the preparation and attention to detail that went before. In other words, timing is everything when it comes to entering the trade. If a trade does not do well at the start, the trader must be disciplined and have ready a variety of alternate courses of action. As long as the circumstances for making the trade are still in effect, the trader can stay with the position. However, I believe in using a time stop. A time stop says, “I will exit the trade within a set amount of time even if the circumstances for making it are still in effect.” In the way I trade, success depends on prices quickly moving my way. If they fail to move my way, I know that my timing was off and I exit. Sometimes I have made a little and sometimes I lose a little. Overall, I do a little less than break even on the trades that time out. If circumstances are still the same, I look for a better time to get into the trade. My point is this: If my timing was off, I was wrong. When I’m wrong, I get out.
In this video, Marco gives you some insights on his journey into the world of traditional trend following. He talks about how trend following works, what to consider, and if it's a trading style for the average trader to consider. This is Part 1 of a 2-Part series. In his Part II, Marco will go into the details of his backtests.
Feel free to email Marco Mayer with any questions, This email address is being protected from spambots. You need JavaScript enabled to view it..
To view previous published Chart Scan newsletters, please log in or click on "Join Us,"
shown above, to subscribe to our free "Members Only" section.
A WEALTH OF INFORMATION & EDUCATION:
Joe Ross-Trading Educators' popular free Chart Scan Newsletter has been published since 2004.
Note: Unless otherwise noted, all charts used in Chart Scan commentary were created
by using Genesis Financial Technologies' Trade Navigator (with permission).
Legal Notice and Copyright 2017 Disclaimer - Published by Trading Educators, Inc.
Chart Scan is a complimentary educational newsletter.
"Teach our students the truth in trading - teach them how to trade,"
and
"Give them a way to earn while they learn - realizing that it takes time to develop a successful trader."
Derivative transactions, including futures, are complex and carry a high degree of risk. They are intended for sophisticated investors and are not suitable for everyone.
There are numerous other factors related to the markets in general or to the implementation of any specific trading program which cannot be
fully accounted for in the preparation of hypothetical performance results, and all of which can adversely affect actual trading results.
For more information, see the Risk Disclosure Statement for Futures and Options.