- Short Term Trading
- Futures
Edition 721 - April 6, 2018
We are sorry for any inconveniences. Our website is under temporary construction to fix missing graphics and shopping cart errors.
Please email us at This email address is being protected from spambots. You need JavaScript enabled to view it. if you have questions or experiencing errors while placing an order. Thank you in advance for your patience.

by Master Trader Joe Ross
Author, Trader, Trading Mentor, and Founder of Trading Educators, Inc.
Developer of Instant Income Guaranteed
Chart Scan with Commentary - Volatility
You may laugh at what I'm going to say and show you next, but all I can say is that there was no need to suffer, if you traded what you saw. As a trader, you cannot afford to fixate on your opinion, and you cannot in any way become rigid and full of fear. Just as markets cannot forever rise without correcting, so can markets never fall without experiencing a correction. Sooner or later, profit taking is going to enter the picture. On the chart below we are seeing exactly that situation. Short covering will cause prices to rise, and anticipating that they would rise, you should have been ready to see it happen.
I'm going to use a 240-minute chart to show you what I mean, and to demonstrate why, in a market displaying extreme momentum, I use a very tight stop.
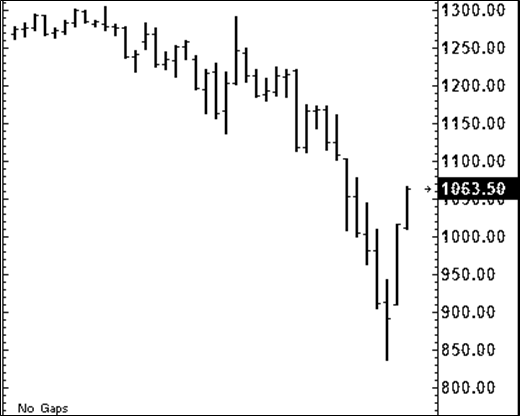
The Law of Charts shows you graphically the action and reaction of humans to the movement of price. Forget for a moment all that you knew about the news, your feelings about the market, and your opinion as well as that of any others. What exactly did you see?
As prices were falling, did you see prices make a higher high? Could you have comfortably placed a stop 1 tick above the high of each 240-minute bar in order to lock in profits? Let's go one step further. Could that trailing stop have been a reversing stop considering that at any time the anticipation was for shorts to take profits?
I don't want to nay-say the reasons for the market having moved up. What I want you to see is that everything you needed to know was right there on the chart in front of you at all times. If/when prices are falling, they should not make a higher high. If they do, you need to be flexible, change your thinking, and consider reversing your position. You simply cannot afford to trade your opinion. You cannot afford to trade anyone else's opinion. Simply trade what you see, and most of the time you'll do just fine.
What is the anticipation for the next thing to happen? Yes! You got it, longs will take profits on the move up, and prices will move down. How far will they correct? They could retest the area around 850. However, that is guessing, not anticipating. If you hold an opinion that prices will retest the 850 area, to the degree you hold that opinion you will be blind to see what is actually happening in the market.
If at 850, where prices turned we were looking at a bottom, we can anticipate a double bottom. But your anticipation should go no further than that. Do not try to predict a price. If you are currently long, have a reversing stop in place for the next correction. The reversing stop will lock in profits and get you going in the right direction for the next move down. How far down? No one knows, so if your reversing order is filled, be ready to get out quickly in case prices fail to correct enough for you to take some profit out of the reversal trade.
© by Joe Ross. Re-transmission or reproduction of any part of this material is strictly prohibited without the prior written consent of Trading Educators, Inc.
by Master Trader Joe Ross
Author, Trader, Trading Mentor, and Founder of Trading Educators, Inc.
Developer of Instant Income Guaranteed
Trading Article - Slumps
Ever make a bunch of losing trades and just feel like giving up? Perhaps you were just panicking for no good reason. You may have merely fallen for a pessimistic attitude that was enough to put you in a slump. Thoughts are powerful. The reality of the situation may not matter. All that may matter in the end is your perceptions of the situation, right or wrong. How you look at a situation can dictate how you will react. If you react with pessimism and hopelessness, you may have difficulty recovering from a slump.
Consider how David reacted to a major setback. When I asked him if he thought about giving up trading after a major slump he said. "No. I just said, 'All right, that's it. I've got to go back to the drawing board and really examine what the heck just happened.' And I did. It turned out to be just another plateau, the next step of learning." David didn't give up. He just looked at the setback as a new starting point. He looked closely at his trading methods and examined what he was doing wrong. In this case, he learned to manage risk so that he would no longer mount huge losses. The point is that when you face a slump, you should not let pessimism keep you down. Take setbacks in stride. Don't flinch. Something may have gone wrong, but don't let the setback get you down. Take an active problem solving approach. Try to instinctively search for a solution. Rather than panic, it is important to take an active, problem solving approach. Don't over-interpret the significance of a slump. We all have them.
Professional athletes have slumps, but they have to go out and perform even when they are in a slump. As traders, we can stop trading, figure out what’s wrong, and then carefully get back into the market.
Your attitude and perceptions powerfully influence how you react to events, such as a series of losing trades. Another trader friend of mine, when describing his mental edge, told me, "I don't fear a particular outcome. A set of losses to me is not necessarily bad, in isolation." He also takes a detached perspective when he trades. He isn't consumed with money. He said, "I don't think, 'I can buy this or I can buy that with this amount of money.' I don't get emotionally caught up in things. I have the type of personality that makes it easy for me to withstand long-term periods of losses."
Don't focus on internal, personal reasons for a setback. When trying to pick yourself up after a setback, stayed focused on your ongoing experience, ignore any feelings of doubt, and continue to search for solutions. When you enter a low point, it isn't useful to mull over how you're in a slump. Instead, you must stand up and take action. The more focused you can trade and the more actively you can respond, the more likely you'll be one of the few who can rise above the masses and become a winning trader.

By Philippe Gautier: Administration and New Developments
Developer: Joe Ross
Trading Example: Instant Income Guaranteed
TRADE WITH NO LOSSES
Here's our latest example!
GWR Trade
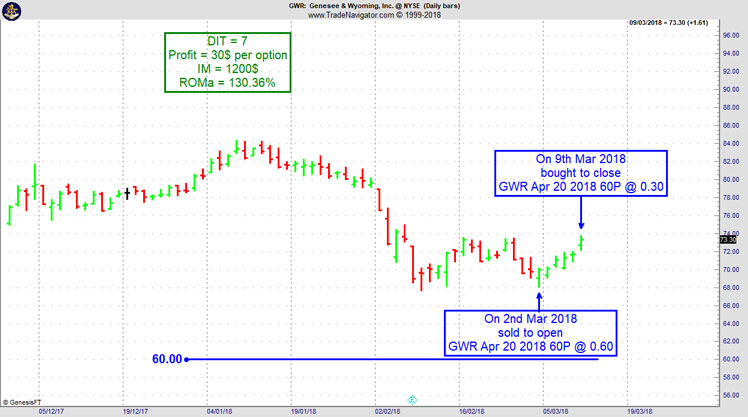
On 20th February 2018 we gave our Instant Income Guaranteed subscribers the following trade on Genesee & Wyoming Inc (GWR). Price insurance could be sold as follows:
- On 2nd March 2018, on a GTC order, we sold to open GWR Apr 20 2018 60P @ 0.60, with 49 days until expiration and our short strike about 15% below price action,
- On 9th March 2018, we bought to close GWR Apr 20 2018 60P @ 0.30, after 7 days in the trade for quick premium compounding
Profit: 30$ per option
Margin: 1200$
Return on Margin annualized: 130.36%
Philippe
Receive daily trade recommendations - we do the research for you.
♦ SIGN UP TODAY! THIS IS WORTH THE INVESTMENT ♦
Learn More!
Instant Income Guaranteed
© by Joe Ross and Philippe Gautier. Re-transmission or reproduction of any part of this material is strictly prohibited without the prior written consent of Trading Educators, Inc.

Trading Article - What am I doing wrong?
I do an awful lot of research into a market before I attempt to take a trade into it. I look at fundamentals and I try to glean as much information as I can about the underlying. I think I’m doing a more than adequate job of information seeking, but I still am not even a breakeven trader. What am I doing wrong?
Well, it could be that you are suffering from information overload. It could also be that you are gathering information about the wrong things. People have a tendency to believe that the accuracy of their trading increases with more information. This is one of the illusions of knowledge—that more is somehow better—that more information increases your knowledge about something and improves your decision- making ability. But, that is not necessarily true— increased levels of information do not always lead to greater knowledge. There are three reasons for this. First, people tend to interpret new information as confirmation of what they previously believed. You believe what you want to believe—you are biased, even if unconsciously so. Second, some information does not help us in making predictions, and can even mislead us. Finally, we often do not have the training, experience, or skills to interpret the information correctly.
You must closely examine the kind of information you are looking at and assess its real value to the markets you are trying to trade. I have seen traders keep elaborate records of everything they are doing as they trade. They keep files full of articles and reference materials which they pore over prior to making a trade. But is all this really necessary? I doubt it. It is much better to trade what you see without having to find justification through research for every trade.
Andy Jordan is the editor for Traders Notebook which shows you Futures Trading Strategies in Spreads, Options, and Swing Trades. Learn step-by-step how to trade successfully.
Click Here for Valuable Information about Traders Notebook
© by Andy Jordan. Re-transmission or reproduction of any part of this material is strictly prohibited without the prior written consent of Trading Educators, Inc.

by Professional Trader Marco Mayer
Educator for Forex, Futures and Systematic Trader
Creator of Ambush Trading Method, Ambush Signals, and Head of AlgoStrats.com
Trading Article - Who's next in line?
"Buy low, sell high" is one of the most popular memes in the investment and trading world. And obviously, it does make sense, who wouldn't like to buy low and sell high all the time? I found this to be quite a helpful advice to invest in stocks for example. Wait for a crash, buy it and sell again when prices are back to old highs.
Of course, the problem often is to figure out what's actually a low price and what's a high price. You can also buy high and sell higher to make a profit, which is how trend following works.
So what's the real deal here? I think the actual question to ask is "who's going to buy after me?" or "who's next in line?". Will there be enough traders willing to buy after you did at a higher price? Or if you're short the other way around, will there be sellers standing in line to sell after you did or not?
Think about it. To make a profit that's exactly what needs to happen. If you buy at $100, the only way to make a profit is if there are buyers willing to buy at higher prices. If they don't bid it up after you and you find someone to sell to at a higher price, you won't make a profit. Simple fact most traders are not really aware of.
Obviously, there's always someone who's gonna be the last in line. Someone is going to buy the high of the day/week/month/year/all-time. In poker, there's the popular saying that if you don't know who the patsy is in the round after 30 minutes, it's probably you. That same idea applies to trading. If you don't know why other traders are probably willing to buy at a higher price after you during the day, you might be the last one in the order book to bid at such a high price for today.
Because of that, it's always helpful to ask yourself "Who's gonna buy/sell after me and why?". If you can't answer that question it might be best to skip the trade!
Happy Trading!
Marco
© by Marco Mayer. Re-transmission or reproduction of any part of this material is strictly prohibited without the prior written consent of Trading Educators, Inc.
Check out our Blog!
To view previous published Chart Scan newsletters, please log in or click on "Join Us,"
shown above, to subscribe to our free "Members Only" section.
A WEALTH OF INFORMATION & EDUCATION:
Joe Ross-Trading Educators' popular free Chart Scan Newsletter has been published since 2004.
Note: Unless otherwise noted, all charts used in Chart Scan commentary were created
by using Genesis Financial Technologies' Trade Navigator (with permission).
Legal Notice and Copyright 2018 Disclaimer - Published by Trading Educators, Inc.
Chart Scan is a complimentary educational newsletter.
© by Trading Educators, Inc. Re-transmission or reproduction of any part of this material is strictly prohibited without prior written consent.
- Short Term Trading
- Futures
Edition 720 - March 30, 2018

Trading Article - Don’t spread a losing trade!
by Professional Trader Andy Jordan
Educator for Spreads, Options, Swing/Day Trading, and
Editor of Traders Notebook Complete
While it is good trading to spread a winning trade if you feel the need to hedge your position, never spread a losing trade. Simply exit the market. The usual net result of spreading a losing trade is that both sides may be taken off at a loss. If you can not admit you are wrong, or know what price your trade is wrong, you have no business trading. Spread trading is best initiated after the spread trend has been defined and both trades are entered and exited simultaneously. Spreading a loss converts one mistake into two.
When might you want to spread a winning trade? You do so ahead of a report which might have an adverse result on your trade. You do so when you hear a rumor or piece of news that might cause the trade you are in to turn from a winner into a loser.
Why not just get out and get back in after the report? Because it is often best to “stay in the water” if you want to catch the next wave. If you are in a spread, you are already “in the water.” If you get out, you run the risk of not being able to get back in.
Andy Jordan is the editor for Traders Notebook which shows you Futures Trading Strategies in Spreads, Options, and Swing Trades. Learn step-by-step how to trade successfully.
Click Here for Valuable Information about Traders Notebook
© by Andy Jordan. Re-transmission or reproduction of any part of this material is strictly prohibited without the prior written consent of Trading Educators, Inc.
Last chance for big savings!
by Professional Trader Marco Mayer
Educator for Forex, Futures and Systematic Trader
Creator of Ambush Trading Method, Ambush Signals, and Head of AlgoStrats.com
Marco Mayer's offer will expire today, March 30th!
Ambush hits new all-time equity highs in 2018!
Many traders have taken advantage of Marco's offer and so should you!
These savings will end today, March 30th - don't miss out!
Save $215 Off Regular Price for a 6-Month Subscription!
Click HERE to purchase AMBUSH SIGNALS for 6-MONTHS
Save $629 Off Regular Price for a 1-Year Subscription!
Click HERE to purchase AMBUSH SIGNALS for 1-YEAR
Yes, Ambush did it again as most of the Ambush markets and portfolios just hit new all-time equity highs in March!
Trading has been tough for most traders so far this year, especially due to the crazy correction we had in the stock markets in early February. This lead to higher volatility in many markets mixed with a lot of uncertainty and crazy market moves.
That’s a recipe for disaster for many trading strategies but for Ambush it’s one of the most favorable market conditions. And oh boy did it rally during that period .The Ambush Small Portfolio, for example, showed a performance gain of over 11k within just four weeks of trading!
Thanks to that rally, almost all Ambush markets are now showing nice gains for 2018 and the year just started. To give you a better picture, here’s a chart showing the performance of all Ambush Futures markets (per contract) so far in 2018:
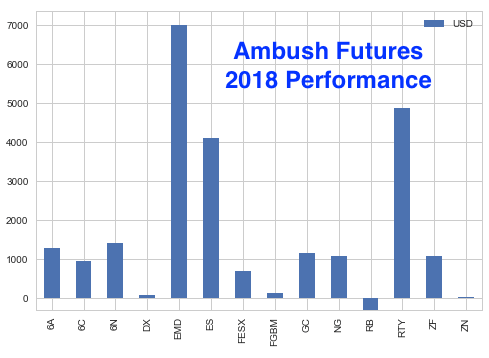
As you can see, only RBOB Gasoline is left with a slightly negative performance and especially the equity indices like the E-Mini S&P 500 (ES) or the E-Mini Russell 2000 (RTY) have been exceptional performers.
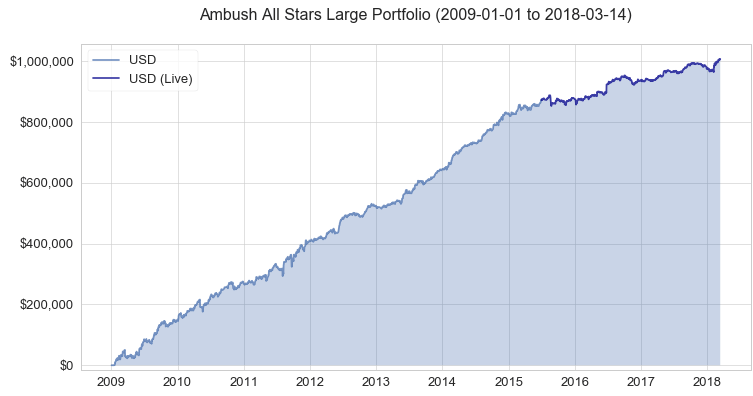
Now, this is just a tiny part of the whole Ambush history, so let’s zoom out and have a look at the broader picture. Ambush has been around for almost 10 years now. That’s exceptional for a trading system. Actually, it’s the only one I know that’s been around that long. But as markets tend to change, I do review Ambush once a year to see if any changes are necessary to adapt to changing market conditions. The last time any significant changes have been required was in July 2015. As you can see on the following chart Ambush kept on performing as expected since then in live trading.
You can find out more about the sample portfolios and the long-term performance of each of the Ambush Markets on the Performance Page.
If you missed these first few months of Ambush Trading in 2018, you probably want to get on board now.
Join us and become an Ambush Trader!
The most popular and easiest way to follow Ambush is Ambush Signals. It does all the work for you, allows you to customize what markets you want to see and has a position sizing tool implemented to automatically adjust the positions to your risk preferences.
Each day around 6:30 pm NY Time the Signals are available for you on the Dashboard. You can then place your orders and literally walk away until the next market close! To find out more about the details of Ambush and how Ambush Signals works, have a look at the Ambush Signals Website.
Let’s be realistic. Following any System can be tough, especially in the beginning. It simply needs time to build the confidence needed to make it through inevitable drawdowns. So what if you’re unlucky and don’t catch a good start right away?
I want you to succeed trading Ambush Signals, so here’s something for you that will strongly increase your odds of success and allow you to easily gain the confidence you’ll need to become a long-term profitable Ambush trader.
We offer you 6 months of Ambush Signals for just $499. That’s a saving of $215, giving you almost two months of Ambush Signals for free. We usually only offer monthly or 3-months subscriptions, this is a very special offer!
These 6 months will allow you to get to know Ambush Signals without too much stress or pressure and to follow it for a long enough time period that it simply won’t that much if you’re lucky and start on Ambush’s best trading month ever or not.
Don’t miss out on this and get your 6 months of Ambush Signals for $499 today!
Offer Expires March 30th!
Click HERE to purchase AMBUSH SIGNALS for 6-MONTHS
Now many of you already have been following Ambush for years now and so you’ve been asking for a long-term subscribers bargain. Here it is. For the first time ever we offer you a whole year of Ambush Signals for $799. That’s a whopping $629 off the regular yearly subscription price, giving you over five months for free!
Offer Expires March 30th!
Click HERE to purchase AMBUSH SIGNALS for 1-YEAR
Ambush eBook
If you’d prefer to rather generate the signals on your own and want to know the exact trading rules of Ambush, you want the Ambush ebook. We also have a very special offer for you then:
Coupon Code for $500 off:
- Ambush eBook: use "ambush500" to get the Ambush eBook $500 off, for $1,299 instead of $1,799.
Did we mention - All Special Offers are valid only until March 30th? Hurry up and don’t miss out!
Happy Trading!
Marco Mayer
Feel free to email questions to Marco Mayer, This email address is being protected from spambots. You need JavaScript enabled to view it..
© by Marco Mayer. Re-transmission or reproduction of any part of this material is strictly prohibited without the prior written consent of Trading Educators, Inc.
Chart Scan with Commentary - Charts Can Talk
by Master Trader Joe Ross
Author, Trader, Trading Mentor, and Founder of Trading Educators, Inc.
Developer of Instant Income Guaranteed
A chart can tell you which way prices will soon go. Your job as a trader is to learn how to read the language of the chart.
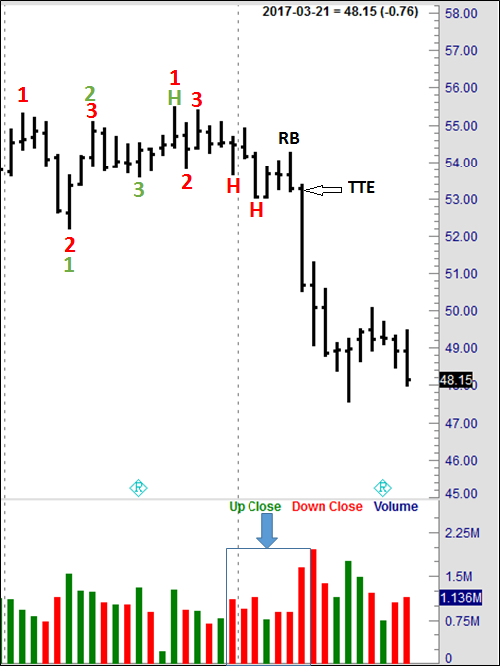
Crude oil prices had been in a very long period of consolidation from December 1, 2016 to March 7, 2017.
Consolidation periods are loaded with 1-2-3 formations, but most of them fizzle, and go nowhere. At times you will see a 1-2-3 formation followed by a Ross Hook, but the Hook also fizzles. Nevertheless, as you can see on the chart below, a 1-2-3 followed by a Hook (H), and then another Hook (H), starts loudly telling you which way prices are going to break out from the consolidation. What you actually have is an established trend taking place within the range of the consolidation.
Next, look below prices at the volume section of the chart (blue arrow). Starting with the time of the first downward Hook (H), there were 6 days of down-closes, and only one day of an up-close. Prices screamed “go short” by giving us a reversal bar (RB) with a Traders Trick Entry (TTE).
© by Joe Ross. Re-transmission or reproduction of any part of this material is strictly prohibited without the prior written consent of Trading Educators, Inc.
Trading Example: Instant Income Guaranteed
Philippe Gautier: Administration and New Developments
Developer: Joe Ross
TRADE WITH NO LOSSES
Here's our latest example!
SFIX Trade
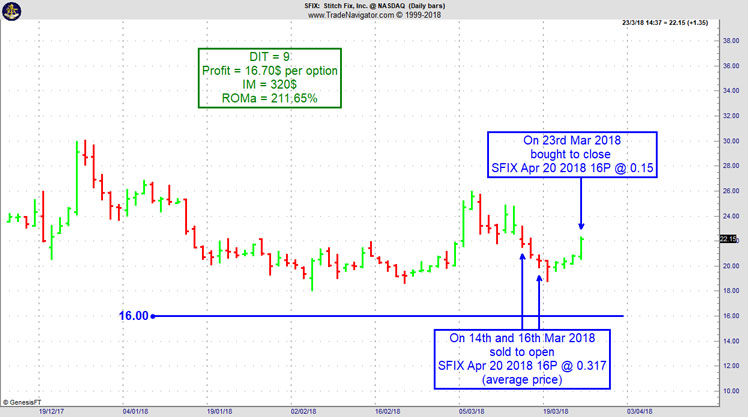
On 13th March 2018 we gave our Instant Income Guaranteed subscribers the following trade on Stitch Fix Inc. (SFIX). Price insurance could be sold as follows:
- On 14th and 16th March 2018, we sold to open SFIX Apr 20 2018 16P @ 0.317 (average price), with 35 days until expiration and our short strike about 30% below price action,
- On 23rd March 2018, we bought to close SFIX Apr 20 2018 16P @ 0.15, after 9 days in the trade for quick premium compounding.
Profit: 16.70$ per option
Margin: 320$
Return on Margin annualized: 211.65%
Philippe
Receive daily trade recommendations - we do the research for you.
♦ SIGN UP TODAY! THIS IS WORTH THE INVESTMENT ♦
Learn More!
Instant Income Guaranteed
© by Joe Ross and Philippe Gautier. Re-transmission or reproduction of any part of this material is strictly prohibited without the prior written consent of Trading Educators, Inc.
To view previous published Chart Scan newsletters, please log in or click on "Join Us,"
shown above, to subscribe to our free "Members Only" section.
A WEALTH OF INFORMATION & EDUCATION:
Joe Ross-Trading Educators' popular free Chart Scan Newsletter has been published since 2004.
Note: Unless otherwise noted, all charts used in Chart Scan commentary were created
by using Genesis Financial Technologies' Trade Navigator (with permission).
Legal Notice and Copyright 2018 Disclaimer - Published by Trading Educators, Inc.
Chart Scan is a complimentary educational newsletter.
© by Trading Educators, Inc. Re-transmission or reproduction of any part of this material is strictly prohibited without prior written consent.
- Short Term Trading
- Futures
Edition 719 - March 23, 2018
Trading Idea - Cotton (yeah, the white fluffy stuff!)
by Professional Trader Andy Jordan
Educator for Spreads, Options, Swing/Day Trading, and
Editor of Traders Notebook Complete
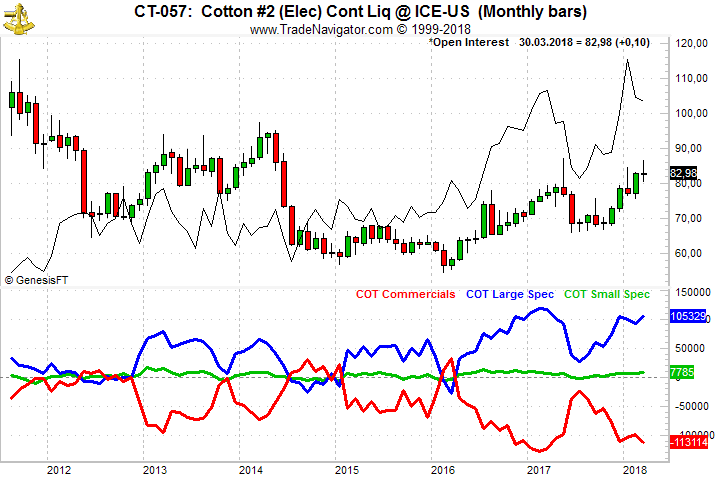
This week, we're looking at Cotton (ICE), especially at the December 2018 contract. As you can see on the chart below, the December Cotton is usually turning to the down-side in April (looking at the blue 15 year seasonal chart) or early May (looking at the last 5 years, red line on the chart below).
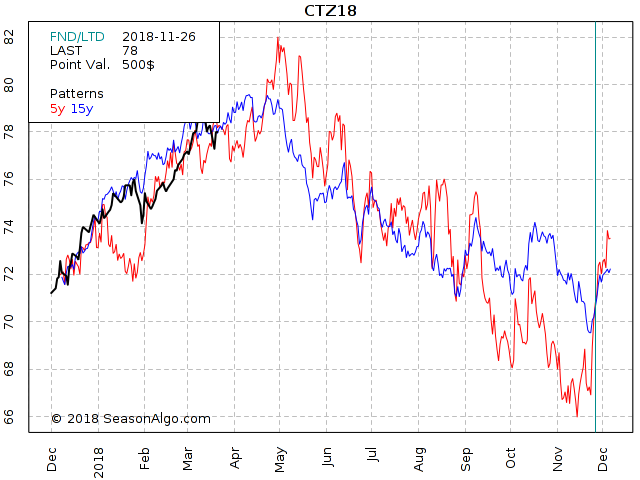
In addition to the seasonal factor, the Commercials are extremely net short and as we know, they are usually (not always) on the correct side of the market long term. Considering also the long up move from November 2017 until now, the chances are high that we see a lower market during the next few months.
December is still far away and therefore it might make sense to scale into a short call position during the next few weeks or even next 2 months using far out of the money calls.
Andy Jordan is the editor for Traders Notebook which shows you Futures Trading Strategies in Spreads, Options, and Swing Trades. Learn step-by-step how to trade successfully.
Click Here for Valuable Information about Traders Notebook
© by Andy Jordan. Re-transmission or reproduction of any part of this material is strictly prohibited without the prior written consent of Trading Educators, Inc.
Huge savings that don't want to pass you by, offer expires March 30th
by Professional Trader Marco Mayer
Educator for Forex, Futures and Systematic Trader
Creator of Ambush Trading Method, Ambush Signals, and Head of AlgoStrats.com
Ambush hits new all-time equity highs in 2018!
Yes, Ambush did it again as most of the Ambush markets and portfolios just hit new all-time equity highs in March!
Trading has been tough for most traders so far this year, especially due to the crazy correction we had in the stock markets in early February. This lead to higher volatility in many markets mixed with a lot of uncertainty and crazy market moves.
That’s a recipe for disaster for many trading strategies but for Ambush it’s one of the most favorable market conditions. And oh boy did it rally during that period .The Ambush Small Portfolio, for example, showed a performance gain of over 11k within just four weeks of trading!
Thanks to that rally, almost all Ambush markets are now showing nice gains for 2018 and the year just started. To give you a better picture, here’s a chart showing the performance of all Ambush Futures markets (per contract) so far in 2018:
As you can see, only RBOB Gasoline is left with a slightly negative performance and especially the equity indices like the E-Mini S&P 500 (ES) or the E-Mini Russell 2000 (RTY) have been exceptional performers.
Now, this is just a tiny part of the whole Ambush history, so let’s zoom out and have a look at the broader picture. Ambush has been around for almost 10 years now. That’s exceptional for a trading system. Actually, it’s the only one I know that’s been around that long. But as markets tend to change, I do review Ambush once a year to see if any changes are necessary to adapt to changing market conditions. The last time any significant changes have been required was in July 2015. As you can see on the following chart Ambush kept on performing as expected since then in live trading.
You can find out more about the sample portfolios and the long-term performance of each of the Ambush Markets on the Performance Page.
If you missed these first few months of Ambush Trading in 2018, you probably want to get on board now.
Join us and become an Ambush Trader!
The most popular and easiest way to follow Ambush is Ambush Signals. It does all the work for you, allows you to customize what markets you want to see and has a position sizing tool implemented to automatically adjust the positions to your risk preferences.
Each day around 6:30 pm NY Time the Signals are available for you on the Dashboard. You can then place your orders and literally walk away until the next market close! To find out more about the details of Ambush and how Ambush Signals works, have a look at the Ambush Signals Website.
Let’s be realistic. Following any System can be tough, especially in the beginning. It simply needs time to build the confidence needed to make it through inevitable drawdowns. So what if you’re unlucky and don’t catch a good start right away?
I want you to succeed trading Ambush Signals, so here’s something for you that will strongly increase your odds of success and allow you to easily gain the confidence you’ll need to become a long-term profitable Ambush trader.
We offer you 6 months of Ambush Signals for just $499. That’s a saving of $215, giving you almost two months of Ambush Signals for free. We usually only offer monthly or 3-months subscriptions, this is a very special offer!
These 6 months will allow you to get to know Ambush Signals without too much stress or pressure and to follow it for a long enough time period that it simply won’t that much if you’re lucky and start on Ambush’s best trading month ever or not.
Don’t miss out on this and get your 6 months of Ambush Signals for $499 today!
Offer Expires March 30th!
Click HERE to purchase AMBUSH SIGNALS for 6-MONTHS
Now many of you already have been following Ambush for years now and so you’ve been asking for a long-term subscribers bargain. Here it is. For the first time ever we offer you a whole year of Ambush Signals for $799. That’s a whopping $629 off the regular yearly subscription price, giving you over five months for free!
Offer Expires March 30th!
Click HERE to purchase AMBUSH SIGNALS for 1-YEAR
Ambush eBook
If you’d prefer to rather generate the signals on your own and want to know the exact trading rules of Ambush, you want the Ambush ebook. We also have a very special offer for you then:
Coupon Code for $500 off:
- Ambush eBook: use "ambush500" to get the Ambush eBook $500 off, for $1,299 instead of $1,799.
Did we mention - All Special Offers are valid only until March 30th? Hurry up and don’t miss out!
Happy Trading!
Marco Mayer
Feel free to email questions to Marco Mayer, This email address is being protected from spambots. You need JavaScript enabled to view it..
© by Marco Mayer. Re-transmission or reproduction of any part of this material is strictly prohibited without the prior written consent of Trading Educators, Inc.
Chart Scan with Commentary - Cluster Breakouts
by Master Trader Joe Ross
Author, Trader, Trading Mentor, and Founder of Trading Educators, Inc.
Developer of Instant Income Guaranteed
In my book "Day Trading", I presented an idea for trading cluster breakouts in EUR/USD. This morning I was wondering if there were good cluster breakouts in other markets. I really needed to do some trading. When I go for awhile without trading, the desire to do so becomes a persistent itch.
Lately, due to other commitments and activities, my trading time has been sparse and limited to experimentation with a stock trading idea which I continue to work on. This morning I took a look at Treasury Bonds to see if cluster breakouts would work well there. The chart shows what I discovered.
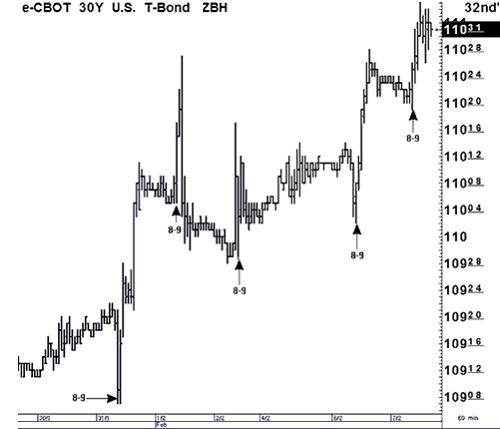
By cluster I refer to groups of rather small bars, more or less moving sideways. The idea is to wrap an envelope around the cluster and then trade a breakout of the envelope. I have marked the bars where the breakout occurred, and please note that these 60-minute bars all begin at the start of an hour, e.g., 8 AM to 9 AM.
It seems that in most cases, the move begins with the 8 AM bar or is completed by the 8 AM bar. Viewing from right to left, we see:
1. A violation of the cluster centered around 110^24 begins with the 8 AM bar and completes with the 9 AM bar.
2. The cluster centered around 110^11 is violated first by the 8 AM bar and later by the 11 AM bar.
3. The cluster centered around 110^02 is violated by the 8 AM bar.
4. The cluster centered around 110^07 is violated by the 8 AM bar.
© by Joe Ross. Re-transmission or reproduction of any part of this material is strictly prohibited without the prior written consent of Trading Educators, Inc.
Trading Example: Instant Income Guaranteed
Philippe Gautier: Administration and New Developments
Developer: Joe Ross
TRADE WITH NO LOSSES
Here's our latest example!
AA Trade
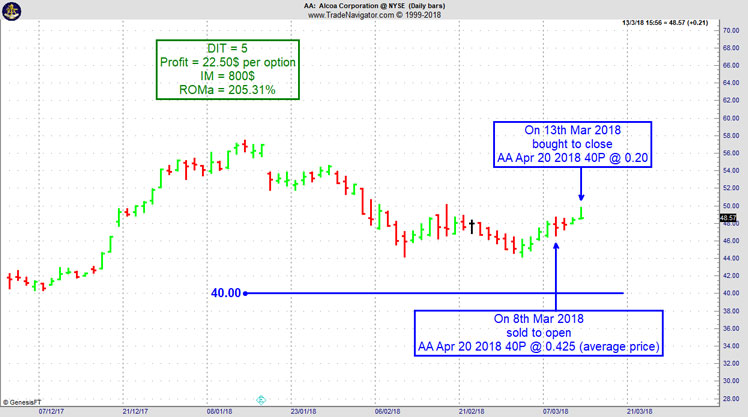
On 7th March 2018 we gave our Instant Income Guaranteed subscribers the following trade on Alcoa Corporation (AA). Price insurance could be sold as follows:
- On 8th March 2018, we sold to open AA Apr 20 2018 40P @ 0.425 (average price), with 42 days until expiration and our short strike about 16% below price action,
- On 13th March 2018, we bought to close AA Apr 20 2018 40P @ 0.20, after 5 days in the trade for quick premium compounding
Profit: 22.50$ per option
Margin: 800$
Return on Margin annualized: 205.31%
Philippe
Receive daily trade recommendations - we do the research for you.
♦ SIGN UP TODAY! THIS IS WORTH THE INVESTMENT ♦
Learn More!
Instant Income Guaranteed
© by Joe Ross and Philippe Gautier. Re-transmission or reproduction of any part of this material is strictly prohibited without the prior written consent of Trading Educators, Inc.
Trading Article - Handling Success
by Master Trader Joe Ross
Author, Trader, Trading Mentor, and Founder of Trading Educators, Inc.
Developer of Instant Income Guaranteed
In his book, "Trading to Win," Dr. Ari Kiev notes, "winning days are often followed by plateaus and losing streaks." Behavioral economist Dr. Terrance Odean observed that novice online investors who had a series of winning trades tended to have periods of overtrading. It's as if they believed they could take more risks, and potentially lose profits, since they had just made more than they expected. If you want to be a profitable trader in the long run, you must learn to keep your profits rather than give them back to the markets.
Why are winning days often followed by plateaus and losing streaks? Loss of focus and concentration is a major reason, according to Dr. Kiev. In the back of their minds, most traders are thinking, "How am I going to find a profitable trading opportunity?"
When you find it, and capitalize on it, you feel relieved. You may wrongly think, "Now I can relax. I can let my guard down." When you relax, you might trade less carefully. You might take lower probability setups because you think you have the luxury of taking risks. Or you may become overconfident and move beyond your risk limits because you are ahead. This is where traders end up giving profits back to the markets. Just because you have a little bit of a winning streak does not mean you can be sloppy and lose focus. It's vital at these times to maintain concentration. Stick with your method, continue to develop trading plans, and follow your trading plan.
A second reason losses may follow winners is that winning takes psychological energy. Winning may feel great, but as you are winning, your adrenalin is pumping. After a big, exciting win, your mind and body just want to relax. When you are worn out, you are prone to make poor decisions or trading errors. The solution to this issue isn't clear.
Dr. Kiev suggests regrouping, and to continue to face the markets in earnest. This may be hard to do for some traders, however. The mind is like a muscle. Once you expend psychological energy, you need rest. It's like playing a championship game. Some players are so prepared mentally and physically that they can play the entire game with ease. For other players, the added stress of a big game wears them down. It's the same with trading. If you are rested up, you can regroup, and continue trading after experiencing big wins. You just need to be aware of your tendency to let your concentration lapse, regroup, and then face the markets with a renewed energy.
Although some traders secretly feel they don't deserve to make profits in the markets, and unconsciously sabotage themselves, for many, it's just a matter of feeling that you need a big reward after the good fight. This reward usually manifests itself as a sloppy, unfocused approach to trading. Be aware of this tendency, so that after you experience winning trades, you will stay focused and maintain your momentum, rather than give profits back to the markets.
© by Joe Ross. Re-transmission or reproduction of any part of this material is strictly prohibited without the prior written consent of Trading Educators, Inc.
To view previous published Chart Scan newsletters, please log in or click on "Join Us,"
shown above, to subscribe to our free "Members Only" section.
A WEALTH OF INFORMATION & EDUCATION:
Joe Ross-Trading Educators' popular free Chart Scan Newsletter has been published since 2004.
Note: Unless otherwise noted, all charts used in Chart Scan commentary were created
by using Genesis Financial Technologies' Trade Navigator (with permission).
Legal Notice and Copyright 2018 Disclaimer - Published by Trading Educators, Inc.
Chart Scan is a complimentary educational newsletter.
© by Trading Educators, Inc. Re-transmission or reproduction of any part of this material is strictly prohibited without prior written consent.
- Short Term Trading
- Futures
Edition 718 - March 16, 2018
Ambush hits new all-time equity highs in 2018!
by Professional Trader Marco Mayer
Educator for Forex, Futures and Systematic Trader
Creator of Ambush Trading Method, Ambush Signals, and Head of AlgoStrats.com
Yes, Ambush did it again as most of the Ambush markets and portfolios just hit new all-time equity highs in March!
Trading has been tough for most traders so far this year, especially due to the crazy correction we had in the stock markets in early February. This lead to higher volatility in many markets mixed with a lot of uncertainty and crazy market moves.
That’s a recipe for disaster for many trading strategies but for Ambush it’s one of the most favorable market conditions. And oh boy did it rally during that period .The Ambush Small Portfolio, for example, showed a performance gain of over 11k within just four weeks of trading!
Thanks to that rally, almost all Ambush markets are now showing nice gains for 2018 and the year just started. To give you a better picture, here’s a chart showing the performance of all Ambush Futures markets (per contract) so far in 2018:
As you can see, only RBOB Gasoline is left with a slightly negative performance and especially the equity indices like the E-Mini S&P 500 (ES) or the E-Mini Russell 2000 (RTY) have been exceptional performers.
Now, this is just a tiny part of the whole Ambush history, so let’s zoom out and have a look at the broader picture. Ambush has been around for almost 10 years now. That’s exceptional for a trading system. Actually, it’s the only one I know that’s been around that long. But as markets tend to change, I do review Ambush once a year to see if any changes are necessary to adapt to changing market conditions. The last time any significant changes have been required was in July 2015. As you can see on the following chart Ambush kept on performing as expected since then in live trading.
You can find out more about the sample portfolios and the long-term performance of each of the Ambush Markets on the Performance Page.
If you missed these first few months of Ambush Trading in 2018, you probably want to get on board now.
Join us and become an Ambush Trader!
The most popular and easiest way to follow Ambush is Ambush Signals. It does all the work for you, allows you to customize what markets you want to see and has a position sizing tool implemented to automatically adjust the positions to your risk preferences.
Each day around 6:30 pm NY Time the Signals are available for you on the Dashboard. You can then place your orders and literally walk away until the next market close! To find out more about the details of Ambush and how Ambush Signals works, have a look at the Ambush Signals Website.
Let’s be realistic. Following any System can be tough, especially in the beginning. It simply needs time to build the confidence needed to make it through inevitable drawdowns. So what if you’re unlucky and don’t catch a good start right away?
I want you to succeed trading Ambush Signals, so here’s something for you that will strongly increase your odds of success and allow you to easily gain the confidence you’ll need to become a long-term profitable Ambush trader.
We offer you 6 months of Ambush Signals for just $499. That’s a saving of $215, giving you almost two months of Ambush Signals for free. As we usually only offer monthly or 3-months subscriptions, this is a very special offer!
These 6 months will allow you to get to know Ambush Signals without too much stress or pressure and to follow it for a long enough time period that it simply won’t that much if you’re lucky and start on Ambush’s best trading month ever or not.
Don’t miss out on this and get your 6 months of Ambush Signals for $499 today!
Click HERE to purchase AMBUSH SIGNALS for 6-MONTHS
Now many of you already have been following Ambush for years now and so you’ve been asking for a long-term subscribers bargain. Here it is. For the first time ever we offer you a whole year of Ambush Signals for $799. That’s a whopping $629 off the regular yearly subscription price, giving you over five months for free!
Click HERE to purchase AMBUSH SIGNALS for 1-YEAR
Ambush eBook
If you’d prefer to rather generate the signals on your own and want to know the exact trading rules of Ambush, you want the Ambush ebook. We also have a very special offer for you then:
Coupon Code for $500 off:
- Ambush eBook: use "ambush500" to get the Ambush eBook $500 off, for $1,299 instead of $1,799.
All special offers are valid only until March 30th. So hurry up and don’t miss out!
Happy Trading!
Marco Mayer
© by Marco Mayer. Re-transmission or reproduction of any part of this material is strictly prohibited without the prior written consent of Trading Educators, Inc.
Chart Scan with Commentary - Trading U.S. Stock Options
by Master Trader Joe Ross
Author, Trader, Trading Mentor, and Founder of Trading Educators, Inc.
Developer of Instant Income Guaranteed
For most of my trading career I have been a seller of Options. I preferred to sell options on futures and have done more than my share of selling options on stocks.
However, for those of you who are afraid to sell options, the following should be of help in buying options.
I suppose many readers of Chart Scan do not trade the U.S. stock markets, but with the option buying method I’m now going to show you, the time differential between the U.S. and anywhere else on earth shouldn’t be a hindrance.
To employ the method, I use weekly charts. I am screening for stocks making 52 week highs. There are a number of websites that will show you stocks making 52 week highs. Look up “stocks making 52 week highs” on your browser and you can find several sources.
The next step is to bring up a weekly chart for every stock making the “New Highs” List. You will consider buying Call options for any stocks you care to trade from the list. If you want to purchase Put options, you can bring up charts from the any “New Lows” list.
I am going to restrict this article to purchasing Calls. Hopefully, there will be a sufficient number of rising stocks to make the article worthwhile. Of course, you can do just the opposite when stocks are falling.
Screening: I use four screens to whittle down the number of stocks I’m willing to consider.
- The stock must be optionable (I am able to determine that by using Genesis Trade Navigator). If you browse for “optionable stocks” you will find additional sources. Again, you will find several sources.
- Volume – Must be at least 400 thousand shares/day.
- Price – Must be between U.S. $50 – U.S. $80. You can go higher in price, but I don’t recommend going lower.
- Visual graphic of the chart.
The reason for choosing stocks between fifty and eighty dollars (or more), is that higher price stocks tend to move more money per share each day than lower priced stocks.
The process I follow is simple: I want to buy the options having at least six weeks but no more than three months until expiration. I want to buy one strike away, but if that strike is very close to the current share price, I want to buy the next strike beyond the closest one. What I want to enjoy is the appreciation in the Delta. If prices move my way, at-the-money options quickly move to 100 Delta and limit my gains. In-the-money options already are at 100 Delta and so I lose the ability to benefit from gains in Delta.
I also need the leverage I can get from out-of-the-money options. If I buy 100 shares of a U.S. $80 stock, I will use up $8,000 in capital. No thanks! I can buy the option at a fraction of the cost. Since these are stocks that have made a 52 week high, I have the benefit of momentum in my favor. I do not need to know anything about the fundamentals of the stock. The truth is, I don’t care who or what the company is or what business they are in. If a relatively high-priced stock is making new highs, there must be a reason—that reason is good enough for me.
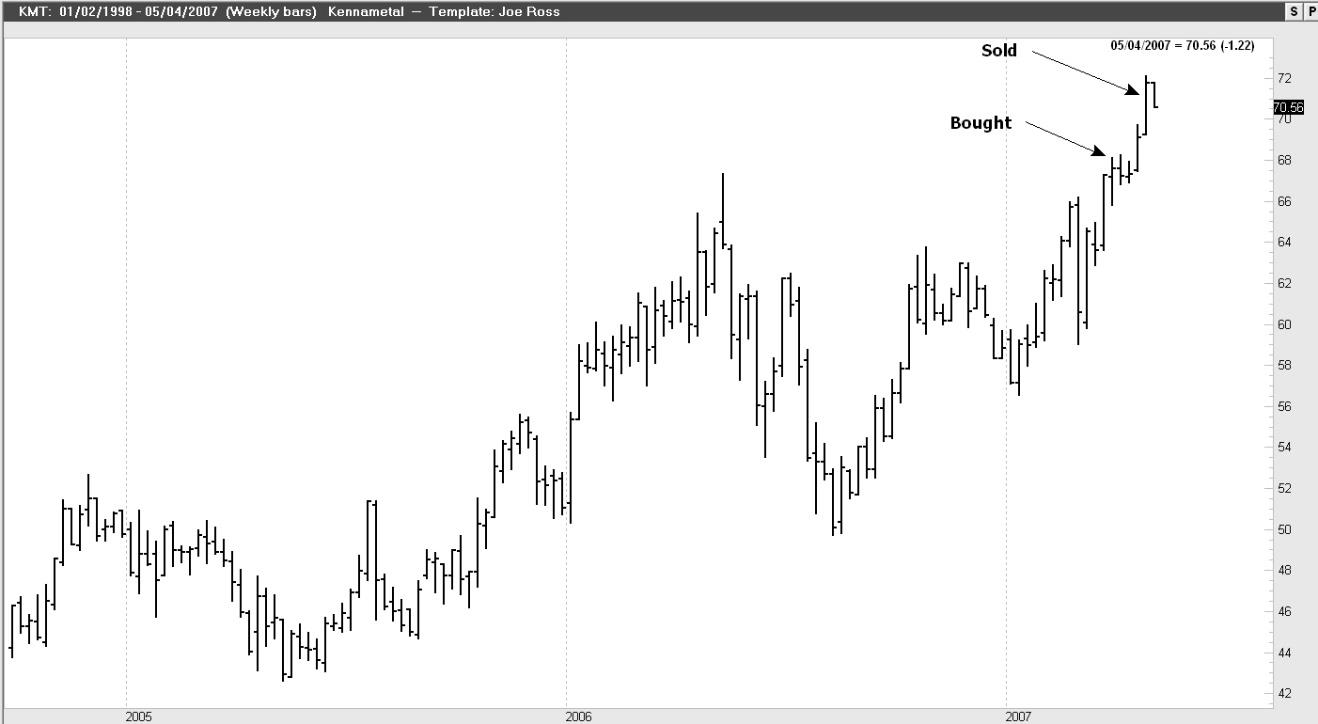
I suppose the most difficult part of the process is the visual part. I will try to describe it and give a couple of examples. I want a stock that has been trending on the weekly chart. Some stocks trend nicely, and when they make a correction (retracement), they rarely go back as far as violating the previous correction. I automatically reject stocks that frequently violate the previous correction.
Let’s look at a couple of historical charts for trades in which I was involved to see what I mean. I save the charts from a lot of trades I made or considered as part of my personal education:
During the week beginning March 26, 2007, with the price for Kennametal (KMT) at $67.40, I bought the May 70 KMT Call for $2.10 and sold it for $4.00 during the week of April 23, 2007, with the price of the stock at $71.00, pocketing a profit of $1.90 per share. Expiration for the Calls was May 18.4.
My increase on a percentage basis was 90.5%. Had I purchased the stock my increase on a percentage basis would have been 5.7%.
Note: The arrows point to the weeks bought and sold, not to the actual prices.
Charts: Courtesy Genesis Financial Data Systems
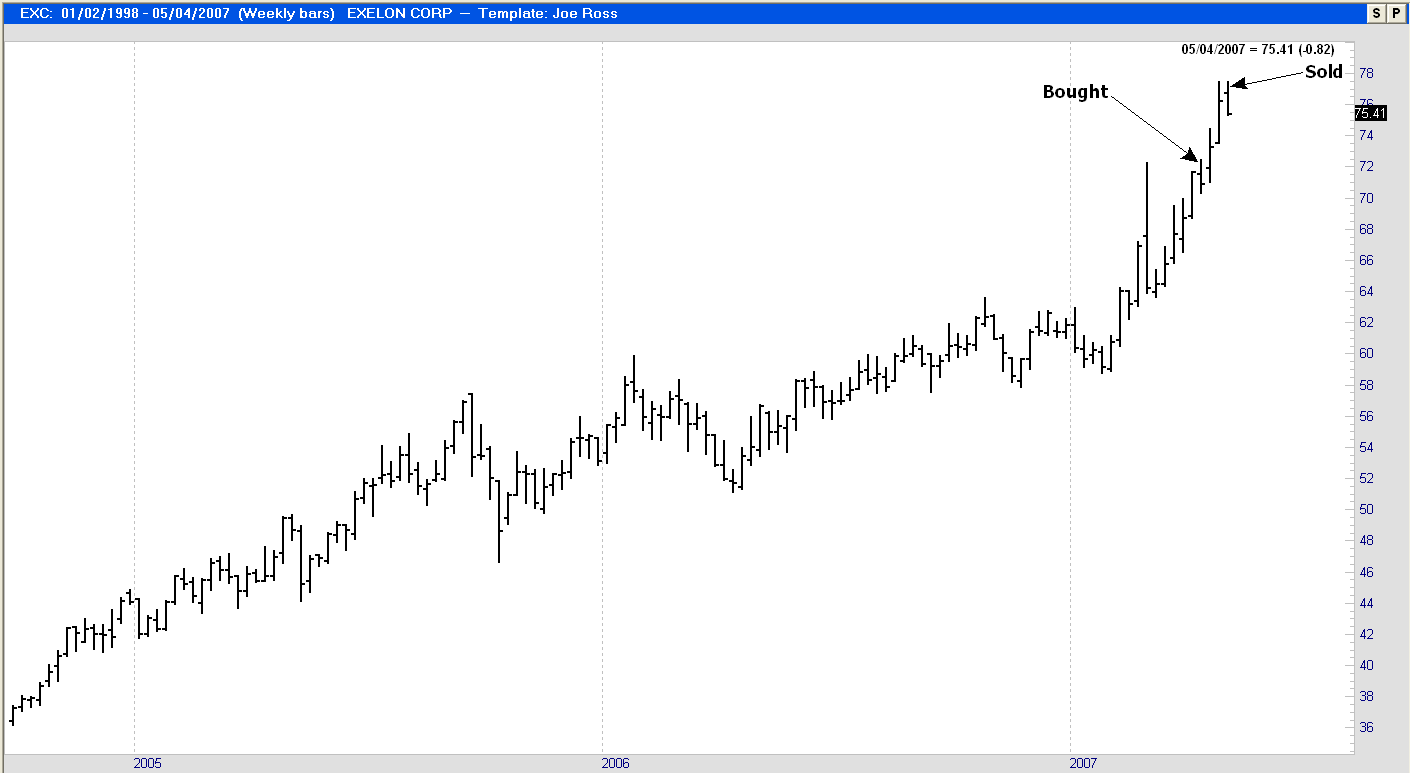
During the week beginning April 9, 2007, with prices for Exelon (EXC) at $72.35, I purchased the 75 Call for a price of $.75 and sold it for $2.60 on April 30, 2007, with the price of the stock at $76.25. The expiration date for the options was May 18.
My increase on a percentage basis was 71.2%%. Had I purchased the stock my increase on a percentage basis would have been 5.1%.
Charts: Courtesy Genesis Financial Data Systems
On April 17, 2007, I purchased the T Rowe Price June 55 Calls for $.25, with the price of the shares at $50.40. Expiration date for the Calls was June 15. Volume was very small, and I may have been the only buyer. I anticipate having trouble selling these options when the time arrives. But over the years I have learned a little trick. If I am having trouble finding a buyer at my price, I simply exercise my option and simultaneously sell short the stock. Since I cannot be both long and short at the same time, I am able to walk away with my profits intact.
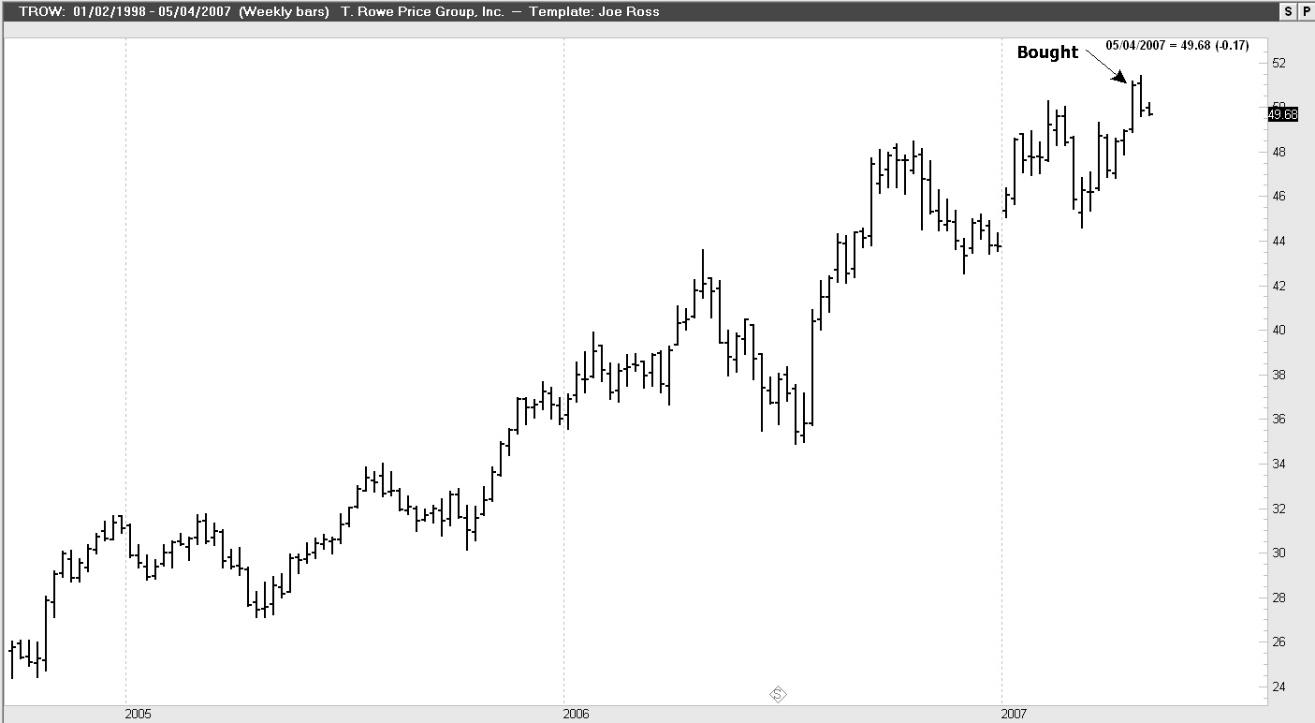
Chart: Courtesy Genesis Financial Data Systems
What might a stock look like when I didn’t want to buy an option for it?
Corn Products International is an optionable stock. But:
- The price is too low.
- It makes multiple violations of previous corrections.
- Quite often it has too little volume.
- Instead of making nice steady trends, it jerks up and down.
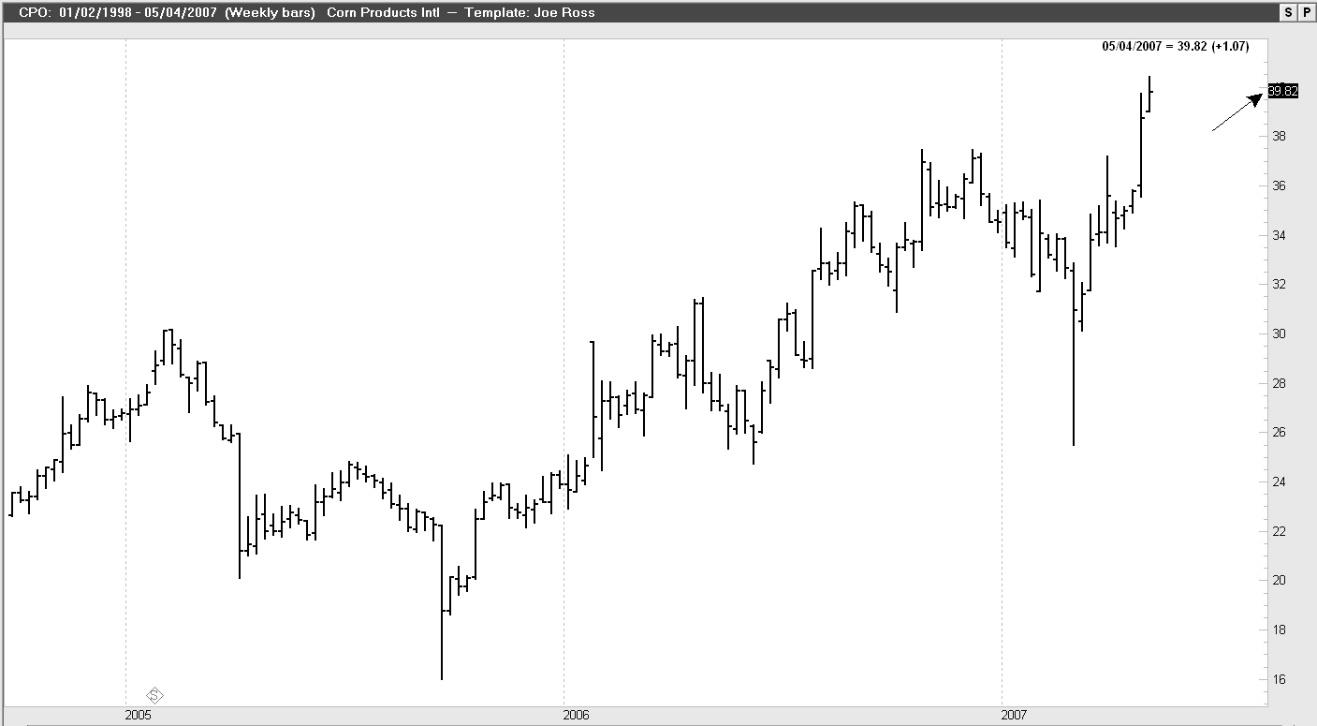
Chart: Courtesy Genesis Financial Data Systems
It takes a bit of work to dig out the best stocks for which to purchase options. However, there are stocks making new 52 week highs, just about every day. You have to carefully screen these stocks hitting new highs, however the reward has been well worth the effort.
Interestingly, using similar parameters, you can achieve a great deal of success selling put options on stocks. Our “Instant Income Guaranteed (IIG)” program is now in its 3rd year without sustaining a loss. Can you name any advisory that can match that record? Follow this link for more information about Instant Income Guaranteeed.
© by Joe Ross. Re-transmission or reproduction of any part of this material is strictly prohibited without the prior written consent of Trading Educators, Inc.
Trading Article - Take Advantage of New Market Opportunities
by Master Trader Joe Ross
Author, Trader, Trading Mentor, and Founder of Trading Educators, Inc.
Developer of Instant Income Guaranteed
Something is usually going up when something else is going down. Therefore, good trading times may be just ahead. Are you ready? It's times like these when the right mental edge can make all the difference. If you want to take advantage of trading opportunities for the New Year, it's vital that you approach trading with the proper mindset. Be ready to work hard and do whatever it takes to come out a winner.
Unfortunately, many traders aren't up to the challenge. They don't have the proper mindset. They don't have rock-solid confidence, and when they see a high probability setup, they flinch, make a trading error, and end up with a losing trade. When market conditions are ideal, you must be ready to take advantage of them. Often, self-reproach is the biggest culprit. Many traders are ready to criticize their own actions.
Some traders take setbacks in stride. Nothing seems to faze them. Why? They know how to put any setback into the proper perspective; they readily think, "It's just business. It says nothing about me."
After years of experience, they've seen it all, lived through it all, and have learned that the markets are ultimately in control, and so there's no reason to get unnecessarily upset about the uncertainty of it all.
Other traders, however, secretly fear that the markets will expose their inadequacies. Deep down, they believe they will eventually fail. A little voice in the back of their mind tells them so. This little voice isn't correct, helpful, or accurate, but it has a subtle impact on the trader's every move. These thoughts usually happen just below our awareness level.
Such thinking patterns are automatic thoughts. An event happens, such as the market going against you, and you 'automatically' think, "The truth is out, I can't keep trading profitably." The old saying, "I think, therefore I am," is apt here. If you think you can't keep up your trading performance, you won't be able to. You'll start believing your little voice that tells you that you can't trade. And you will find that even a minor trading error will upset you.
How do you defeat the little voice? Write down your automatic thoughts after they happen, and analyze them. Break them down, refute them, and convince yourself that they just aren't true. For example, if you face a trading setback and think, "This setback shows that I'm not a natural-born trader; I might as well give up," you will actually feel like giving up. This automatic thought is inaccurate, however. When you look at it more closely, you can see that it is not true. First, setbacks happen to all traders. Setbacks should be expected. By thinking they are rare and significant, you are exaggerating their importance. You are "magnifying" the event into something bigger than it really is. A setback may reflect poor market conditions, and it may even reflect a lack of experience on your part to deal with a particular set of market conditions, but it is not so meaningful that it is a "sign" that you are not a "natural-born trader." Keep things in proper perspective.
No one really knows what the future will hold. There is virtually always something that affords the opportunity to make profits. Don't sabotage your efforts through self-doubt and unreasonable self-criticism. You can trade profitably if you put in the time and effort. Think optimistically, work hard, and take home the profits!
© by Joe Ross. Re-transmission or reproduction of any part of this material is strictly prohibited without the prior written consent of Trading Educators, Inc.
Trading Example: Instant Income Guaranteed
Philippe Gautier: Administration and New Developments
Developer: Joe Ross
TRADE WITH NO LOSSES
Here's our latest example!
ADM Trade
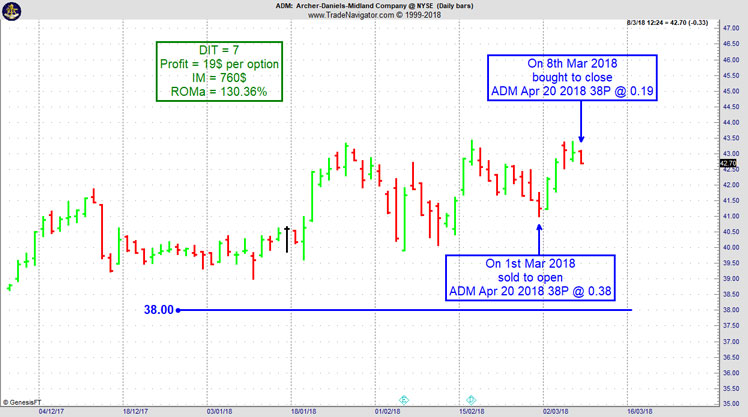
On 22nd February 2018 we gave our Instant Income Guaranteed subscribers the following trade on Archer-Daniels-Midland Company (ADM). Price insurance could be sold as follows:
- On 1st March 2018, we sold to open ADM Apr 20 2018 38P @ 0.38, with 49 days until expiration and our short strike about 8% below price action,
- On 8th March 2018, we bought to close ADM Apr 20 2018 38P @ 0.19, after 7 days in the trade for quick premium compounding.
Profit: 19$ per option
Margin: 760$
Return on Margin annualized: 130.36%
Philippe
Receive daily trade recommendations - we do the research for you.
♦ SIGN UP TODAY! THIS IS WORTH THE INVESTMENT ♦
Learn More!
Instant Income Guaranteed
© by Joe Ross and Philippe Gautier. Re-transmission or reproduction of any part of this material is strictly prohibited without the prior written consent of Trading Educators, Inc.
Blog Post - Pride Goes Before a Fall
by Professional Trader Andy Jordan
Educator for Spreads, Options, Swing/Day Trading, and
Editor of Traders Notebook Complete and Traders Notebook Outrights
To be a winning trader you cannot be overly proud...read more!
Andy Jordan is the editor for Traders Notebook which shows you Futures Trading Strategies in Spreads, Options, and Swing Trades. Learn step-by-step how to trade successfully.
Click Here for Valuable Information about Traders Notebook
© by Andy Jordan. Re-transmission or reproduction of any part of this material is strictly prohibited without the prior written consent of Trading Educators, Inc.
To view previous published Chart Scan newsletters, please log in or click on "Join Us,"
shown above, to subscribe to our free "Members Only" section.
A WEALTH OF INFORMATION & EDUCATION:
Joe Ross-Trading Educators' popular free Chart Scan Newsletter has been published since 2004.
Note: Unless otherwise noted, all charts used in Chart Scan commentary were created
by using Genesis Financial Technologies' Trade Navigator (with permission).
Legal Notice and Copyright 2018 Disclaimer - Published by Trading Educators, Inc.
Chart Scan is a complimentary educational newsletter.
© by Trading Educators, Inc. Re-transmission or reproduction of any part of this material is strictly prohibited without prior written consent.
- Short Term Trading
- Futures
Edition 717 - March 9, 2018
Chart Scan with Commentary - Trading Strategies
by Master Trader Joe Ross
Author, Trader, Trading Mentor, and Founder of Trading Educators, Inc.
Developer of Instant Income Guaranteed
There are countless trading strategies available for all markets. Whether you trade stocks, forex, futures, or CFDs, there are one or more trading strategies that will fit your risk tolerance and trading style.
Most important is to first know and understand your personal risk tolerance. This is an absolute “must´ decision for every trader, a decision you have to make before you ever attempt to use any of the available trading strategies.
What exactly would put you out of the trading business, in the event things went against you? How much risk can you handle emotionally, psychologically, and financially? What would completely demoralize you, and cause you to give up trading? If you haven’t figured that out, then stop right now—get your thoughts together—and make that all-important decision before you ever attempt to use any of the possible trading strategies.
Once you have determined your personal risk tolerance, you are ready for the next step—matching the strategy, market, and time frame to your risk tolerance. You must discard any of the trading strategies that do not match up.
Let’s look at an example of matching trading strategies to personal risk tolerance.
Let’s assume you want to make a trade in gold. You can make this trade in the futures market, via an ETF in the stock market, or using a CFD. The CFD could possibly be used to trade either futures or shares in an ETF.
After assessing your personal risk tolerance you decide all you can handle is a $1,000 loss.
In futures, if you trade 5 contracts, and lose $200 per contract it would amount to a $1,000 loss overall. Four lots would equal $800. Two lots would equal $400. If you are trading something other than futures, decide how many shares it would take to equal the amount you are willing to lose, if the price per share should happen to drop.
Next, let’s take one strategy of the many trading strategies available. One strategy available to us we call “gimmee bars.” Gimmee bars overall yield 80% winning trades if traded properly. A gimmee bar is a reversal bar that touches or exceeds 2-Standard Deviations from a moving average of the Closes. A reversal bar is one that opens and closes opposite to the direction prices were moving
 Using a 20 bar moving average and 2-Standard Deviations, we can set up a study called “Bollinger Bands” to determine an entry point and the amount of risk we would have to take.
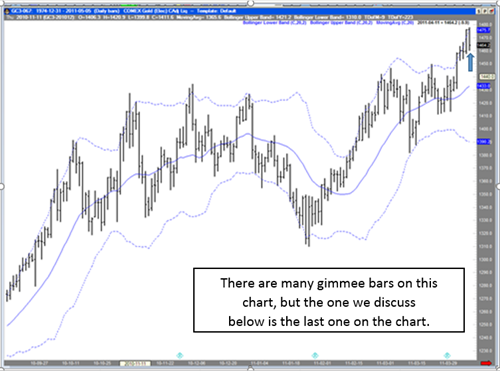
The chart we’re looking at is a daily chart of gold on April 12. The arrow on the chart points to a Gimmee Bar. Gimmee Bars are one of the oldest, and most reliable trading strategies around. Prices had been rising, had reached the upper Bollinger Band, and had reversed direction by closing lower than it had opened.
How do we calculate the risk?
The upper band was at 1475.70. The moving average was at 1433.10. The difference was 42.7 points. A point in gold futures is $100. The risk was $4,270 of volatility between the moving average and the upper Bollinger Band. As a rule, we risk only half the volatility when making a trade. Still $2,135 is too much to risk if our risk tolerance is $1,000. The risk on the daily gold chart is too great. We cannot handle even one contract. We are unable to match our risk tolerance to the risk in the market.
We now have to make a choice:
- Find another market to trade using this trading strategy.
- Move to a lower time frame in gold if we want to use this strategy.
- Use another of the trading strategies that may be available to us.
Let’s say in this example we move to a lower time frame. We’ll try to find the same thing happening on or closely following April 12 on a 60-minute chart.
At 9AM on April 12, prices touch the upper Bollinger Band and then reverse.
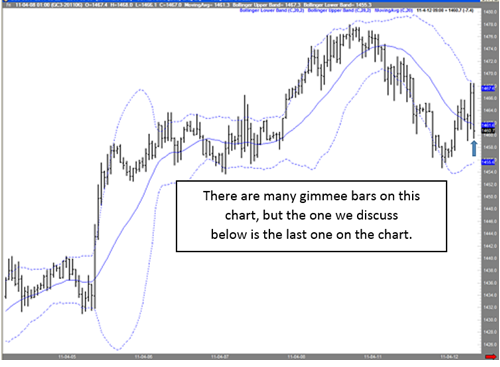
The upper band is at 1467.60 and the moving average is at 1461.60. The volatility between the upper band and the moving average is 6 points, or $600. Half of that amount is $300. The strategy calls for us to sell on the next bar at the low price of the gimmee bar. We can sell 3 contracts, risking $300 per contract, and still be within our personal risk tolerance. We have successfully matched our personal risk tolerance to the risk in the market. At the same time, we have positioned-sized the trade to 3 contracts, risking $900 in all.
Any one of the many trading strategies available to traders can be used following the principle of matching personal risk tolerance to the amount of risk in the market.
© by Joe Ross. Re-transmission or reproduction of any part of this material is strictly prohibited without the prior written consent of Trading Educators, Inc.
Trading Example: Instant Income Guaranteed
Philippe Gautier: Administration and New Developments
Developer: Joe Ross
TRADE WITH NO LOSSES
Here's our latest example!
WDC Trade
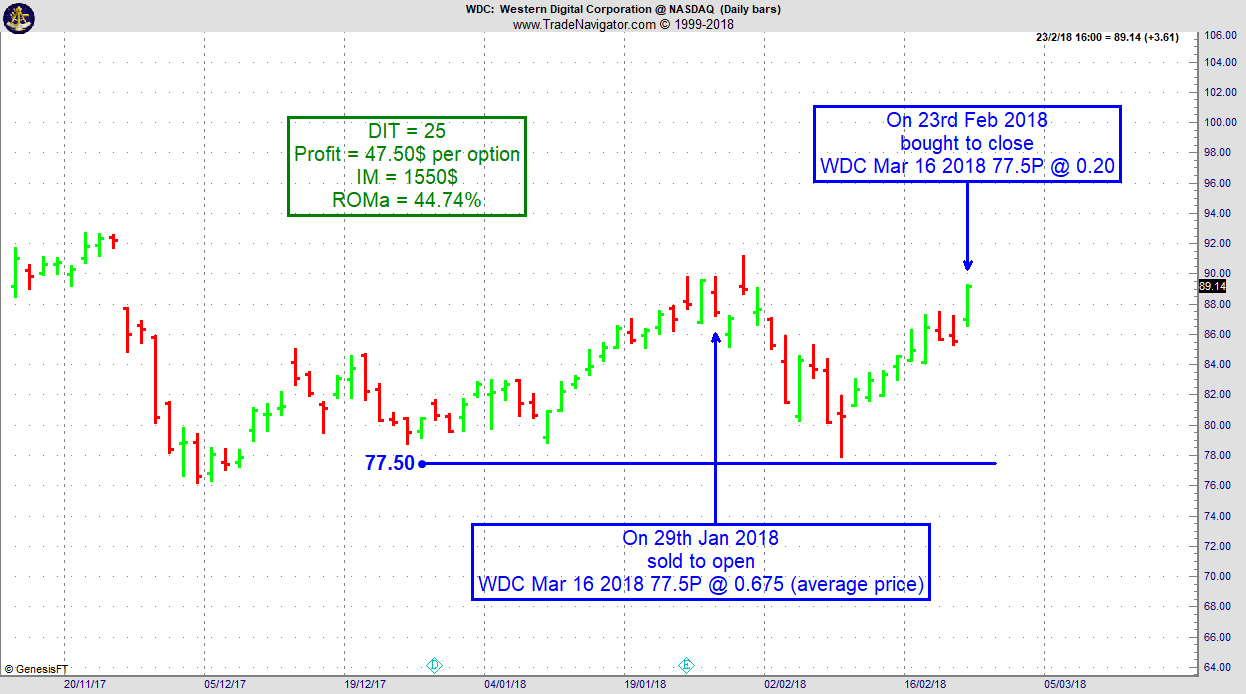
Here is another recent example where, when the put short strike is carefully chosen, we can withstand a sharp downside correction without any trouble. On 28th January 2018 we gave our Instant Income Guaranteed subscribers the following trade on Western Digital Corporation (WDC). Price insurance could be sold as follows:
- On 29th January 2018, we sold to open WDC Mar 16 2018 77.5P @ 0.675 (average price), with 47 days until expiration and our short strike about 14% below price action,
- On 23rd February 2018, we bought to close WDC Mar 16 2018 77.5P @ 0.20, after 25 days in the trade; our short strike was never challenged during the sharp market correction, we only had to stay a little longer in the trade to close it.
Profit: 47.50$ per option
Margin: 1550$
Return on Margin annualized: 44.74%
Philippe
Receive daily trade recommendations - we do the research for you.
♦ SIGN UP TODAY! THIS IS WORTH THE INVESTMENT ♦
Learn More!
Instant Income Guaranteed
© by Joe Ross and Philippe Gautier. Re-transmission or reproduction of any part of this material is strictly prohibited without the prior written consent of Trading Educators, Inc.
Blog Post - Mounting Losses
by Professional Trader Andy Jordan
Educator for Spreads, Options, Swing/Day Trading, and
Editor of Traders Notebook Complete and Traders Notebook Outrights
Find out three things you can do to avoid mounting losses...read more.
Andy Jordan is the editor for Traders Notebook which shows you Futures Trading Strategies in Spreads, Options, and Swing Trades. Learn step-by-step how to trade successfully.
Click Here for Valuable Information about Traders Notebook
© by Andy Jordan. Re-transmission or reproduction of any part of this material is strictly prohibited without the prior written consent of Trading Educators, Inc.
Trading Article - Finding big market moves: BarStrength Indicator
by Professional Trader Marco Mayer
Educator for Forex and Futures, Systematic Trader, and
Creator of Ambush Trading Method, Ambush Signals, and AlgoStrats.com
I’d like to share an indicator I came up with that I found very useful over the years. It’s actually a very simple one but it proved itself against over and over again against much more complicated indicators that try to do the same thing. I surely wouldn’t want to miss it.
Here’s the formula: abs(open-close) / (high-low) * 100
Which gives us a value between 0 and 100 that measures the actual price change of a single price bar (absolute value of open-close) against the whole price bars range (high-low). Or in Candlestick charting language: measures the size of the candle body against the whole candle including the wicks.
Let’s look at a price chart to make this more clear:
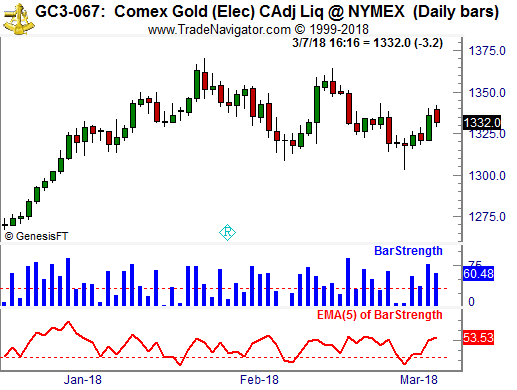
The blue bars are showing the Daily BarStrength of Gold for each of the price bars/candles. Below you can find a 5 period EMA of that BarStrength. Notice that huge green candles that open nearby the low and close nearby the high show a high BarStrength score (50+) while candles that close near the open have a very low score.
So what you might wonder. Well here’s the interesting part: Notice that quite often you’ll get a strong price bar/candle after a weak one and the other way around. To highlight this I’ve plotted a horizontal line at 33.
The same is true on a larger scale looking at the moving average below. When it’s showing low values, meaning there’s been hardly any real price change in Gold for a couple of days, there’s a tendency for big moves to happen afterward.
I’ve found this to be true in many markets, Gold is just an example. While this works in principle on any timeframe, it’s most effective on higher timeframes like daily and weekly charts.
The BarStrength indicator doesn’t show you in which direction the market will move. But knowing when a market is more likely to make a big move than not can make a really huge difference in your trading results. This is why I like to use this as a filter for breakout strategies, like ORB (opening range breakout) strategies for example.
Feel free to email Marco Mayer with any questions, This email address is being protected from spambots. You need JavaScript enabled to view it..
Happy Trading!
Marco
© by Marco Mayer. Re-transmission or reproduction of any part of this material is strictly prohibited without the prior written consent of Trading Educators, Inc.
To view previous published Chart Scan newsletters, please log in or click on "Join Us,"
shown above, to subscribe to our free "Members Only" section.
A WEALTH OF INFORMATION & EDUCATION:
Joe Ross-Trading Educators' popular free Chart Scan Newsletter has been published since 2004.
Note: Unless otherwise noted, all charts used in Chart Scan commentary were created
by using Genesis Financial Technologies' Trade Navigator (with permission).
Legal Notice and Copyright 2018 Disclaimer - Published by Trading Educators, Inc.
Chart Scan is a complimentary educational newsletter.
© by Trading Educators, Inc. Re-transmission or reproduction of any part of this material is strictly prohibited without prior written consent.









