- Short Term Trading
- Futures
Edition 735 - July 13, 2018

by Master Trader Joe Ross
Author, Trader, Trading Mentor, and Founder of Trading Educators, Inc.
Developer of Instant Income Guaranteed
Chart Scan with Commentary: Commodity Characteristics
Could Crude Oil hit $86/bbl?
If you look at a daily chart, it seems pretty far away. But....
If you look at a weekly chart of Crude Oil futures, you realize it's no big thing for prices to hit that high – especially if the economy continues in an inflationary mode.

The strange thing about commodities is that commodity prices are determined by commodity prices.
When commodity prices are high, it drives producers and users to find alternatives. Demand drops, and eventually, commodity prices drop. High prices bring in more supply, and before you know it you have too few dollars chasing too much supply.
The opposite is true as well. When commodity prices are low, supply drops off, eventually resulting in short supply. Demand increases as producers and users drop alternative sources in favor of less expensive sources. At some point, you have too many dollars chasing too little supply.
After many years of hearing about peak oil, it may come as a shock that all sort of new supply is coming into play. Some huge new discoveries have been made, and technology will soon bring even more oil online. We are far, far away from running out of oil.
So, while $85/bbl is entirely possible, so, too, is $45/bbl for Crude Oil.
© by Joe Ross. Re-transmission or reproduction of any part of this material is strictly prohibited without the prior written consent of Trading Educators, Inc.
by Master Trader Joe Ross
Author, Trader, Trading Mentor, and Founder of Trading Educators, Inc.
Developer of Instant Income Guaranteed
Trading Article: It Takes Guts
Short-term winning traders have guts. They have to. No one has a crystal ball. You can guess what the markets will do, but you can never know what will happen with complete certainty. Only the traders who risk enough money, and make enough winning trades can hope to achieve glory. And living under these conditions takes guts.
Trading can be about 90% market psychology. Do fundamentals play a role? Sure they do, but mass psychology can play a bigger role at times. Consider a current news headline: ZZZ Company recently announced that it was doubling its second-quarter loss to $254 million. What can you do with this information? It's hard to know. On the one hand, you might anticipate the stock price to fall as sales continue to decline and pension costs plague an already vulnerable company. On the other hand, the stock price may be at a bottom, and ready to rise at the slightest news of prosperity. In the end, no one (besides insiders) will know for sure what will happen in the next few weeks or months.
What can a trader do? You have to take a risk and think optimistically. Rather than mull over how much money you may lose on a trade, it's useful to put the trade in perspective. It's merely one trade among many. Think of the bigger picture. You may lose on a single trade, but across a series of trades you will come out ahead overall. By risking only a small percentage of your capital on a single trade, you can allow yourself to feel at ease, and calmly assess where any given trade is going. You can nonchalantly close the trade when it isn't going well, or let it ride when it is winning. Successful traders plan on executing many trades and know that not all trades need to be winners in order to increase the equity in their accounts. It's your success overall that counts. Keeping this in mind takes some of the pressure off, and allows you to go from trade to trade in order to allow the law of averages to work in your favor.
Although thoughtful and astute analysis of a company and its stock performance is vital, trading can also be a matter of chance. It may be impossible to anticipate the outcome of any single trade. However, with a large enough number of trades and a trading approach that has a high chance of producing wins, you can expect to come out ahead if you make enough trades.
Although trading involves chance and risk taking, you should not draw the conclusion that winning traders are reckless. They aren't. They approach trading systematically. They develop clearly defined trading plans and they trade them. They wait for market conditions that increase their odds of success. But most of all, they have a positive attitude. They know that if they do their homework and make enough trades, they will take home a profit. There are no guarantees, but if you work hard, and have the guts to take a risk, you will experience the glory of trading like a winner.
© by Joe Ross. Re-transmission or reproduction of any part of this material is strictly prohibited without the prior written consent of Trading Educators, Inc.

by Philippe Guartier: Administration and New Developments
Developer: Joe Ross
Trading Example: Instant Income Guaranteed
PCG Trade
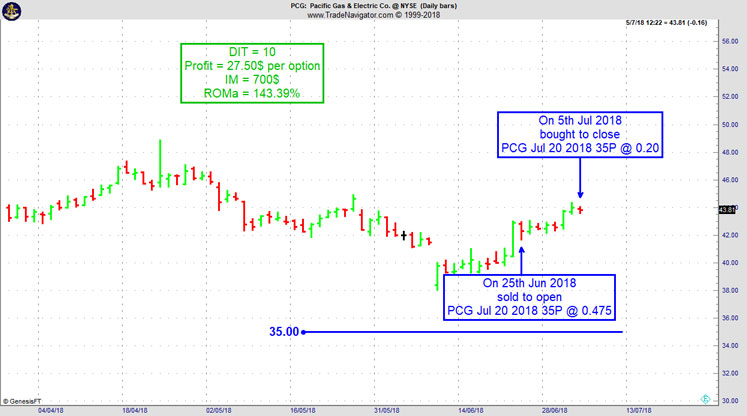
On 24th Jun 2018 we gave our Instant Income Guaranteed subscribers the following trade on Pacific Gas & Electric Co (PCG), after the breakout of the point 2 of a 123 Low. Price insurance could be sold as follows:
-
On 25th Jun 2018, we sold to open PCG Jul 20 2018 35P @ 0.475 (average price), with 25 days until expiration and our short strike about 18% below price action.
-
On 5th July 2018, we bought to close PCG Jul 20 2018 35P @ 0.20, after 10 days in the trade for quick premium compounding.
Profit: 27.50$ per option
Margin: 700$
Return on Margin annualized: 143.39%
Philippe
Receive daily trade recommendations - we do the research for you.
♦ SIGN UP TODAY! THIS IS WORTH THE INVESTMENT ♦
Learn More!
Instant Income Guaranteed
© by Joe Ross and Philippe Gautier. Re-transmission or reproduction of any part of this material is strictly prohibited without the prior written consent of Trading Educators, Inc.

by Professional Trader Andy Jordan
Educator for Spreads, Options, Swing, Day Trading, and
Editor of Traders Notebook Complete
Trading Article: Fear in Trading
For some traders it is imperative that they run scared. For those traders it is the emotion of fear that can generate the concentration necessary to survive.
Trading is a stressful business. In other fields we see constant demonstrations of performing under stress. It is the ability to thrive under stress that sets athletic superstars apart. It is the ability to go on stage when your stomach is full of butterflies that can make a stage performer into a star.
An effective trader learns to handle stress. His natural instinct of self-preservation is what makes him effective when challenged.
There are other forms of stress besides fear. Selfishness can cause a trader to fight in greedily for what he thinks he must have. Such a trader will trade without any consideration for personal honesty. His attitude is get what you want. Win somehow.
As a trader you must find out who you are and learn to accept yourself that way.
Regardless of the source of your stress, if you are going to trade effectively, you must face the cause of it and learn to deal with it.
Many successes in your trading,
Andy Jordan
© by Andy Jordan. Re-transmission or reproduction of any part of this material is strictly prohibited without the prior written consent of Trading Educators, Inc.

by Professional Trader Marco Mayer
Educator for Forex, Futures and Systematic Trader
Creator of Ambush Trading Method, Ambush Signals, and Head of AlgoStrats.com
Trading Example: Ambush Traders catch stock traders with a bull trap twice for big profits!
The Ambush trading method is specialized in catching intraday market tops and bottoms in a variety of Futures markets. Including the Russell 2000 mini Future (RTY) traded at the CME, where Ambush Traders are having a really nice time lately.
Ambush day trades on an end-of-day basis so there’s no need to even check the markets during the day.
Like many other stock indices, the Russell 2000 approached the June highs again this week, very close to the price level where Ambush traders sold the RTY for a $1k profit per contract. And guess what happened this time? Ambush had another sell signal very close to the last one at 1712 points which turned out to be very close to the high of the day. And like last time it turned out to be another bull trap handing us almost another $1k profit, closing the trade at 1693.5!
Is it always like that? Of course not, but if you’ve been on the other sides of these trades you maybe should think about switching sides!

Here’s the result of all of the trades shown on the chart, trading one Russell 2000 mini (RTY) contract, including $10 commissions per trade.

Let’s face it, you don’t want to be on the one caught on the other side of these trades. Also if you’re actively day trading by getting in and out of the market all day long, honestly ask yourself if that’s worth your time? And are you actually doing better than this? With Ambush you’re day trading without even having to be there during the day!
Join us and become an Ambush Trader!
The most popular and easiest way to follow Ambush is Ambush Signals. It does all the work for you, allows you to customize what markets you want to see and has a position sizing tool implemented to automatically adjust the positions to your risk preferences. Learn More about Ambush Signals!
If you’d prefer to rather generate the signals on your own and want to know the exact trading rules of Ambush, you want the Ambush eBook.
Happy Trading!
Marco
Feel free to email Marco with your trading questions, This email address is being protected from spambots. You need JavaScript enabled to view it..
© by Marco Mayer. Re-transmission or reproduction of any part of this material is strictly prohibited without the prior written consent of Trading Educators, Inc.
Check out our Blog!
To view previous published Chart Scan newsletters, please log in or click on "Join Us,"
shown above, to subscribe to our free "Members Only" section.
A WEALTH OF INFORMATION & EDUCATION:
Joe Ross-Trading Educators' popular free Chart Scan Newsletter has been published since 2004.
Note: Unless otherwise noted, all charts used in Chart Scan commentary were created
by using Genesis Financial Technologies' Trade Navigator (with permission).
Legal Notice and Copyright 2018 Disclaimer - Published by Trading Educators, Inc.
Chart Scan is a complimentary educational newsletter.
© by Trading Educators, Inc. Re-transmission or reproduction of any part of this material is strictly prohibited without prior written consent.
- Short Term Trading
- Futures
Edition 734 - July 6, 2018
by Master Trader Joe Ross
Author, Trader, Trading Mentor, and Founder of Trading Educators, Inc.
Developer of Instant Income Guaranteed
Chart Scan with Commentary: Trade What You See
If you are a student of The Law of Charts, you understand that what drives prices in any market are the actions and reactions of traders to the movement of price. Last week, when I began writing Chart Scan, I saw reversing action in the Canadian dollar.
What was causing that reverse action? Part of it was due to profit-taking by traders who were long and benefitted from the recent run-up in the C$. Part of what I saw was the result of selling action by the Central Bank of Canada. The Canadians have become concerned about the rising C$, which makes their exports less competitive. One other possibility is in the picture, and hints that possibly I was seeing the end of to the carry trade.
With possibilities abounding, what is a trader to do? My solution to the problem never changes — trade what you see.
As I looked at a daily chart of the C$, I could see some significant things taking place. There was no need to guess. The first clue was when C$ futures soared to 0.8168, but gave back much of what it had gained by Closing at 0.81255. That kind of giving back is strongly suggestive of an impending reversal. Sure enough, two days later, more evidence of reversal appeared as an outside, long bar (OB) down with a Close much lower than the Open.

When I see that kind of situation, I am ready to sell short. In my private tutoring sessions, I teach traders to do exactly that, because there are no fewer than two strong signals to go short staring them right in the face. However, even if you don't recognize those signals, a simple reading of the chart is all you need to recognize that the upward momentum has, at least temporarily, been lost.
© by Joe Ross. Re-transmission or reproduction of any part of this material is strictly prohibited without the prior written consent of Trading Educators, Inc.
by Master Trader Joe Ross
Author, Trader, Trading Mentor, and Founder of Trading Educators, Inc.
Developer of Instant Income Guaranteed
Trading Article: Self-Control
You're in the midst of a perfect trade. You entered where you had planned, and you know when to exit. All you have to do now is wait for the price to reach 53 and sell. But it's not moving fast enough. It seems to be hovering around 51 and 50. You're starting to wonder whether or not it will ever move up. Panic sets in and you sell. About an hour later, the price hits 53 and it now seems obvious that you should have waited. Why didn't you wait? Why did you impulsively sell? If you have trouble maintaining self-control, you're not alone. It's a common ailment.
It's quite possible to have a trading plan all worked out, but fail to follow it. When you plan out the trade in a logical state of mind, you have every intention of following it. You know exactly what you will do and when. At a critical moment of trading, however, something in your inner self goes awry. When you should be especially focused on sticking with your plan, you abandon it. Why did you make such an impulsive decision that you may regret later? Some traders feel that everything happens so quickly that there is very little they can do. To some extent they are right. Your mind and body tend to react so instinctively that you can't slow things down and stop yourself from making an impulsive decision. However, you can practice slowing down the processes that precede an impulsive move. You may not realize it, but every action you take is preceded by thoughts. You have an internal dialog with yourself as you trade; it's sort of like having a conversation with yourself.
What you say in this dialog dictates how you feel and how you act. For example, if you tell yourself, "The price isn't moving the way I want. It never does, and I'm a fool for believing that it will," you will obviously feel uncertain, frustrated, and ready to close out your position. In contrast, if you think, "The price isn't where I would like it to be, but it's too soon to tell what will happen in the end. I need to relax, trust my trading plan and see if it comes to fruition," you will be more likely to stay disciplined and stick with your plan. It may seem obvious that what you say to yourself will dictate how you feel and act, but many people underestimate the power of the internal dialog. They don't realize that thoughts can pop into their head at the wrong moment and seriously impact what they do. If you are not keenly aware of what you are thinking as you trade, you are prone to fall victim to your unproductive thoughts. It is vital to monitor your thoughts, and when you enter a trade, maintain your self-control.
© by Joe Ross. Re-transmission or reproduction of any part of this material is strictly prohibited without the prior written consent of Trading Educators, Inc.
by Philippe Guartier: Administration and New Developments
Developer: Joe Ross
Trading Example: Instant Income Guaranteed
PE Trade
On 12th Jun 2018 we gave our Instant Income Guaranteed subscribers the following trade on Parsley Energy Inc. (PE). Price insurance could be sold as follows:
- On 13th & 14th Jun 2018, we sold to open PE Jul 20 2018 25P @ 0.275 (average price), with 38 days until expiration and our short strike about 13% below price action.
- On 26th June 2018, we bought to close PE Jul 20 2018 25P @ 0.10, after 13 days in the trade for quick premium compounding.
Profit: 17.50$ per option
Margin: 200$
Return on Margin annualized: 98.27%
Philippe

Receive daily trade recommendations - we do the research for you.
♦ SIGN UP TODAY! THIS IS WORTH THE INVESTMENT ♦
Learn More!
Instant Income Guaranteed
© by Joe Ross and Philippe Gautier. Re-transmission or reproduction of any part of this material is strictly prohibited without the prior written consent of Trading Educators, Inc.
by Professional Trader Andy Jordan
Educator for Spreads, Options, Swing, Day Trading, and
Editor of Traders Notebook Complete
Trading Article: Part 2 - What's my real reason for trading?
Last week we talked about the real reasons for trading and what our hidden goals are. I've received a couple of emails asking me if I can name a few of these hidden goals.
There are numerous motives, but here are just a few to help you get the idea:
- There are those with a deep-rooted belief that things always go wrong and good things never happen to them. They have a wish to confirm this fact to themselves (trading works wonderful for this).
- There is the individual who feels deeply insecure and is looking for something to raise his self-esteem and self-worth.
- There is the trader who believes in creating memorable, flourishing triumphs to be remembered by everyone.
- There is the person who uses trading in the same way people use punching bags – to get rid of the day's frustration. And there is the person who uses himself as a punching bag, employing trading to do the damage.
- There are those who are simply hooked on the adrenaline of the action.
It ought to be stressed that none of these hidden motives are illegal, evil, or bad. They may be exactly what someone wants out of trading. But the problem is, not very many of these motives have any relation to the task at hand ─ trading with the discipline necessary to win consistently.
Andy Jordan is the editor for Traders Notebook which shows you Futures Trading Strategies in Spreads, Options, and Swing Trades. Learn step-by-step how to trade successfully.
Many successes in your trading,
Andy Jordan
© by Andy Jordan. Re-transmission or reproduction of any part of this material is strictly prohibited without the prior written consent of Trading Educators, Inc.
by Professional Trader Marco Mayer
Educator for Forex, Futures and Systematic Trader
Creator of Ambush Trading Method, Ambush Signals, and Head of AlgoStrats.com
Trading Example: Profitably trading the Dollar Index in uncertain Times!
The Ambush trading method is specialized in catching intraday market tops and bottoms in a variety of Futures markets. Including the Dollar Index Future (DX) traded at the ICE, where Ambush Traders are having a really nice time lately.
Ambush day trades on an end-of-day basis so there’s no need to even check the markets during the day.
Due to the uncertainty in the US moving towards a potential trade war, the Dollar Index has been tough to trade lately. While it has been somewhat moving higher it did so in a very unsteady way with a lot of sideways action in between, see this daily chart of the DX:

Luckily, Ambush has no trouble at all in such markets and so Ambush Traders had a really good time trading DX during the last two months! As you can see we had a lot of trades at the tops and bottoms of these trading ranges, whether they’re small or a bit more expanding.
Where’s the Dollar Index going next? For sure to either the top or the bottom of the trading range it’s in. As Ambush Traders we don’t mind, we’ll be there ready to sell to or buy from the novice traders who’ll then accelerate our profits as they got to get out of their next losing trade.
Here’s the result of these trades, trading one Dollar Index (DX) contract, including $10 commissions per trade. Yes that’s a win rate of over 83% and a profit factor of 9!

Is it always like that? Of course not, but if you’ve been on the other sides of these trades you maybe should think about switching sides!
Join us and become an Ambush Trader!
The most popular and easiest way to follow Ambush is Ambush Signals. It does all the work for you, allows you to customize what markets you want to see and has a position sizing tool implemented to automatically adjust the positions to your risk preferences. Learn More about Ambush Signals!
If you’d prefer to rather generate the signals on your own and want to know the exact trading rules of Ambush, you want the Ambush eBook.
Happy Trading!
Marco
Feel free to email Marco with your trading questions, This email address is being protected from spambots. You need JavaScript enabled to view it..
© by Marco Mayer. Re-transmission or reproduction of any part of this material is strictly prohibited without the prior written consent of Trading Educators, Inc.
Check out our Blog!
To view previous published Chart Scan newsletters, please log in or click on "Join Us,"
shown above, to subscribe to our free "Members Only" section.
A WEALTH OF INFORMATION & EDUCATION:
Joe Ross-Trading Educators' popular free Chart Scan Newsletter has been published since 2004.
Note: Unless otherwise noted, all charts used in Chart Scan commentary were created
by using Genesis Financial Technologies' Trade Navigator (with permission).
Legal Notice and Copyright 2018 Disclaimer - Published by Trading Educators, Inc.
Chart Scan is a complimentary educational newsletter.
© by Trading Educators, Inc. Re-transmission or reproduction of any part of this material is strictly prohibited without prior written consent.
- Short Term Trading
- Futures
Edition 733 - June 29, 2018
by Master Trader Joe Ross
Author, Trader, Trading Mentor, and Founder of Trading Educators, Inc.
Developer of Instant Income Guaranteed
Chart Scan with Commentary - Traders Trick
Question: Would entry 1 tick below the low of the bar labeled as TTE be valid?
The answer is "perhaps!" The definition of a valid Traders Trick Entry is that there be enough room between the point of entry and the point of the Ross hook for the trader to be able to cover costs and take a profit. But does the Traders Trick on the chart below meet that condition? Most assuredly yes, if we are looking at a weekly or monthly chart. Possibly, if we are looking at a daily chart. But would it be a valid TTE on a 1-, 3-, or even a 5-minute chart? Hardly likely at all.
My point here is that a chart is a chart, is a chart. The Law of Charts states that all price charts reflecting markets make certain formations as humans emotionally respond to the movement of prices.
So what's the difference? The difference is in the magnitude of move that can be expected. For the TTE to work, there must be sufficient room for you to be able to cover costs and take a profit.
A TTE 1 tick below the low of the #3 bar might have worked on one of the lesser time frames. I happen to know a person who lost $45,000 because he could not see what I just explained to you!

© by Joe Ross. Re-transmission or reproduction of any part of this material is strictly prohibited without the prior written consent of Trading Educators, Inc.
by Master Trader Joe Ross
Author, Trader, Trading Mentor, and Founder of Trading Educators, Inc.
Developer of Instant Income Guaranteed
Trading Article - Timely Exit
What is your tolerance for pain? Consider the following scenario. You have 10% of your account balance on the line. For the past two days, prices have been going in the direction you had anticipated, but today, an announcement was made that caused a market move that caused all your profits to be wiped out in an hour. What will you do? See if prices will move back to where you are okay again? At times like these, it is useful to have a clearly defined trading plan with a specific exit strategy.
Trading is inherently uncertain. You never know exactly what will happen next. That’s what makes the business exciting to some traders but nerve wracking to others. How you handle adverse events that make prices move against you depends on your personality. The best way to protect your capital is to use protective stops. When formulating your trading plan, you must decide how much pain you can tolerate. How much money can you lose before you have to exit the trade? You can set this exit point as a formal stop loss, you can use the automatic settings on your trading platform to set a stop, or you can use a mental stop (not recommended).
The problem with a formal stop loss procedure, whether it is a formal order or an automatic setting on your trading platform, is that a transitory change in price can ‘stop you out.’ if the placement of your stop loss does not adequately account for volatility. It’s hard to know how far a stock may move and a temporary drop can ruin your trading plan when a protective stop is not set properly. Mental stops may be more useful, but you run the risk of not being able to exercise your mental stop (think heart attack, nervous breakdown, stroke, personal emergency, computer failure, etc.). You can decide how far a stock price must move against you before you will liquidate the position. When prices reach the exit point, you can decide whether the low price is transitory or represents a significant change in trend. You can then exit the trade.
This all sounds good in theory, but depending on your personality, you may not be able to carry out this strategy. If you have trouble controlling your emotions and you use a mental stop, for example, you may have trouble closing the trade when it reaches your exit point. Some people panic and out of fear don’t close their position when their mental stop is reached. These people may need to impose the proper amount of discipline on their trading actions by using an electronic stop or a formal stop-loss order.
Minimizing trading losses is the hallmark of successful trading, but not all traders are equal when it comes to their ability to trade decisively under strain. If you want to trade profitably, you have to work around your personality. If you are cool headed, disciplined, and are willing to take the risk even under the most stressful conditions, you can use mental stops to protect your capital. But if you are easily shaken by choppy market action, you might want to use electronic, automatic stops to protect yourself. Whatever you do, however, minimize losses as much as possible. It’s the only way to trade profitably in the long run.
© by Joe Ross. Re-transmission or reproduction of any part of this material is strictly prohibited without the prior written consent of Trading Educators, Inc.
by Philippe Guartier: Administration and New Developments
Developer: Joe Ross
Trading Example: Instant Income Guaranteed
FCX Trade
On 23rd May 2018 we gave our Instant Income Guaranteed subscribers the following trade on Freeport-McMoran Copper & Gold (FCX). Price insurance could be sold as follows:
- On 29th May 2018, on a GTC order , we sold to open FCX Jul 20 2018 14P @ 0.14, with 51 days until expiration and our short strike about 16% below price action.
- On 6th June 2018, we bought to close FCX Jul 20 2018 14P @ 0.07, after only 8 days in the trade for quick premium compounding.
Profit: 7$ per option
Margin: 280$
Return on Margin annualized: 114.06%
Philippe

Receive daily trade recommendations - we do the research for you.
♦ SIGN UP TODAY! THIS IS WORTH THE INVESTMENT ♦
Learn More!
Instant Income Guaranteed
© by Joe Ross and Philippe Gautier. Re-transmission or reproduction of any part of this material is strictly prohibited without the prior written consent of Trading Educators, Inc.
by Professional Trader Andy Jordan
Educator for Spreads, Options, Swing, Day Trading, and
Editor of Traders Notebook Complete
Trading Idea
This week, we're looking at 500*GFU18 – 400* LEG19: long September 2018 Feeder Cattle and short February 2018 Live Cattle (CME on Globex).

Today we consider a meat inter-market equity spread: long September 2018 Feeder Cattle and short February 201 Live Cattle trading at the CME on Globex. The spread is swinging widely so far this year but has found support at approx. $27,000 several times so far. As long this level holds, we might see another swing to the up-side. Looking for a low-risk entry will be key on this trade because volatility and therefore risk is high. Please note: To alleviate the problem in spreads wherein tick values are not equal, one can convert the price of each contract into an equity value for each contract. Therefore, we multiply the Feeder Cattle by 500 and the Live Cattle by 400.
Andy Jordan is the editor for Traders Notebook which shows you Futures Trading Strategies in Spreads, Options, and Swing Trades. Learn step-by-step how to trade successfully.
Click Here for Valuable Information about Traders Notebook
© by Andy Jordan. Re-transmission or reproduction of any part of this material is strictly prohibited without the prior written consent of Trading Educators, Inc.
by Professional Trader Marco Mayer
Educator for Forex, Futures and Systematic Trader
Creator of Ambush Trading Method, Ambush Signals, and Head of AlgoStrats.com
Trading Blog - Don’t get married to a market!
There are so many different instruments to trade like stocks, bonds, futures, spot forex, options and so on. And even when you decide to get into futures, there are tons of futures out there! So where to even start? I was as confused as anyone else about this when I started trading.
That's why it probably feels good to focus on just one market in the beginning. "I just trade the EUR/USD" or "I only trade the ES" or "I'm a Gold trader" are common statements out there. And that's not a bad thing. It's almost impossible to start otherwise, you have to over simplify things in the beginning. Otherwise, you'd never get started trading at all.
But at some point, you should move on and expand your trading world. There are times when it's almost impossible to make a profit in the EUR/USD or when it's better to stay away from the ES. During these times maybe Gold or Crude Oil or AUD/USD are providing really good trading opportunities.
Especially as a day trader, you got to go where the action is. I've seen many traders going under because they kept on trying to milk a dead cow. That's why recognizing when it's time to look elsewhere is one of the most important skills to survive in the long term.
Don't get married to a single market, don't keep on throwing good money after bad just to prove to your ego that you can get the money back from that market. Be flexible, go where the easy buck is.
There's almost always a low hanging fruit…and usually, you know where it is. You're just too stubborn to take it.
Happy Trading!
Marco
Feel free to email Marco with your trading questions, This email address is being protected from spambots. You need JavaScript enabled to view it..
© by Marco Mayer. Re-transmission or reproduction of any part of this material is strictly prohibited without the prior written consent of Trading Educators, Inc.
Check out our Blog!
To view previous published Chart Scan newsletters, please log in or click on "Join Us,"
shown above, to subscribe to our free "Members Only" section.
A WEALTH OF INFORMATION & EDUCATION:
Joe Ross-Trading Educators' popular free Chart Scan Newsletter has been published since 2004.
Note: Unless otherwise noted, all charts used in Chart Scan commentary were created
by using Genesis Financial Technologies' Trade Navigator (with permission).
Legal Notice and Copyright 2018 Disclaimer - Published by Trading Educators, Inc.
Chart Scan is a complimentary educational newsletter.
© by Trading Educators, Inc. Re-transmission or reproduction of any part of this material is strictly prohibited without prior written consent.
- Short Term Trading
- Futures
Edition 732 - June 22, 2018
by Professional Trader Andy Jordan
Educator for Spreads, Options, Swing, Day Trading, and
Editor of Traders Notebook Complete
Trading Article - Staying on the “Sideline”
Don't get irritated or angered because you haven't put on a new trade in a long time. Whenever there is nothing to trade, don't trade. Accept it and stay on the “sideline." There will be an attempt by the “trading gods” to wear you down by giving you bad markets over and over, and for extended periods of time. This will happen, and it will happen on numerous, often successive occasions. Know this ahead of time so you are mentally prepared for it when it happens.
Just because you haven't entered a new trade for a long time doesn't mean its time to trade. Some traders think there is some kind of invisible statute of limitations on being passive. After two weeks, you've paid your dues and you've proven that you are a disciplined trader. So now you've earned the right to trade again, right? Unfortunately, this is not the case, and you have to stay on the sideline until a good trade shows up.
Andy Jordan is the editor for Traders Notebook which shows you Futures Trading Strategies in Spreads, Options, and Swing Trades. Learn step-by-step how to trade successfully.
Click Here for Valuable Information about Traders Notebook
© by Andy Jordan. Re-transmission or reproduction of any part of this material is strictly prohibited without the prior written consent of Trading Educators, Inc.
by Professional Trader Marco Mayer
Educator for Forex, Futures and Systematic Trader
Creator of Ambush Trading Method, Ambush Signals, and Head of AlgoStrats.com
Trading Example - Natural Gas Bulls got trapped badly by Ambush Traders
The Ambush trading method is specialized in catching intraday market tops and bottoms in a variety of Futures markets. Including the Natural Gas Future (NG) traded at the NYMEX, where Ambush Traders are having an amazing run lately.
Ambush day trades on an end-of-day basis so there’s no need to even check the markets during the day.
In Natural Gas the Bulls and breakout traders got trapped badly on Monday buying like crazy into the market at a price premium. This caused the market to open with an up gap above Friday’s close. Ambush Traders already had their order in to sell and sold right to those novice buyers.
That open turned out to be pretty much the high of the day and the bulls trapped in their long positions quickly got to realize they’ve been on the wrong side of the market that day. While Ambush Traders started to count their profits they had to get out of their long positions as quickly as they got in and Natural Gas closed about 100 ticks lower near the low of the day:

What’s going to happen next in NG? Well we’re back in our trading range now again and looking forward to the next Ambush Trade! The profit rally for Ambush Traders has been going on for a while now as you can see below even though this Monday we got the biggest fish so far:

Here’s the result of these trades, trading one NG contract, including $10 commissions per trade. Yes, that’s over $3600 trading just one contract!
Don’t miss the next trade and become an Ambush Trader!
The most popular and easiest way to follow Ambush is Ambush Signals. It does all the work for you, allows you to customize what markets you want to see and has a position sizing tool implemented to automatically adjust the positions to your risk preferences. Learn More about Ambush Signals.
If you’d prefer to rather generate the signals on your own and want to know the exact trading rules of Ambush, you want the Ambush eBook.
Happy Trading!
Marco Mayer
Feel free to email Marco with your trading questions, This email address is being protected from spambots. You need JavaScript enabled to view it..
© by Marco Mayer. Re-transmission or reproduction of any part of this material is strictly prohibited without the prior written consent of Trading Educators, Inc.
by Master Trader Joe Ross
Author, Trader, Trading Mentor, and Founder of Trading Educators, Inc.
Developer of Instant Income Guaranteed
Chart Scan with Commentary - Trend?
Someone sent me the not so beautiful chart you see below. However, it doesn’t matter about what it is or how it looks. There is a lesson to be learned, and I want to show you how I evaluate such a situation.

The question associated with this chart is: Do we have a clue as to which way prices will break out?
I think we do, so look closely to see why I think that. We have 1-2-3 formations in both directions in what appears to be a market with rising prices. Some people call such a market a “rising wedge” or “rising triangle.: That’s because of the way I drew a trendline. However, I could have just as easily drawn horizontal lines indicating that prices were moving sideways.

In the above situation, I favor the direction of the previous trend, which is “up.” Does it matter where I drew the trendline? I don’t think so. Who is to say where to draw it, or whether or not I should have drawn it. Where people draw lines is a matter of opinion. Yours is as good as mine. Basically, I drew a trendline rather than enveloping the sideways consolidation with horizontal lines, because my bias was toward the rising market. I wanted to show direction, not a geometrically perfect trendline. By the way, what is a geometrically perfect trend line?
© by Joe Ross. Re-transmission or reproduction of any part of this material is strictly prohibited without the prior written consent of Trading Educators, Inc.
by Master Trader Joe Ross
Author, Trader, Trading Mentor, and Founder of Trading Educators, Inc.
Developer of Instant Income Guaranteed
Trading Article - Overconfidence
How should a trader deal with “overconfidence?” Maybe a better question about confidence--trading and otherwise--is not why people are overconfident to begin with, but why they stay overconfident. You see, the problem with overconfidence is not the innate bias toward optimism that most people seem to possess. That’s a good thing it keeps the world moving forward.
The problem is the inability to temper optimism as a result of prior experience. The truth is, we don’t learn well enough from our mistakes. Consider this: If overconfidence is as big a problem as some say it is, it should be a short-term problem at worst. The learning process would ideally go something like this: “We think highly of ourselves, the world and events show us who the boss really is, and we become less confident and more realistic about our knowledge and skills.” Yet usually, this does not happen. Why? It seems to me that what we face as traders is that we fail to mix confidence with caution. It is when we are on a hot winning streak that we begin to think of ourselves and our trading as invincible. I can’t count the number of times I have seen traders make a few nice sized wins and then watched them drift into a state of euphoria thinking to themselves: “At last, I’ve found ‘the’ way to trade. They actually become giddy. They are so happy with themselves. But as the book of Proverbs so clearly states: “Pride goes before a fall.” Overconfidence leads to pride, even as far as arrogance. It is then when a trader must rein himself in and put up the wall of caution. When you are overconfident, you are ripe for a major setback in the market.
© by Joe Ross. Re-transmission or reproduction of any part of this material is strictly prohibited without the prior written consent of Trading Educators, Inc.
by Philippe Guartier: Administration and New Developments
Developer: Joe Ross
Trading Example: Instant Income Guaranteed
BBY Trade
On 4th June 2018 we gave our Instant Income Guaranteed subscribers the following trade on Best Buy Co Inc. (BBY). Price insurance could be sold as follows:
- On 5th Jun 2018, , we sold to open BBY Jul 20 2018 62.5P @ 0.53, with 45 days until expiration and our short strike about 11% below price action.
- On 11th June 2018, we bought to close BBY Jul 20 2018 62.5P @ 0.20, after only 6 days in the trade for quick premium compounding
Profit: 33$ per option
Margin: 1250$
Return on Margin annualized: 160.60%
Philippe

Receive daily trade recommendations - we do the research for you.
♦ SIGN UP TODAY! THIS IS WORTH THE INVESTMENT ♦
Learn More!
Instant Income Guaranteed
© by Joe Ross and Philippe Gautier. Re-transmission or reproduction of any part of this material is strictly prohibited without the prior written consent of Trading Educators, Inc.
Check out our Blog!
To view previous published Chart Scan newsletters, please log in or click on "Join Us,"
shown above, to subscribe to our free "Members Only" section.
A WEALTH OF INFORMATION & EDUCATION:
Joe Ross-Trading Educators' popular free Chart Scan Newsletter has been published since 2004.
Note: Unless otherwise noted, all charts used in Chart Scan commentary were created
by using Genesis Financial Technologies' Trade Navigator (with permission).
Legal Notice and Copyright 2018 Disclaimer - Published by Trading Educators, Inc.
Chart Scan is a complimentary educational newsletter.
© by Trading Educators, Inc. Re-transmission or reproduction of any part of this material is strictly prohibited without prior written consent.
- Short Term Trading
- Futures
Edition 731 - June 15, 2018
HAPPY FATHER'S DAY!
Use Coupon Code During Checkout!
dad10
(excludes Private Mentoring and 1-Month Traders Notebook)
by Master Trader Joe Ross
Author, Trader, Trading Mentor, and Founder of Trading Educators, Inc.
Developer of Instant Income Guaranteed
Chart Scan with Commentary - Lesson from the Past -- NQ

It’s truly amazing how much the price of the Nasdaq Mini has changed over the years. We are looking at the e-mini Nasdaq from 2004, shown a 30-minute chart. The reason I chose this chart was because I want to show that regardless of time frame and date, a chart is a chart. The only thing that really changes over the years is how you manage what you see. As long as human beings trade a market, human emotional reaction to the movement of price will cause certain patterns to form. In this case we had a 1-2-3 high formation followed by an opportunity to enter, which we call a Traders Trick Entry.
As you can see, prices formed a 1-2-3 high. I’ve shown you my entry point using the Traders Trick Entry.
Prices moved from my entry at 1501 to as low as 1492. Even using a 50% trailing stop, you could have made 4.5 points.
In my online day trading seminar, I show you how to select a market, a time frame, and how to manage your trades. Follow this link to learn more about the seminar:
If you are not using The Law of Charts™ and the Traders Trick Entry to take profits out of the market, you are missing out on a lot.
There is a logical way to choose a market and time frame for trading. There is a logical and structured way to determine trading objectives and stop placement.
Using The Law of Charts you can even know when to expect a trend to end. We hope you will come to find out our structured and disciplined way to trade.
© by Joe Ross. Re-transmission or reproduction of any part of this material is strictly prohibited without the prior written consent of Trading Educators, Inc.
by Master Trader Joe Ross
Author, Trader, Trading Mentor, and Founder of Trading Educators, Inc.
Developer of Instant Income Guaranteed
Trading Article - Confidence
When it comes to trading the markets, nothing is certain. How do you cope with uncertainty? Many traders are overconfident. Rather than face the possibility of losses due to market uncertainty, they fool themselves into thinking they are omnipotent. Behavioral economists Brad Barber and Terrance Odean illustrated how novice traders are especially overconfident. They analyzed account records from a large sample of online investors. Overconfident investors showed this ailment after a large windfall. They put on substantially more trades than other investors, yet achieved few rewards for their efforts. By putting on significantly more trades, they paid more in commissions, which in turn resulted in overall lower account balances. Clearly, overconfidence has a price. Are you willing to pay it?
Tom a seasoned trader told me, "Every time I have issues with confidence, I become overconfident. I try to be very humble when I trade. You're only as good as your last trade. It doesn't matter what you did last month, last year, or the last ten years, it's what are you doing today." But Tom does not lack confidence. He may get beaten down, but he doesn't stay down for very long: "I get worried or depressed for a very short period of time. Rather than dwell on it, I immediately shift my focus and think, 'Okay, fine, let's see how we can get out of this?' What's done is done."
Although overconfidence can lead to risky trades that may produce losses occasionally, a lack of confidence can be even more detrimental. It's probably not a good idea to be optimistic to the point of putting on trades without carefully managing risk, such as limiting the size of a position or using protective stops, but a moderate amount of optimism and confidence is useful.
Pessimists often panic, become fearful, and tenaciously deny they are in a losing trade. A moderate amount of optimism keeps a trader calm and inquisitive. Even in the midst of a losing trade, an optimist may be more likely to seek out information and make an informed decision. Finding the proper level of confidence is key. It is a little like walking a tightrope between extreme unrealistic optimism and extreme debilitating pessimism. Finding the right balance will allow you to pick yourself up when you are beaten down.
The winning trader is both confident and realistic. If you want to trade like a winner, you need to develop a true sense of self-confidence. By gaining a wealth of experience, your confidence will be based on your actual trading skills. When you know what you can do and what you can't, you'll feel calm and self-assured. You'll know what you can handle, and you will be able to trade with solid, realistic confidence.
© by Joe Ross. Re-transmission or reproduction of any part of this material is strictly prohibited without the prior written consent of Trading Educators, Inc.
by Philippe Guartier: Administration and New Developments
Developer: Joe Ross
Trading Example: Instant Income Guaranteed
ANDE Trade
On 25th May 2018 we gave our Instant Income Guaranteed subscribers the following trade on The Andersons Inc. (ANDE). Price insurance could be sold as follows:
- On 29th May 2018, , we sold to open ANDE Jul 20 2018 30P @ 0.30, with 51 days until expiration and our short strike about 9% below price action
- On 4th June 2018, we bought to close ANDE Jul 20 2018 30P @ 0.15, after only 6 days in the trade for quick premium compounding
Profit: 15$ per option
Margin: 600$
Return on Margin annualized: 152.08%
Philippe

Receive daily trade recommendations - we do the research for you.
♦ SIGN UP TODAY! THIS IS WORTH THE INVESTMENT ♦
Learn More!
Instant Income Guaranteed
© by Joe Ross and Philippe Gautier. Re-transmission or reproduction of any part of this material is strictly prohibited without the prior written consent of Trading Educators, Inc.
by Professional Trader Andy Jordan
Educator for Spreads, Options, Swing, Day Trading, and
Editor of Traders Notebook Complete
Trading Article - What's my real reason for trading?
"The Rorschach test (also known as the Rorschach inkblot test, the Rorschach technique, or simply the inkblot test) is a test in which a subject's perceptions of inkblots are recorded and then analyzed using psychological interpretation, complex scientifically derived algorithms, or both. Some psychologists use this test to examine a person's personality characteristics and emotional functioning." (Copied from Wikipedia)
Trading is a kind of a Rorschach test, mirroring the personality of the trader's needs and desires. We need to ask ourselves "What is my real reason for trading?" because whatever our underlying motives are, they will show up while trading. Pursuing these hidden goals will negatively affect our trading. Not knowing why they exist may cause us to wonder why certain things keep happening over and over. Finding out the real motives behind why we want to trade will help us to understand why we do certain things, and will help us to become better traders.
Andy Jordan is the editor for Traders Notebook which shows you Futures Trading Strategies in Spreads, Options, and Swing Trades. Learn step-by-step how to trade successfully.
Click Here for Valuable Information about Traders Notebook
© by Andy Jordan. Re-transmission or reproduction of any part of this material is strictly prohibited without the prior written consent of Trading Educators, Inc.
by Professional Trader Marco Mayer
Educator for Forex, Futures and Systematic Trader
Creator of Ambush Trading Method, Ambush Signals, and Head of AlgoStrats.com
The right mindset to deal with drawdowns
Drawdowns are an unavoidable fact in trading that's tough to deal with. But you probably already noticed that and might have encountered some of the serious issues this can lead to during your trading career. Maybe you tend to stop trading a system or switch systems always at the wrong time. Or worse. But as I've written about these issues before, here's a mindset that has helped me a lot to deal with drawdowns in the long run.
Things got a lot easier for me once I started to treat trading a system or just following a specific trading plan or strategy like an investment. Let me explain.
Let's say you believe in the success and growth of a certain company, Apple for example. Therefore you decide to invest a certain amount of money in it and buy the stock. You get in at $100. Right after you bought the price of the stock goes down to $95. You're down 5% and probably a little bit disappointed about your bad timing. If you're sane that's where you stop worrying. You won't start questioning your investment because the price of the stock dropped $5. You still believe in the company, nothing fundamental changed so you just keep your stocks. A year later Apple trades at $140 and you're quite happy but it might have been a volatile journey up to $135 during the year. Again though that's no big issue as you expect this. Stock prices can be volatile and you don't expect them to move higher in a straight line!
Why not apply the same mindset to trading a system? Take a certain amount of money and invest it into the strategy. As long as you believe in the strategy and the drawdown is within what you expect, why worry? Just keep on trading it, stop worrying about the daily ups and down and questioning it on every little drawdown. Of course, if something fundamental changes or you hit unexpected drawdowns you act. But otherwise, it really helps to treat it like an investment, leave it alone and let it do its thing.
Happy Trading!
Marco
© by Marco Mayer. Re-transmission or reproduction of any part of this material is strictly prohibited without the prior written consent of Trading Educators, Inc.
Check out our Blog!
To view previous published Chart Scan newsletters, please log in or click on "Join Us,"
shown above, to subscribe to our free "Members Only" section.
A WEALTH OF INFORMATION & EDUCATION:
Joe Ross-Trading Educators' popular free Chart Scan Newsletter has been published since 2004.
Note: Unless otherwise noted, all charts used in Chart Scan commentary were created
by using Genesis Financial Technologies' Trade Navigator (with permission).
Legal Notice and Copyright 2018 Disclaimer - Published by Trading Educators, Inc.
Chart Scan is a complimentary educational newsletter.
© by Trading Educators, Inc. Re-transmission or reproduction of any part of this material is strictly prohibited without prior written consent.









