
Edition 719 - March 23, 2018


Trading Idea - Cotton (yeah, the white fluffy stuff!)
by Professional Trader Andy Jordan
Educator for Spreads, Options, Swing/Day Trading, and
Editor of Traders Notebook Complete
This week, we're looking at Cotton (ICE), especially at the December 2018 contract. As you can see on the chart below, the December Cotton is usually turning to the down-side in April (looking at the blue 15 year seasonal chart) or early May (looking at the last 5 years, red line on the chart below).
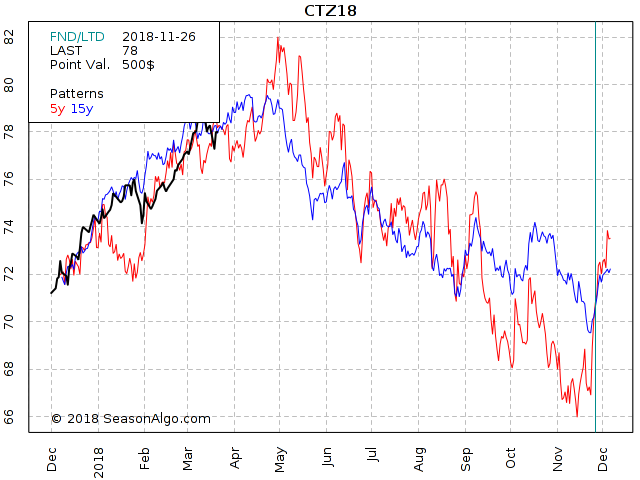
In addition to the seasonal factor, the Commercials are extremely net short and as we know, they are usually (not always) on the correct side of the market long term. Considering also the long up move from November 2017 until now, the chances are high that we see a lower market during the next few months.
December is still far away and therefore it might make sense to scale into a short call position during the next few weeks or even next 2 months using far out of the money calls.

Andy Jordan is the editor for Traders Notebook which shows you Futures Trading Strategies in Spreads, Options, and Swing Trades. Learn step-by-step how to trade successfully.
Click Here for Valuable Information about Traders Notebook
© by Andy Jordan. Re-transmission or reproduction of any part of this material is strictly prohibited without the prior written consent of Trading Educators, Inc.

Huge savings that don't want to pass you by, offer expires March 30th
by Professional Trader Marco Mayer
Educator for Forex, Futures and Systematic Trader
Creator of Ambush Trading Method, Ambush Signals, and Head of AlgoStrats.com
Ambush hits new all-time equity highs in 2018!
Yes, Ambush did it again as most of the Ambush markets and portfolios just hit new all-time equity highs in March!
Trading has been tough for most traders so far this year, especially due to the crazy correction we had in the stock markets in early February. This lead to higher volatility in many markets mixed with a lot of uncertainty and crazy market moves.
That’s a recipe for disaster for many trading strategies but for Ambush it’s one of the most favorable market conditions. And oh boy did it rally during that period .The Ambush Small Portfolio, for example, showed a performance gain of over 11k within just four weeks of trading!
Thanks to that rally, almost all Ambush markets are now showing nice gains for 2018 and the year just started. To give you a better picture, here’s a chart showing the performance of all Ambush Futures markets (per contract) so far in 2018:

As you can see, only RBOB Gasoline is left with a slightly negative performance and especially the equity indices like the E-Mini S&P 500 (ES) or the E-Mini Russell 2000 (RTY) have been exceptional performers.
Now, this is just a tiny part of the whole Ambush history, so let’s zoom out and have a look at the broader picture. Ambush has been around for almost 10 years now. That’s exceptional for a trading system. Actually, it’s the only one I know that’s been around that long. But as markets tend to change, I do review Ambush once a year to see if any changes are necessary to adapt to changing market conditions. The last time any significant changes have been required was in July 2015. As you can see on the following chart Ambush kept on performing as expected since then in live trading.

You can find out more about the sample portfolios and the long-term performance of each of the Ambush Markets on the Performance Page.
If you missed these first few months of Ambush Trading in 2018, you probably want to get on board now.
Join us and become an Ambush Trader!
The most popular and easiest way to follow Ambush is Ambush Signals. It does all the work for you, allows you to customize what markets you want to see and has a position sizing tool implemented to automatically adjust the positions to your risk preferences.
Each day around 6:30 pm NY Time the Signals are available for you on the Dashboard. You can then place your orders and literally walk away until the next market close! To find out more about the details of Ambush and how Ambush Signals works, have a look at the Ambush Signals Website.
Let’s be realistic. Following any System can be tough, especially in the beginning. It simply needs time to build the confidence needed to make it through inevitable drawdowns. So what if you’re unlucky and don’t catch a good start right away?
I want you to succeed trading Ambush Signals, so here’s something for you that will strongly increase your odds of success and allow you to easily gain the confidence you’ll need to become a long-term profitable Ambush trader.
We offer you 6 months of Ambush Signals for just $499. That’s a saving of $215, giving you almost two months of Ambush Signals for free. We usually only offer monthly or 3-months subscriptions, this is a very special offer!
These 6 months will allow you to get to know Ambush Signals without too much stress or pressure and to follow it for a long enough time period that it simply won’t that much if you’re lucky and start on Ambush’s best trading month ever or not.
Don’t miss out on this and get your 6 months of Ambush Signals for $499 today!
Offer Expires March 30th!
Click HERE to purchase AMBUSH SIGNALS for 6-MONTHS
Now many of you already have been following Ambush for years now and so you’ve been asking for a long-term subscribers bargain. Here it is. For the first time ever we offer you a whole year of Ambush Signals for $799. That’s a whopping $629 off the regular yearly subscription price, giving you over five months for free!
Offer Expires March 30th!
Click HERE to purchase AMBUSH SIGNALS for 1-YEAR
Ambush eBook
If you’d prefer to rather generate the signals on your own and want to know the exact trading rules of Ambush, you want the Ambush ebook. We also have a very special offer for you then:
Coupon Code for $500 off:
- Ambush eBook: use "ambush500" to get the Ambush eBook $500 off, for $1,299 instead of $1,799.
Did we mention - All Special Offers are valid only until March 30th? Hurry up and don’t miss out!
Happy Trading!
Marco Mayer
Feel free to email questions to Marco Mayer, This email address is being protected from spambots. You need JavaScript enabled to view it..
© by Marco Mayer. Re-transmission or reproduction of any part of this material is strictly prohibited without the prior written consent of Trading Educators, Inc.

Chart Scan with Commentary - Cluster Breakouts
by Master Trader Joe Ross
Author, Trader, Trading Mentor, and Founder of Trading Educators, Inc.
Developer of Instant Income Guaranteed
In my book "Day Trading", I presented an idea for trading cluster breakouts in EUR/USD. This morning I was wondering if there were good cluster breakouts in other markets. I really needed to do some trading. When I go for awhile without trading, the desire to do so becomes a persistent itch.
Lately, due to other commitments and activities, my trading time has been sparse and limited to experimentation with a stock trading idea which I continue to work on. This morning I took a look at Treasury Bonds to see if cluster breakouts would work well there. The chart shows what I discovered.

By cluster I refer to groups of rather small bars, more or less moving sideways. The idea is to wrap an envelope around the cluster and then trade a breakout of the envelope. I have marked the bars where the breakout occurred, and please note that these 60-minute bars all begin at the start of an hour, e.g., 8 AM to 9 AM.
It seems that in most cases, the move begins with the 8 AM bar or is completed by the 8 AM bar. Viewing from right to left, we see:
1. A violation of the cluster centered around 110^24 begins with the 8 AM bar and completes with the 9 AM bar.
2. The cluster centered around 110^11 is violated first by the 8 AM bar and later by the 11 AM bar.
3. The cluster centered around 110^02 is violated by the 8 AM bar.
4. The cluster centered around 110^07 is violated by the 8 AM bar.
© by Joe Ross. Re-transmission or reproduction of any part of this material is strictly prohibited without the prior written consent of Trading Educators, Inc.

Trading Example: Instant Income Guaranteed
Philippe Gautier: Administration and New Developments
Developer: Joe Ross
TRADE WITH NO LOSSES
Here's our latest example!
AA Trade
On 7th March 2018 we gave our Instant Income Guaranteed subscribers the following trade on Alcoa Corporation (AA). Price insurance could be sold as follows:
- On 8th March 2018, we sold to open AA Apr 20 2018 40P @ 0.425 (average price), with 42 days until expiration and our short strike about 16% below price action,
- On 13th March 2018, we bought to close AA Apr 20 2018 40P @ 0.20, after 5 days in the trade for quick premium compounding
Profit: 22.50$ per option
Margin: 800$
Return on Margin annualized: 205.31%
Philippe

Receive daily trade recommendations - we do the research for you.
♦ SIGN UP TODAY! THIS IS WORTH THE INVESTMENT ♦
Learn More!
Instant Income Guaranteed
© by Joe Ross and Philippe Gautier. Re-transmission or reproduction of any part of this material is strictly prohibited without the prior written consent of Trading Educators, Inc.
Trading Article - Handling Success
by Master Trader Joe Ross
Author, Trader, Trading Mentor, and Founder of Trading Educators, Inc.
Developer of Instant Income Guaranteed
In his book, "Trading to Win," Dr. Ari Kiev notes, "winning days are often followed by plateaus and losing streaks." Behavioral economist Dr. Terrance Odean observed that novice online investors who had a series of winning trades tended to have periods of overtrading. It's as if they believed they could take more risks, and potentially lose profits, since they had just made more than they expected. If you want to be a profitable trader in the long run, you must learn to keep your profits rather than give them back to the markets.
Why are winning days often followed by plateaus and losing streaks? Loss of focus and concentration is a major reason, according to Dr. Kiev. In the back of their minds, most traders are thinking, "How am I going to find a profitable trading opportunity?"
When you find it, and capitalize on it, you feel relieved. You may wrongly think, "Now I can relax. I can let my guard down." When you relax, you might trade less carefully. You might take lower probability setups because you think you have the luxury of taking risks. Or you may become overconfident and move beyond your risk limits because you are ahead. This is where traders end up giving profits back to the markets. Just because you have a little bit of a winning streak does not mean you can be sloppy and lose focus. It's vital at these times to maintain concentration. Stick with your method, continue to develop trading plans, and follow your trading plan.
A second reason losses may follow winners is that winning takes psychological energy. Winning may feel great, but as you are winning, your adrenalin is pumping. After a big, exciting win, your mind and body just want to relax. When you are worn out, you are prone to make poor decisions or trading errors. The solution to this issue isn't clear.
Dr. Kiev suggests regrouping, and to continue to face the markets in earnest. This may be hard to do for some traders, however. The mind is like a muscle. Once you expend psychological energy, you need rest. It's like playing a championship game. Some players are so prepared mentally and physically that they can play the entire game with ease. For other players, the added stress of a big game wears them down. It's the same with trading. If you are rested up, you can regroup, and continue trading after experiencing big wins. You just need to be aware of your tendency to let your concentration lapse, regroup, and then face the markets with a renewed energy.
Although some traders secretly feel they don't deserve to make profits in the markets, and unconsciously sabotage themselves, for many, it's just a matter of feeling that you need a big reward after the good fight. This reward usually manifests itself as a sloppy, unfocused approach to trading. Be aware of this tendency, so that after you experience winning trades, you will stay focused and maintain your momentum, rather than give profits back to the markets.
© by Joe Ross. Re-transmission or reproduction of any part of this material is strictly prohibited without the prior written consent of Trading Educators, Inc.
To view previous published Chart Scan newsletters, please log in or click on "Join Us,"
shown above, to subscribe to our free "Members Only" section.
A WEALTH OF INFORMATION & EDUCATION:
Joe Ross-Trading Educators' popular free Chart Scan Newsletter has been published since 2004.
Note: Unless otherwise noted, all charts used in Chart Scan commentary were created
by using Genesis Financial Technologies' Trade Navigator (with permission).
Legal Notice and Copyright 2018 Disclaimer - Published by Trading Educators, Inc.
Chart Scan is a complimentary educational newsletter.

