Edition 778 - May 31, 2019

If you have trouble opening your eBook(s), please send us an email:
This email address is being protected from spambots. You need JavaScript enabled to view it.
THANK YOU FOR YOUR PATIENCE AND WE APPRECIATE YOUR BUSINESS!

by Master Trader Joe Ross
Author, Trader, Trading Mentor, and Founder of Trading Educators, Inc.
Developer of Instant Income Guaranteed
Chart Scan with Commentary: CCI
Hey Joe! What can a trader do with the CCI (Commodity Channel Index)?
Interesting question! Here are couple of things you might want to know about CCI. Believe it or not, it is very similar in concept to Bollinger Bands, which we discussed last week.
Bollinger Bands are showing you how today’s closing price compares with the closing prices of the last X number of days. You see it displayed as a simple moving average, with outer band lines at a distance of 2 standard deviations from the moving average of the closing prices of the last X days. BBs are plotted in the same window pane as are the prices.
CCI, however, is plotted as a single line in a separate pane. You see it as an oscillator with no limit on values within the pane. The CCI line can go up in value theoretically forever, or down in value, theoretically forever. CCI compares today’s typical price to a moving average of typical prices for X number of days’ and its value represents the mean deviation of today’s typical price from the moving average. Typical price can be the high + the low + the open + the close: divided by 4, or as simple as open + close: divided by 2, or any other combination of prices. CCI is typically plotted as an oscillator with the possibility of infinite values, however, once the value of CCI exceeds +100 or -100 it indicates that prices are beginning to trend. All values between +100 and -100 are essentially meaningless for purposes of trend identification. +100 indicates prices are moving up. -100 indicates that prices are trending down.
So, what can you do with it?
I use it to tell me when it seems safe to sell a naked put option. However, I can use it to go long the underlying stock or futures; buy a call option and sell a put option—creating a synthetic long position, or simply to buy a call.
For all the years I’ve used CCI, I set the moving average at 30 bars, which seems to work best for me.
Below is an example of selling a naked put with the help of CCI. Bear in mind that there are a number of other things I look at, which are taught in our course on Instant Income. I don’t just trade because CCI is above +100 or below -100.

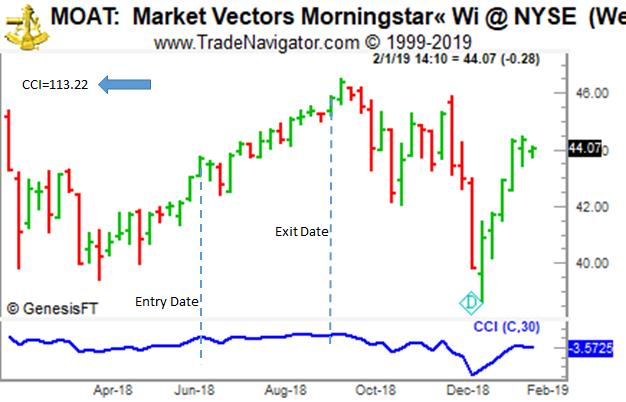
On June 15, 2018 CCI moved above +100 to a value of 113.22. I then sold a naked $40 September put. As you can see, by the September option expiration prices were still climbing.
© by Joe Ross. Re-transmission or reproduction of any part of this material is strictly prohibited without the prior written consent of Trading Educators, Inc.

by Master Trader Joe Ross
Author, Trader, Trading Mentor, and Founder of Trading Educators, Inc.
Developer of Instant Income Guaranteed
Trading Article: Worry-Free and Profitable
Even though there is great interest in the markets these days, and more opportunities than usual, it's vital to approach...read more.
© by Joe Ross. Re-transmission or reproduction of any part of this material is strictly prohibited without the prior written consent of Trading Educators, Inc.

by Philippe Guartier: Administration and
New Developments of Instant Income Guaranteed
After Philippe's Instant Income Guaranteed (IIG) trading example, you must check out his daily guidance trade! Our IIG subscribers are in multiple trades and our program will walk you through each trade. This type of expertise is worth the investment, so become a trader today by using Instant Income Guaranteed!
Trading Idea: Instant Income Guaranteed
KTOS Trade
-
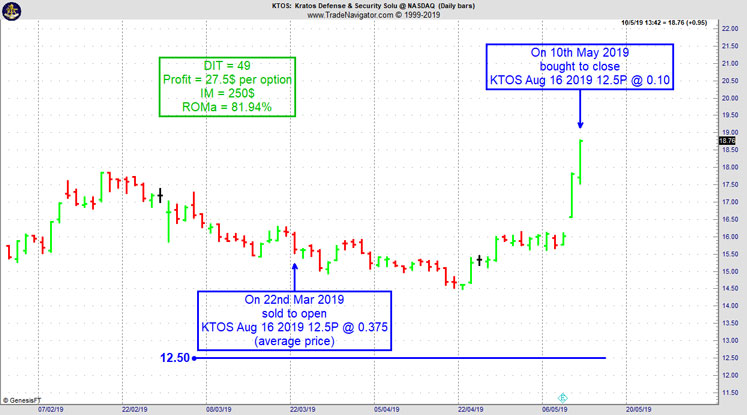
On 22nd March 2019, we sold to open KTOS Aug 16 2019 12.5P @ 0.375 (average price), with 143 days until expiration with our short strike about 20% below price action.
-
On 10th May 2019, we bought to close KTOS Aug 16 2019 12.5P @ 0.10, after 49 days in the trade.
Philippe
Receive daily trade recommendations - we do the research for you.

♦ SIGN UP TODAY! WEALTH BUILDING FOR YOUR FUTURE ♦
Learn More!
Instant Income Guaranteed
© by Joe Ross and Philippe Gautier. Re-transmission or reproduction of any part of this material is strictly prohibited without the prior written consent of Trading Educators, Inc.

by Philippe Guartier: Administration and
New Developments of Instant Income Guaranteed
Here is a recent example of the daily guidance you will receive from Phillipe Gautier using Instant Income Guaranteed. It's worth the investment, subscribe today:
NOTE: THE FOLLOWING IS A DAILY GUIDANCE EMAIL THAT OUR SUBSCRIBERS RECEIVE WHEN SIGNED UP FOR INSTANT INCOME GUARANTEED. WE RESEARCH THE TRADES FOR YOU AND EARN WHILE YOU LEARN TO TRADE. SIGN UP TODAY!
Today all US indices dropped sharply, exceeding mid May lows, even if they recovered part of their intraday losses by the close when buying activity came in: ES -0.86% (close @2780.75), NQ -1.11%, RTY -1.10%, DJT -0.76%, DJX -0.88%. The 2800$ support did not hold for ES.
VIX closed at 17.90, below the 20 “fear level”, but VIX is in a daily uptrend right now (consistent with seasonality).
152 industry groups were down for the day, and only 23 were up.
With the P/C volume ratio reaching 1.26, a bounce could happen.
WDAY’s earnings weighed on software stocks today. Wild move on earnings for GOOSE and ANF, both down more than 25%.
Grains (especially corn, see attached text file) are on potential major cyclical lows. Trade war apart, this should help ADM (-0.10% today), ANDE (+0.70%), BG (+2.35%).
FEYE recovered 4.00% to 14.81 around daily resistance level , nice performance on a down day.
Some of our laggards posted decent gains: HCLP +5.83%, HL +4.76%, HMY +2.55%.
FNKO and BJ retested their daily support levels today.
MOMO jumped 3.44% to daily resistance level.
UA dropped 3.05%, but that was not sufficient to give us a fill for our second entry at 0.35 (fills at 0.30).
ETSY also dropped 4.52% but no entry fill yet (fills at 0.35, 5 cents below our entry price).
SSYS had a wild day but managed to close near its intraday high (-0.41% for the day, close at 22.02, 48 cts below our long call strike). There were fills today at 0.50 for our spread. The mid price of the spread at the close is 0.625, right at 50% of our buying price. We now need a quick recovery, to our long call strike at least, or we will have to take a loss to avoid the maximum loss (which is guaranteed if SSYS stays below our long call strike by expiration).
Kind Regards,
Philippe Gautier
BECOME A PART OF OUR TRADING TEAM
JOIN TODAY
INSTANT INCOME GUARANTEED

by Professional Trader Andy Jordan
Educator for Spreads, Options, Swing, Day Trading, and
Editor of Traders Notebook Complete
Trading Article: Pivot Points
I have never been a pivot point trader per se. Pivot Points are those price levels that are most likely to act as levels of…read more.
Andy Jordan is the editor for Traders Notebook which shows you Futures Trading Strategies in Spreads, Options, and Swing Trades. Learn step-by-step how to trade successfully.
Traders Notebook Complete
Learn how to manage this trade by getting daily detailed trading instructions, click here!
© by Andy Jordan. Re-transmission or reproduction of any part of this material is strictly prohibited without the prior written consent of Trading Educators, Inc.

by Professional Trader Marco Mayer
Educator for Forex, Futures and Systematic Trader
Creator of Ambush Trading Method, Ambush Signals, and Head of AlgoStrats.com
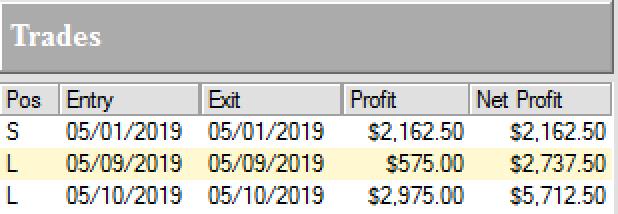
Ambush Traders lock in $5700 of profits in the E-Mini S&P 500!
The Ambush trading method is specialised in catching intraday market tops and bottoms in a variety of Futures markets. Including the E-Mini S&P 500 Future (ES) traded at the CME, where Ambush Traders cashed in big time again over the last couple of days!
Ambush day trades on an end-of-day basis so there’s no need to even check the markets during the day.
The E-Mini S&P 500 is the most popular market out there. Everyone follows it and most of you guys probably trade it or at least own some ETFs based on the S&P 500 index. Ambush has always been doing well in this market and so it’s no surprise it has actually just made new all time equity highs.
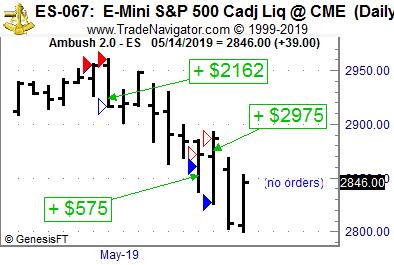
But this month so far has been really crazy. While a lot of traders lost their shirts on the huge reversal we’ve seen related to the news around the trade war with china, Ambush took the other side of these trades and made over $5700 within a couple of days!
Yes, looking at that chart you’re right, Ambush went short pretty much exactly at the all time high of the S&P 500...
You have to ask yourself if you really can afford to miss out on these trades or at least be aware of the signals.

Now with the new Micro E-mini S&P 500 Index Futures (MES) that just started trading at the CME you can also follow these Ambush trades now with a small account:

Yes it’s just 1/10 the size of the regular E-Mini and this allows you to nicely position size into these trades. This is great news as the E-Mini S&P 500 hasn’t been that “mini” any more lately trading at such high prices.
Whether you’re trading a $10k account or a $100k account, Ambush has the right markets for you to start following the signals.
Again, ask yourself if you really can afford to miss out on these trades or at least be aware of the signals? Now if you’ve been on the other sides of these trades trying to buy the breakouts you maybe should think about switching sides?
TWO WAYS TO JOIN US
AND BECOME AN AMBUSH TRADER!
1) AMBUSH SIGNALS
OR
2) AMBUSH EBOOK
READ ON....
With Ambush Signals you can easily follow Ambush, a system specialized in catching intraday market tops and bottoms in the Futures markets!
The most popular and easiest way to follow Ambush is Ambush Signals. It does all the work for you, allows you to customise what markets you want to see and has a position sizing tool implemented to automatically adjust the positions to your risk preferences.
Each day around 6:30 pm NY Time the Signals are available for you on the Dashboard. You can then place your orders and literally walk away until the next market close! To find out more about the details of Ambush and how Ambush Signals works, have a look at the Ambush Signals Website.
Let’s be realistic. Following any System can be tough, especially in the beginning. It simply needs time to build the confidence needed to make it through inevitable drawdowns. So what if you are unlucky and don’t catch a good start right away?
I want you to succeed trading Ambush Signals, so here’s something for you that will strongly increase your odds of success and allow you to easily gain the confidence you’ll need to become a long-term profitable Ambush trader.
Find out more about Ambush eBook and Ambush Signals!
Did you come up with questions? Don't be shy, email Marco Mayer, he wants to hear from you! This email address is being protected from spambots. You need JavaScript enabled to view it.
Sign up for Ambush Signals Today!
LEARN ABOUT AMBUSH TRADING METHOD
© by Marco Mayer. Re-transmission or reproduction of any part of this material is strictly prohibited without the prior written consent of Trading Educators, Inc.
WE APPRECIATE YOUR TRUST IN US
THANK YOU FOR YOUR BUSINESS!
Check out our Blog!
To view previous published Chart Scan newsletters, please log in or click on "Join Us,"
shown above, to subscribe to our free "Members Only" section.
A WEALTH OF INFORMATION & EDUCATION:
Joe Ross-Trading Educators' popular free Chart Scan Newsletter has been published since 2004.
Note: Unless otherwise noted, all charts used in Chart Scan commentary were created
by using Genesis Financial Technologies' Trade Navigator (with permission).
Legal Notice and Copyright 2019 Disclaimer - Published by Trading Educators, Inc.
Chart Scan is a complimentary educational newsletter.


