Edition 795 - September 27, 2019

25% OFF

by Master Trader Joe Ross
Author, Trader, Trading Mentor, and Founder of Trading Educators, Inc.
Developer of Instant Income Guaranteed
Chart Scan with Commentary: Options
Hey Joe! I don’t want to bother you with a whole bunch of questions about options, but could you please tell me if Option Open Interest is of any value, and if so, how would you use it?
Keeping in mind that I am strictly an option seller. I mainly sell put options.
Open interest shows all open options contracts that are available for exercise that have not been closed out. (Arrows)

One way traders use open interest is to determine supply and demand levels for the underlying asset. For example, let's assume that I’m looking to sell put options for ABC stock that's priced at $50.00 per share and I believe that the stock is going to go up, or at least stay in a trading range.
When I look at the put options that expire 2 months from now, I find that the open interest on the $30.00 strike price put option is only 10 contracts, while the open interest on the 40 strike price put option is 500 contracts.
This tells me that the majority of speculators don't believe that the underlying stock is going to move up very much in the next two months and I may want to consider selling a lower strike price put option or reconsider the trade because the sentiment is against the stock moving up.
Another very simple way to use open interest is to determine whether the overall sentiment on the underlying assets that I’m analyzing is bullish or bearish. Let's say that I’m looking at XYZ stock and once again the stock is priced at $50.00 per share. When I look at the open interest column the 50 strike price put option has open interest of only 100, while the 50 strike price call option has open interest of 500.
This would tell me that the current market sentiment for this stock is bullish, since open interest is 5 times higher for the at the money call option compared to the at the money put option, this would tell me that the current sentiment favors XYZ stock moving higher.
If on the other hand the at the money put options have higher open interest than the at the money call options, then I would conclude that the sentiment is bearish.
If I find that open interest for the at the money call option and the at the money put option are similar to each other, then I would avoid using open interest as a directional sentiment indicator. I find that it works best when the open interest numbers favoring either the calls or the puts outweighs the other side by a very large margin.
Lastly, another very common way of utilizing open interest is to monitor for unusual options activity. For example, if ABC stock is trading at $50.00 and the $40 strike price call option that expires in 1 month has open interest of 10,000 contracts and within the next few trading sessions the open interest dramatically rises, this would imply that speculators are accumulating that option because they believe ABC stock is going to move lower within the next few weeks. Similarly, if the open interest drastically increased in a short period of time in an out of the money call option, the $60 strike price for example, it would imply that speculators believe that ABC stock is going to move higher.
Screening for unusual rise in open interest is so popular that several financial analysis firms specialize in screening for options with major changes in open interest in a short period of time.
I personally find that keeping an eye on stock index open interest levels, for different options strike price levels, offers an excellent analysis tool for short term price swings as well as support and resistance levels.
© by Joe Ross. Re-transmission or reproduction of any part of this material is strictly prohibited without the prior written consent of Trading Educators, Inc.

by Master Trader Joe Ross
Author, Trader, Trading Mentor, and Founder of Trading Educators, Inc.
Developer of Instant Income Guaranteed
Trading Article: Be Aware
Beginning traders may make trade after trade and watch their account balance dwindle with each trade. They may feel unintelligent and thoughtless and think, "Why am I making so many losing trades?" At times they may wonder...read more.
© by Joe Ross. Re-transmission or reproduction of any part of this material is strictly prohibited without the prior written consent of Trading Educators, Inc.

by Philippe Guartier: Administration and
New Developments of Instant Income Guaranteed
Trading Idea: Instant Income Guaranteed
WB Trade
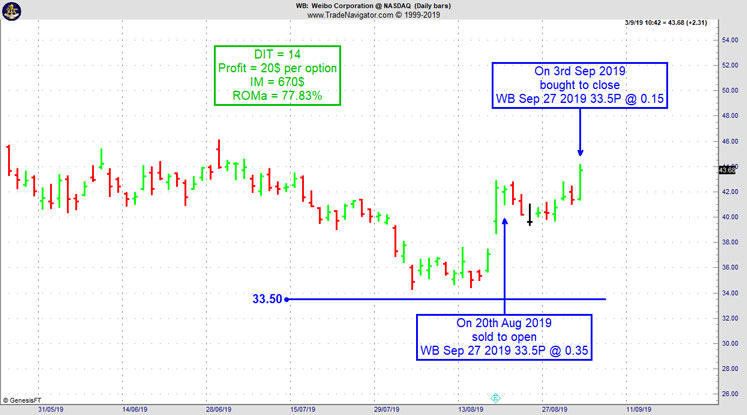
On 18th August 2019 we gave our Instant Income Guaranteed subscribers the following trade on Weibo Corporation (WB), after a gap up on earnings. Price insurance could be sold as follows:
- On 20th August 2019, we sold to open WB Sep 27 2019 33.5P @ 0.35, with 37 days until expiration and our short strike about 22% below price action, making the trade very safe.
- On 3rd September 2019, we bought to close WB Sep 27 2019 33.5P @ 0.15, after 14 days in the trade.
Profit: 20$ per option
Margin: 670$
Return on Margin annualized: 77.83%
Philippe
Receive daily trade recommendations - we do the research for you.

♦ SIGN UP TODAY! WEALTH BUILDING FOR YOUR FUTURE ♦
Learn More!
Instant Income Guaranteed
© by Joe Ross and Philippe Gautier. Re-transmission or reproduction of any part of this material is strictly prohibited without the prior written consent of Trading Educators, Inc.
BECOME A PART OF OUR TRADING TEAM
JOIN TODAY
INSTANT INCOME GUARANTEED
25% OFF

by Professional Trader Andy Jordan
Educator for Spreads, Options, Swing, Day Trading, and
Editor of Traders Notebook Complete
Trading Article: Accurate Records
As a trader, it's very important that you keep accurate records of all factors that may impact the outcome of your trades so that you can learn from your losses, improve your performance, and....read more.
Andy Jordan is the editor for Traders Notebook which shows you Futures Trading Strategies in Spreads, Options, and Swing Trades. Learn step-by-step how to trade successfully.
Traders Notebook Complete
Learn how to manage this trade by getting daily detailed trading instructions, click here!
© by Andy Jordan. Re-transmission or reproduction of any part of this material is strictly prohibited without the prior written consent of Trading Educators, Inc.

by Professional Trader Marco Mayer
Educator for Forex, Futures and Systematic Trader
Creator of Ambush Trading Method, Ambush Signals, and Head of AlgoStrats.com
The Russell 2000 is simply too easy to trade right now!
The Ambush trading method is specialised in catching intraday market tops and bottoms in a variety of Futures markets. Including the Russell 2000 Mini Future (RTY/M2K) traded at the CME, where Ambush Traders keep on cashing in big time again over the last couple of months!
Ambush day trades on an end-of-day basis so there’s no need to even check the markets during the day.
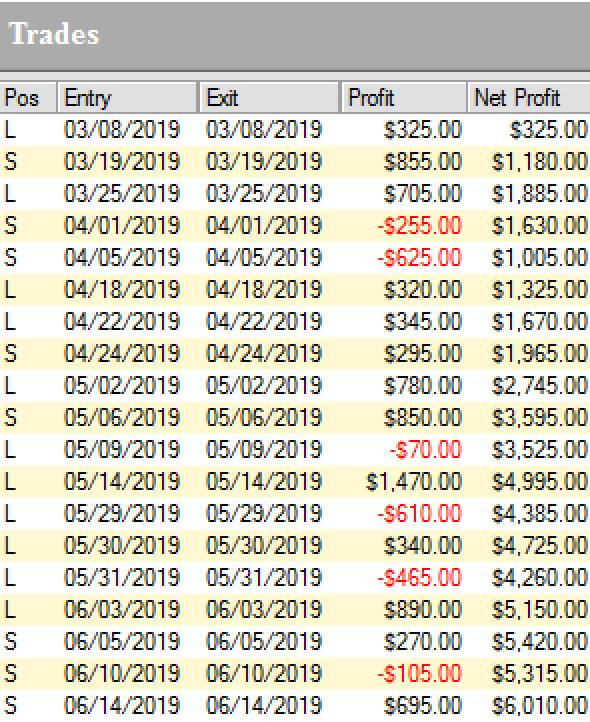
The Russell 2000 a very popular market out there among traders. It has two of the most important things private traders are looking for liquidity and volatility. I won’t even include a daily chart here as it does look quite boring. To keep it brief, the Russell is trading in a wide range for a long time now. Perfect conditions for Ambush and so this has paid out big time, here are all the recent trades:

Yes, that’s over $6000 within just three month and not even 20 trades! Which means Ambush traders made over $300 on average per trade doing nothing more than placing one entry order per day. I guess most active day traders made a lot less…but their brokers rich!
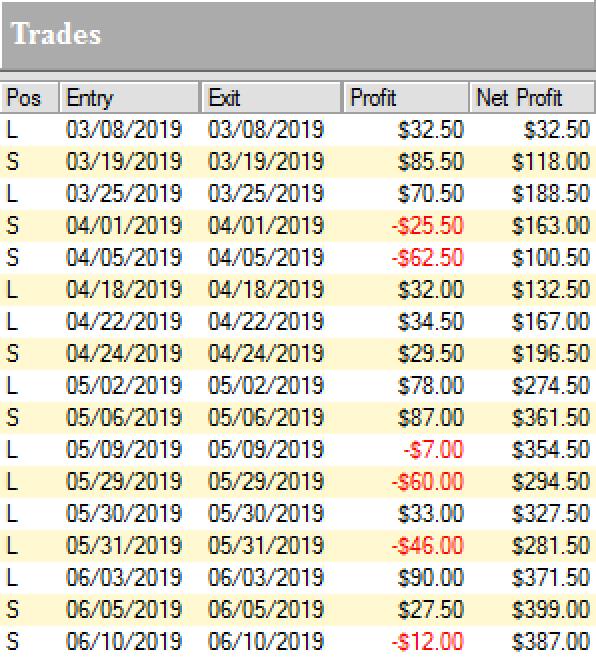
Now those are huge amounts if you have a small account and you might not want to make or lose hundreds or dollars per trade. Thanks to the new Micro Russell 2000 Mini Contracts (M2K) this is not an issue anymore. You can trade these with a small account now. Here are the results trading one M2K contract:

If that is not enough bang for the buck simply size it up and trade two contracts or three. It’s so great now you can position size as you like exactly matching your risk preferences!
In either case you have to ask yourself if you really can afford to miss out on these trades!
So whether you’re trading a $10k account or a $100k account, Ambush has the right markets for you to start following the signals.
Again, ask yourself if you really can afford to miss out on these trades or at least be aware of the signals? Now if you’ve been on the other sides of these trades trying to buy the breakouts you maybe should think about switching sides?
TWO WAYS TO JOIN US
AND BECOME AN AMBUSH TRADER!
1) AMBUSH SIGNALS
OR
2) AMBUSH EBOOK
READ ON....
With Ambush Signals you can easily follow Ambush, a system specialized in catching intraday market tops and bottoms in the Futures markets!
The most popular and easiest way to follow Ambush is Ambush Signals. It does all the work for you, allows you to customise what markets you want to see and has a position sizing tool implemented to automatically adjust the positions to your risk preferences.
Each day around 6:30 pm NY Time the Signals are available for you on the Dashboard. You can then place your orders and literally walk away until the next market close! To find out more about the details of Ambush and how Ambush Signals works, have a look at the Ambush Signals Website.
Let’s be realistic. Following any System can be tough, especially in the beginning. It simply needs time to build the confidence needed to make it through inevitable drawdowns. So what if you are unlucky and don’t catch a good start right away?
I want you to succeed trading Ambush Signals, so here’s something for you that will strongly increase your odds of success and allow you to easily gain the confidence you’ll need to become a long-term profitable Ambush trader.
Find out more about Ambush eBook and Ambush Signals!
Did you come up with questions? Don't be shy, email Marco Mayer, he wants to hear from you! This email address is being protected from spambots. You need JavaScript enabled to view it.
Sign up for Ambush Signals Today!
LEARN ABOUT AMBUSH TRADING METHOD
© by Marco Mayer. Re-transmission or reproduction of any part of this material is strictly prohibited without the prior written consent of Trading Educators, Inc.
WE APPRECIATE YOUR TRUST IN US
THANK YOU FOR YOUR BUSINESS!
Check out our Blog!
To view previous published Chart Scan newsletters, please log in or click on "Join Us,"
shown above, to subscribe to our free "Members Only" section.
A WEALTH OF INFORMATION & EDUCATION:
Joe Ross-Trading Educators' popular free Chart Scan Newsletter has been published since 2004.
Note: Unless otherwise noted, all charts used in Chart Scan commentary were created
by using Genesis Financial Technologies' Trade Navigator (with permission).
Legal Notice and Copyright 2019 Disclaimer - Published by Trading Educators, Inc.
Chart Scan is a complimentary educational newsletter.


