Edition 802 - November 15, 2019

Master Trader Joe Ross
Author, Trader, Trading Mentor, and Founder of Trading Educators, Inc.
Developer of Instant Income Guaranteed
Chart Scan with Commentary: CCI
Hey Joe! I’m submitting the following from an email I received.
“Traders and investors use the commodity channel index to help identify price reversals, extremes and trend strength.
“As with most indicators, the CCI should be used in conjunction with other aspects of technical analysis. CCI fits into the momentum category of oscillators. In addition to momentum, volume indicators and the chart patterns may also influence a technical assessment.
“CCI is often used for detecting divergences from price trends as an overbought/oversold indicator, and to draw patterns on it and trade according to those patterns.
In this respect, it is similar to Bollinger Bands, but is presented as an indicator rather than as overbought/oversold levels.”
I thought you said that CCI is a volatility indicator, so what do you say about the above quote?
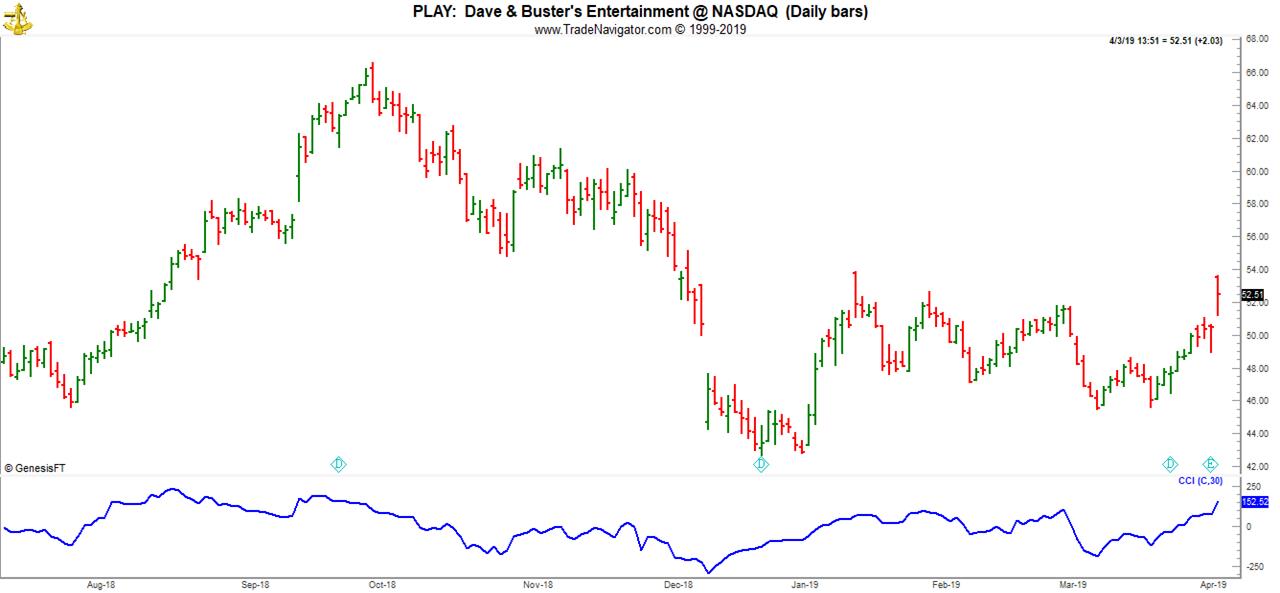
LOL! Whoever wrote that quote doesn’t know his/her knee from his/her elbow. He/she admits that CCI is like Bollinger Bands (which should be capitalized), and Bollinger Bands are definitely based on volatility, not momentum.
CCI (Commodity Channel Index) compares today’s typical price to the Mean Deviation of a moving average of typical prices. Typical price can be figured as high minus low (that’s volatility), or the average of high minus low plus close/3, or high minus low, plus close plus open/4. All of those computations reveal volatility, not momentum. In other words, how much did price move during the time interval being measured?
I believe the default setting for CCI is 21 bars. However, I have always used 30 bars as the best setting.
Momentum indicators have fixed upper and lower limits. Since there is no upper or lower limit to the reach of the bands, as there are with momentum indicators. How in the world can CCI be an overbought/oversold indicator? Which possible value would indicate overbought or oversold? CCI can move infinitely higher or infinitely lower.
© by Joe Ross. Re-transmission or reproduction of any part of this material is strictly prohibited without the prior written consent of Trading Educators, Inc.

Master Trader Joe Ross
Author, Trader, Trading Mentor, and Founder of Trading Educators, Inc.
Developer of Instant Income Guaranteed
Trading Article: Be Objective
When your money is on the line, you can't help but feel a little uneasy. What if you lose? It's hard not to put some of your ego on the line with your money, and when you lose, feel hurt. Winning traders, though, keep cool. They don't ride a roller coaster ride of emotions, feeling euphoric after a win and beaten after a...read more.
© by Joe Ross. Re-transmission or reproduction of any part of this material is strictly prohibited without the prior written consent of Trading Educators, Inc.

Philippe Guartier: Administration and
New Developments of Instant Income Guaranteed
Trading Idea: Instant Income Guaranteed
FITB Trade
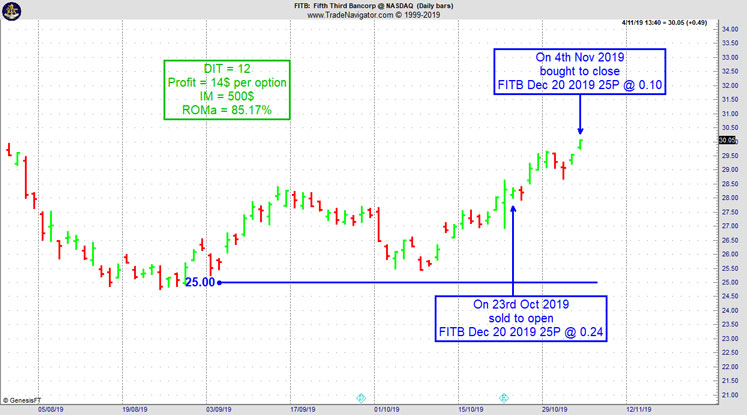
- On 23rd October 2019, we sold to open FITB Dec 20 2019 25P @ 0.24, with 57 days until expiration and our short strike about 12% below price action.
- On 4th November 2019, we bought to close FITB Dec 20 2019 25P @ 0.10, after 12 days in the trade.
Philippe
Receive daily trade recommendations - we do the research for you.
♦ SIGN UP TODAY! WEALTH BUILDING FOR YOUR FUTURE ♦
Learn More!
Instant Income Guaranteed
30% Savings using coupon code: iig30
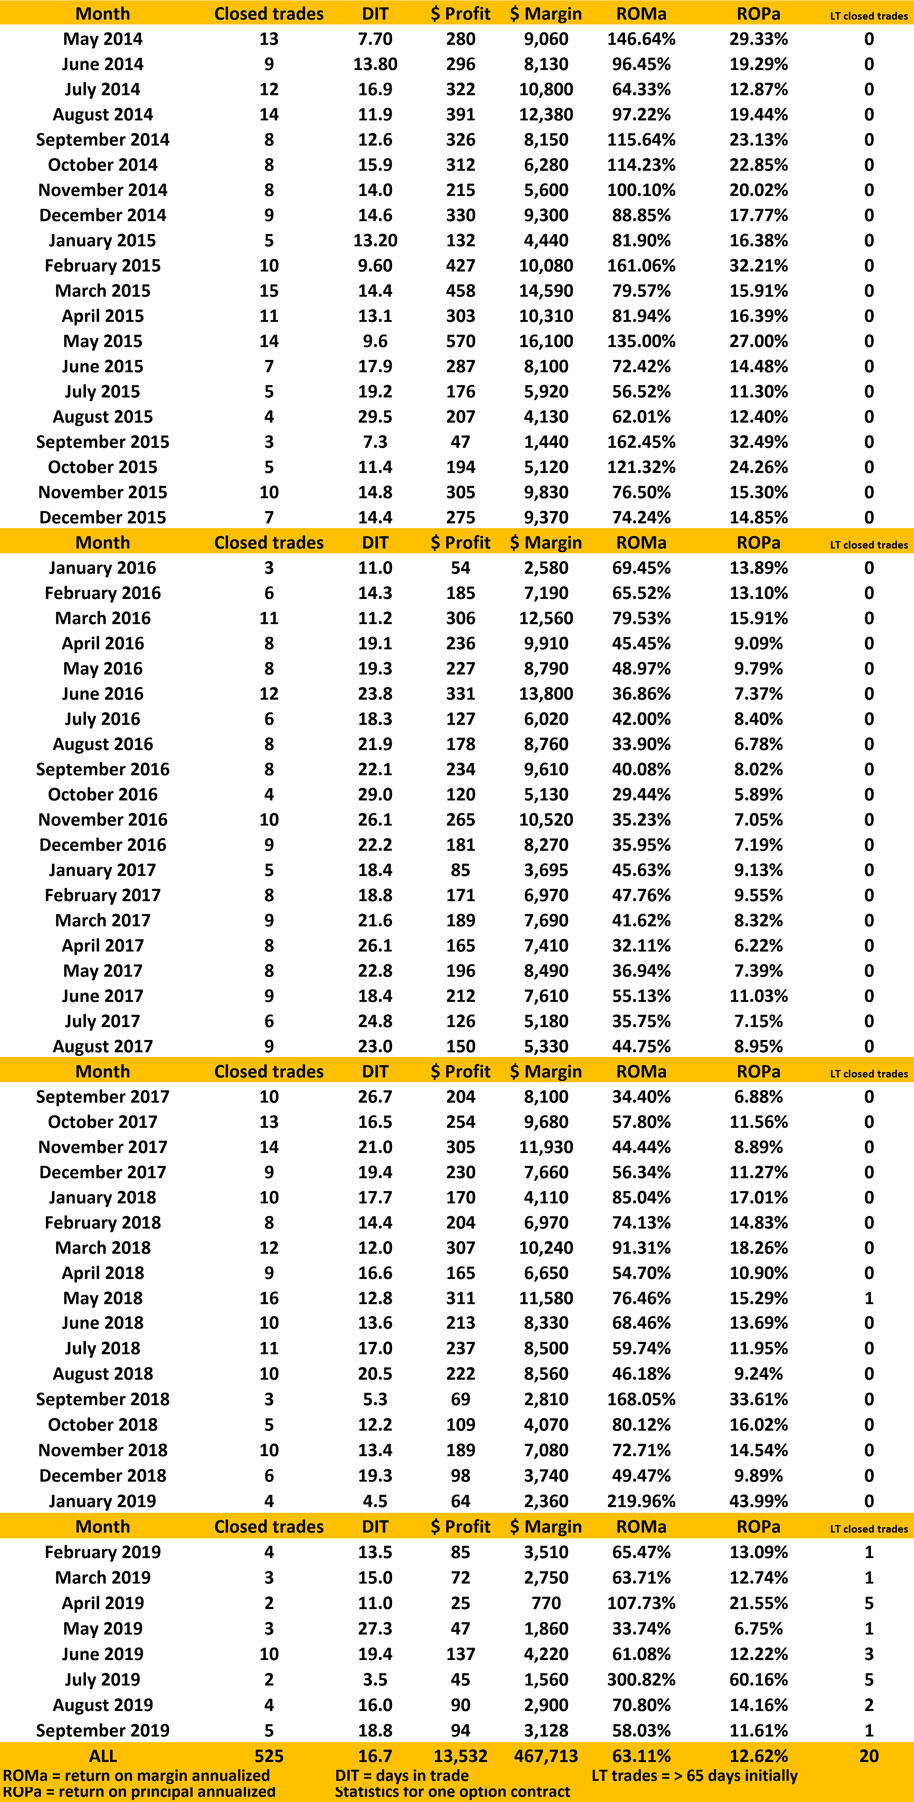
PERFORMANCE RECORD
SEPTEMBER 2019 TO MAY 2014
INSTANT INCOME GUARANTEED
Need more information? We want to hear from you.
Email questions to This email address is being protected from spambots. You need JavaScript enabled to view it.
30% Savings using coupon code: iig30

© by Joe Ross and Philippe Gautier. Re-transmission or reproduction of any part of this material is strictly prohibited without the prior written consent of Trading Educators, Inc.
BECOME A PART OF OUR TRADING TEAM
JOIN TODAY
INSTANT INCOME GUARANTEED

Professional Trader Andy Jordan
Educator for Spreads, Options, Swing, Day Trading, and
Editor of Traders Notebook Complete
Trading Article: The Golden Rules of Martin S. Schwartz
I like Marty Schwartz and his trading book “Pit Bull” a lot. It is an honest book about a trader who had his ups and downs in the market as we all do. In his book he writes....read more.
Andy Jordan is the editor for Traders Notebook which shows you Futures Trading Strategies in Spreads, Options, and Swing Trades. Learn step-by-step how to trade successfully.
© by Andy Jordan. Re-transmission or reproduction of any part of this material is strictly prohibited without the prior written consent of Trading Educators, Inc.

Professional Trader Andy Jordan
Educator for Spreads, Options, Swing, Day Trading, and
Editor of Traders Notebook Complete
Traders Notebook: How to Read a P&L Chart
Let's look at the P&L chart of all spread trade recommendations in Traders Notebook since January 2019. I would like to discuss a few things a trader should always check to see if a trading method or a specific way of trading makes sense. As we can see on the (hypothetical) P&L chart from below, the profit reached almost $15k:
- What does “$15k” mean?
- What was the risk?
- What about the draw-downs?
- Were there enough trades to see the results are statistically significant?
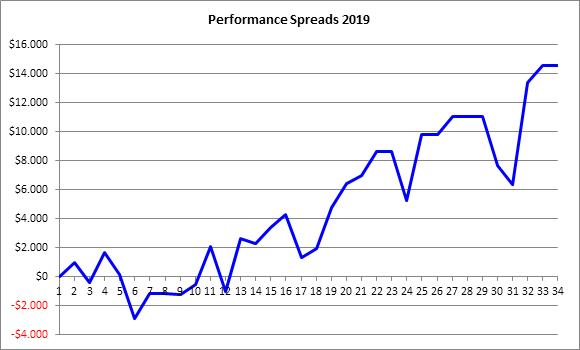
Let’s go through it, step-by-step:
A result of about $15k is kind of meaningless, as long as we don’t know how much money we need so we can get to this result. This is usually the point, where a good marketing specialist will look up how much margin was used to cover the trades and then he will probably tell you the following: “You could have reached that result with an account size of about $15k, Andy. As you can see, this means a return of about 100%! Isn’t that awesome?” But wait a minute. After the trades are done, it is always easy to calculate the optimized values to present huge profits. But what would have happened if there were more losing trades in a row? Well, easy answer: You would have been out of business! So, let’s have a look at the chart by ourselves and forget about the marketing guy. As we can see, the largest draw-down happened around trade 31 of about $5k. Is there a way we can have a few of these draw-downs in a row? Yes, of course. To be on the save side, we better look at the largest draw-down and we multiply this value a couple of times so we can resist even larger draw-down periods. How often we multiply the draw-down is of course up to each trader, but I would use at least 3 to 4 times the largest draw-down ($15k - $20k). Therefore, an account size of about $30k to $40k or even better $50k make much more sense to reach these results. And if we use for example an account size of $50k for our calculation, our profit is down to about 30%, which is by the way still pretty good in the world of “real trading” and not “marketing trading”.
Of course, you can take the trades also with a smaller account, let’s say with only $25k, but then you should also reduce your profit expectation, just to be not too disappointed after one year of trading. Especially beginning traders get disappointed when they make “only” 20% or 30% a year because they have statements like “I made 1 million out of $10,000 in just one year” in mind. But I can tell you, using good risk and money management parameters, these statements are all bogus.
If you still think the results shown on the chart above are pretty good and you would like to join me with Traders Notebook, I want to make you a special offer today.
Pay for a 6-month subscription and get a 12-month subscription from us! That's right, 12-month subscription for only the 6-month subscription price!
Click here to purchase Traders Notebook 6-month subscription.
I think that’s a pretty good deal, isn’t it?
Wishing you all the best with your trading,
Andy Jordan
Editor for Traders Notebook which shows you Futures Trading Strategies in Spreads, Options, and Swing Trades. Learn step-by-step how to trade successfully.
© by Andy Jordan. Re-transmission or reproduction of any part of this material is strictly prohibited without the prior written consent of Trading Educators, Inc.
Traders Notebook Complete
Learn how to manage this trade by getting daily detailed trading instructions, click here!
6-Months FREE when you purchase a 6-Month Subscription!
© by Andy Jordan. Re-transmission or reproduction of any part of this material is strictly prohibited without the prior written consent of Trading Educators, Inc.
CHECK OUT PERFORMANCE SPREADS FOR TRADERS NOTEBOOK!

Traders Notebook Complete
Learn how to manage this trade by getting daily detailed trading instructions, click here!
Traders Notebook Complete
Learn how to manage this trade by getting daily detailed trading instructions, click here!
6-Months FREE when you purchase a 6-Month Subscription!

Professional Trader Marco Mayer
Educator for Forex, Futures and Systematic Trader
Creator of Ambush Trading Method, Ambush Signals, and Head of AlgoStrats.com
Trading Article: Manual Backtesting Pitfalls
If you don’t want to learn how to backtest automatically right now but still want to profit from backtesting, you got to do it manually. That’s how I started too many years ago. I still remember sitting there with printed charts and writing down trade results on a separate sheet of paper.
Now there are some pitfalls you better...read more.
Marco Mayer is an Educator for Forex, Futures and a Systematic Trader, so if you have questions, he wants to hear from you! This email address is being protected from spambots. You need JavaScript enabled to view it.
Check out Ambush Signals
LEARN ABOUT AMBUSH TRADING METHOD
© by Marco Mayer. Re-transmission or reproduction of any part of this material is strictly prohibited without the prior written consent of Trading Educators, Inc.
WE APPRECIATE YOUR TRUST IN US
THANK YOU FOR YOUR BUSINESS!
Check out our Blog!
To view previous published Chart Scan newsletters, please log in or click on "Join Us,"
shown above, to subscribe to our free "Members Only" section.
A WEALTH OF INFORMATION & EDUCATION:
Joe Ross-Trading Educators' popular free Chart Scan Newsletter has been published since 2004.
Note: Unless otherwise noted, all charts used in Chart Scan commentary were created
by using Genesis Financial Technologies' Trade Navigator (with permission).
Legal Notice and Copyright 2019 Disclaimer - Published by Trading Educators, Inc.
Chart Scan is a complimentary educational newsletter.


