Edition 803 - November 22, 2019

Joe Ross shares his knowledge as a trader!
Read Joe's latest Chart Scan with Commentary: Favorite Indicator
Use Coupon Code to Receive 35% OFF when you purchase Trading MORE Special Set-Ups
MORE35
CLICK HERE TO BUY AND START LEARNING FROM JOE TODAY!

Master Trader Joe Ross
Author, Trader, Trading Mentor, and Founder of Trading Educators, Inc.
Developer of Instant Income Guaranteed
Chart Scan with Commentary: Favorite Indicator
People often ask me about indicators, but recently, someone wrote in to ask, “What is your favorite indicator?”
As many of you know, I’m not big on using indicators. They can be useful for confirmation of what you see on a chart, and as many might know, they can be useful for predicting what other traders might do. For example, traders will react in a certain way when a 50 bar moving average crosses a 200 bar moving average, and vice-versa.
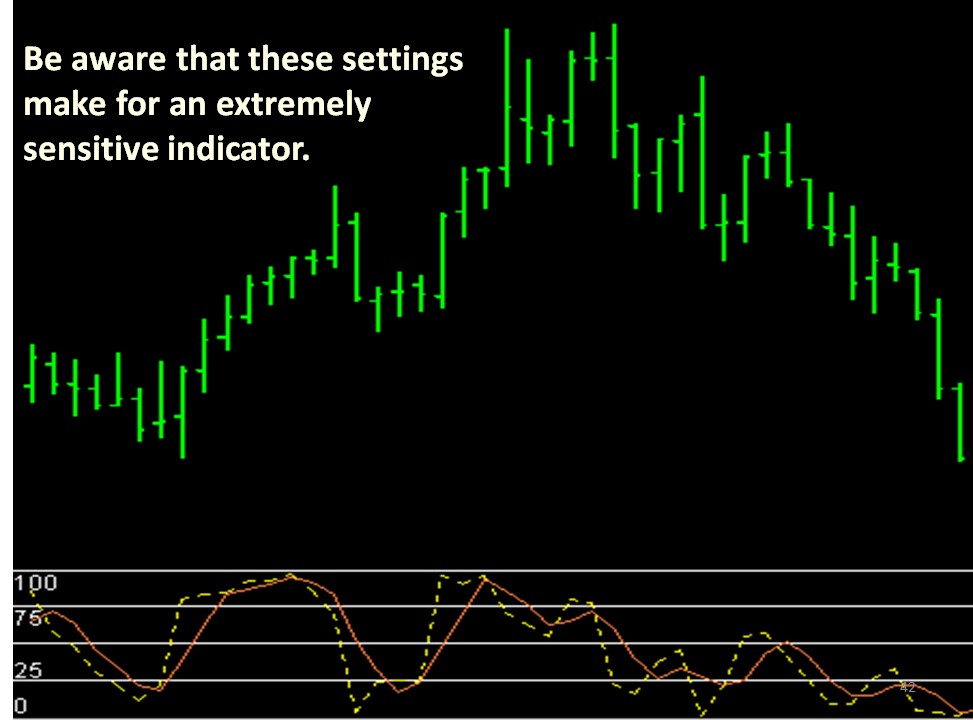
If I actually have a favorite indicator, it would have to be the 5,3,3 Stochastic. Let’s take a look.
The setting of ‘5’ is the number of bars (15 minutes, in this case) we are using for the calculation. The number ‘3’ is the smoothing factor for %K, and the other number ‘3’ is the setting we are using for %D. %K represents the moving average of the Stochastic values, and is the dashed yellow line on the next chart. %D is a ‘3 bar’ moving average of the %K, the solid orange line, also called the “Slow Stochastic.”

Be aware that these settings make for an extremely sensitive indicator. However, if we are going to use an indicator here, we want it to be very responsive to the price movements.
There are two valid signals available when working with Stochastics.
- Buy and sell signals are based entirely on a crossing of the “D” plot by the “K” plot. If K is within one time interval of crossing “D,” we can make the trade.
What do I mean by “one time interval?” I am saying that if “K” will cross, is crossing, or has crossed “D” on the day, hour, or the minute, you can take the trade depending on the time frame you in which you are trading.
- I also look at divergence at the time I want to enter a trade. Stochastic must be in coordination with prices. If prices are trending up, Stochastic must also be trending up. If prices are trending down, Stochastic must also be trending down.
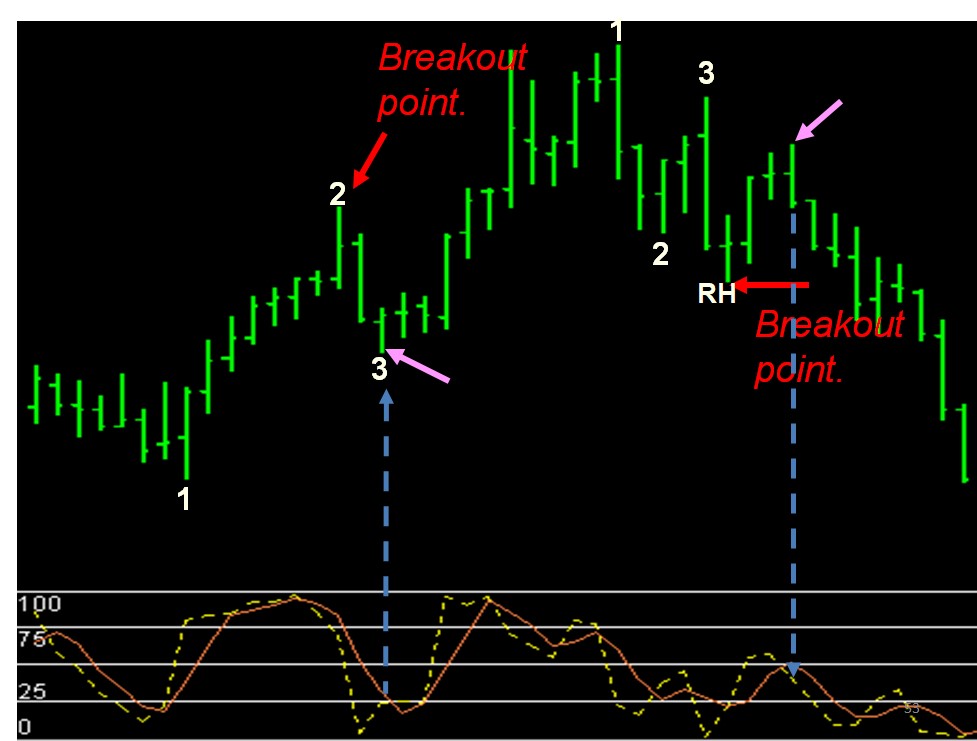
Below, I’ve shown you two perfect trades using a Stochastic crossover. There were two other possible trades to enter long. The first was not entered because “K” had already crossed “D” by more than one time interval. Another possibility to go long had the same problem, but even worse, “K” had already crossed “D” the wrong way, so we also had divergence.
There was one other possibility to go short, but was not taken. That possibility had the problem that “K” had already crossed “D” by more than one time interval.
See if you can spot the possible trades that were not taken. One of them would have turned out to be a terrific trade. However, the other two, would have been terrible trades. In those cases, Stochastics kept me out of a couple of bad trades.

My use of Stochastics as a filter for trade entries is quite different from the way most people try to use this indicator. Most users of Stochastics try to find “overbought” and “oversold” situations by viewing Stochastics relative to a fixed scale that attempts to measure momentum. But as explained above, I don’t care where Stochastics are relative to a scale. I simply want to know where %D and %K are relative to each other.
The technique and others are explained in my Recorded Webinar “Trading MORE Special Set-Ups”.
Joe Ross shares his knowledge as a trader!
Use Coupon Code to Receive 35% OFF when you purchase Trading MORE Special Set-Ups
MORE35
CLICK HERE TO BUY AND START LEARNING FROM JOE TODAY!
© by Joe Ross. Re-transmission or reproduction of any part of this material is strictly prohibited without the prior written consent of Trading Educators, Inc.

Master Trader Joe Ross
Author, Trader, Trading Mentor, and Founder of Trading Educators, Inc.
Developer of Instant Income Guaranteed
Trading Article: Protection
It was a muggy day and I couldn’t seem to do anything right. I fumbled around all morning. He hadn’t slept the previous night. I was tired, and was tempted to just quit for the day, drink some ice-tea, and sit in a hammock by the pool. But I still had enough willpower to fight...read more.
© by Joe Ross. Re-transmission or reproduction of any part of this material is strictly prohibited without the prior written consent of Trading Educators, Inc.

Philippe Guartier: Administration and
New Developments of Instant Income Guaranteed
Trading Idea: Instant Income Guaranteed
BOOM Trade
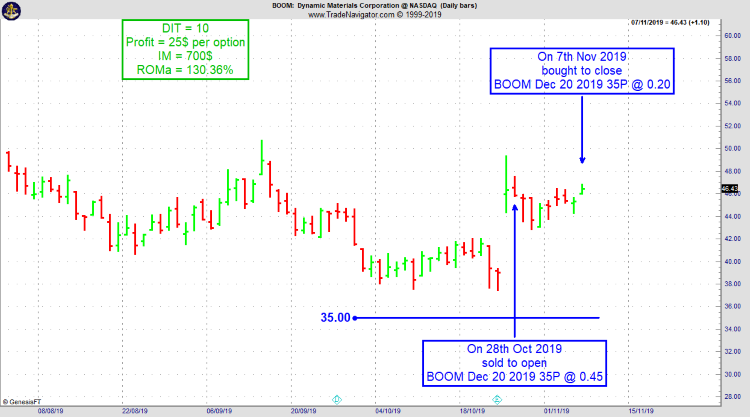
- On 28th October 2019, we sold to open BOOM Dec 20 2019 35P @ 0.45, with 52 days until expiration and our short strike about 24% below price action.
- On 7th November 2019, we bought to close BOOM Dec 20 2019 35P @ 0.20, after 10 days in the trade
Philippe
Click Here to Learn More!
Instant Income Guaranteed
30% Savings using coupon code: iig30
Receive daily trade recommendations - we do the research for you.

♦ SIGN UP TODAY! WEALTH BUILDING FOR YOUR FUTURE ♦
Learn More!
Instant Income Guaranteed
Need more information? We want to hear from you.
Email questions to This email address is being protected from spambots. You need JavaScript enabled to view it.
30% Savings using coupon code: iig30
© by Joe Ross and Philippe Gautier. Re-transmission or reproduction of any part of this material is strictly prohibited without the prior written consent of Trading Educators, Inc.
BECOME A PART OF OUR TRADING TEAM
JOIN TODAY
INSTANT INCOME GUARANTEED

Professional Trader Andy Jordan
Educator for Spreads, Options, Swing, Day Trading, and
Editor of Traders Notebook Complete
Trading Article: Ed Seykota Golden Trading Rules
Here is what I found on Wikipedia about Ed Seykota:
Edward Arthur Seykota (born August 7, 1946) is a commodities trader, who earned S.B. degrees in Electrical Engineering from MIT and Management from the MIT Sloan School of Management, both in 1969. In 1970, he pioneered Systems trading by using early...read more.
Andy Jordan is the editor for Traders Notebook which shows you Futures Trading Strategies in Spreads, Options, and Swing Trades. Learn step-by-step how to trade successfully.
© by Andy Jordan. Re-transmission or reproduction of any part of this material is strictly prohibited without the prior written consent of Trading Educators, Inc.

Professional Trader Marco Mayer
Educator for Forex, Futures and Systematic Trader
Creator of Ambush Trading Method, Ambush Signals, and Head of AlgoStrats.com
Trading Article: Manual Backtesting Pitfalls
If you don’t want to learn how to backtest automatically right now but still want to profit from backtesting, you got to do it manually. That’s how I started too many years ago. I still remember sitting there with printed charts and writing down trade results on a separate sheet of paper.
Now there are some pitfalls you better...read more.
Marco Mayer is an Educator for Forex, Futures and a Systematic Trader, so if you have questions, he wants to hear from you! This email address is being protected from spambots. You need JavaScript enabled to view it.
Check out Ambush Signals
LEARN ABOUT AMBUSH TRADING METHOD
© by Marco Mayer. Re-transmission or reproduction of any part of this material is strictly prohibited without the prior written consent of Trading Educators, Inc.
WE APPRECIATE YOUR TRUST IN US
THANK YOU FOR YOUR BUSINESS!
Check out our Blog!
To view previous published Chart Scan newsletters, please log in or click on "Join Us,"
shown above, to subscribe to our free "Members Only" section.
A WEALTH OF INFORMATION & EDUCATION:
Joe Ross-Trading Educators' popular free Chart Scan Newsletter has been published since 2004.
Note: Unless otherwise noted, all charts used in Chart Scan commentary were created
by using Genesis Financial Technologies' Trade Navigator (with permission).
Legal Notice and Copyright 2019 Disclaimer - Published by Trading Educators, Inc.
Chart Scan is a complimentary educational newsletter.


