Edition 797 - October 11, 2019

GOING...GOING...Almost Gone

by Master Trader Joe Ross
Author, Trader, Trading Mentor, and Founder of Trading Educators, Inc.
Developer of Instant Income Guaranteed
Chart Scan with Commentary: Instant Income CBOE Trade
Following is a typical Instant Income Guaranteed trade (IIG). For the past 5 years + these trades have had an average life span of 17 days - a number that is very consistent. Our IIG Advisory Service is something special so take advantage of our 30% off now, as an introductory price for our newsletter subscribers. Use coupon code during checkout: iig30
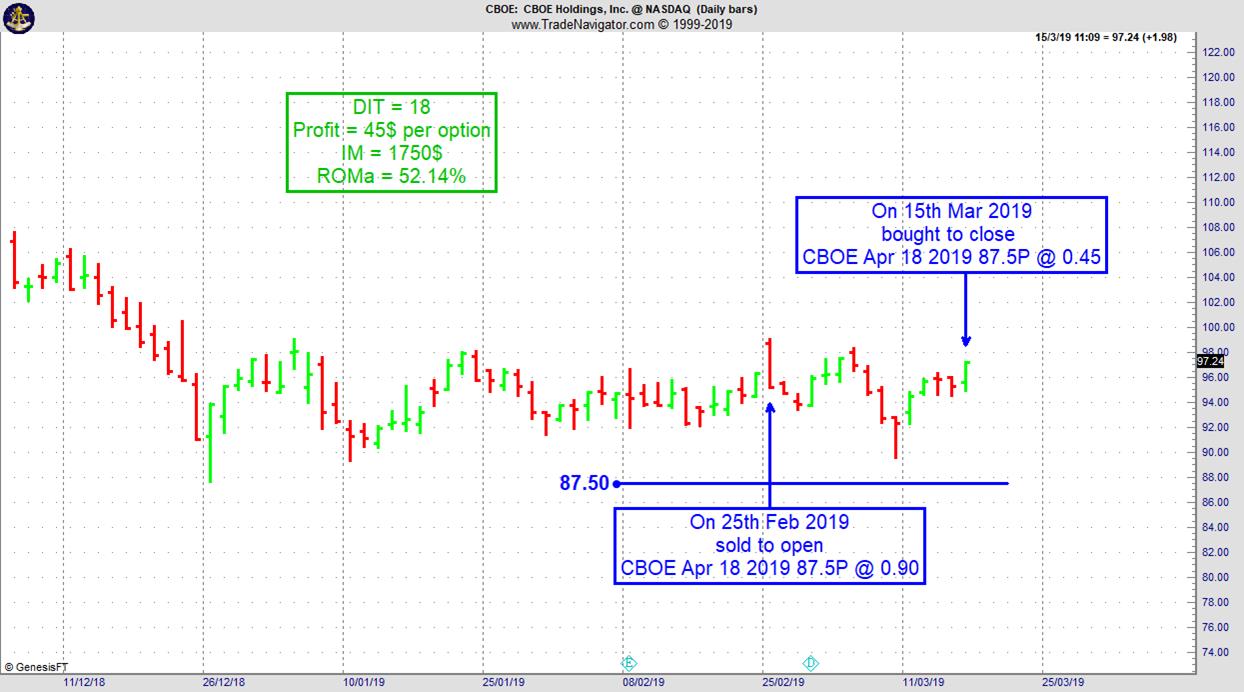
On 24th February 2019 we gave our IIG subscribers the following trade on CBOE Holdings Inc. (CBOE). Price insurance was sold as follows:
On 25th February 2019, we sold to open CBOE Apr 18 2019 87.5P @ 0.90, with 53 days until expiration with our short strike about 9% below price action.
On 15th March 2019, we bought to close CBOE Apr 18 2019 87.5P @ 0.45, after 18 days in the trade, even if CBOE was mostly going sideways during the life of the trade. As with most of our IIG trades, we doubled our money--$0.90 – $0.45. Although we anticipate having a loss sooner or later, we have had none since May of 2014. So far, there have been 584 trades closed out of a total of 616 trades.
Profit: 45$ per option
Margin: 1750$
Return on Margin annualized: 52.14%
© by Joe Ross. Re-transmission or reproduction of any part of this material is strictly prohibited without the prior written consent of Trading Educators, Inc.

by Master Trader Joe Ross
Author, Trader, Trading Mentor, and Founder of Trading Educators, Inc.
Developer of Instant Income Guaranteed
Trading Article: Intuition
If only humans were more like machines. In theory, the ultimate trader would act like a robot, analyzing market data with unfailing accuracy, devising a trading plan, and executing it without flaw. But does trading work that way? Trading is more art than science. Without an intuitive...read more.
© by Joe Ross. Re-transmission or reproduction of any part of this material is strictly prohibited without the prior written consent of Trading Educators, Inc.

by Philippe Guartier: Administration and
New Developments of Instant Income Guaranteed
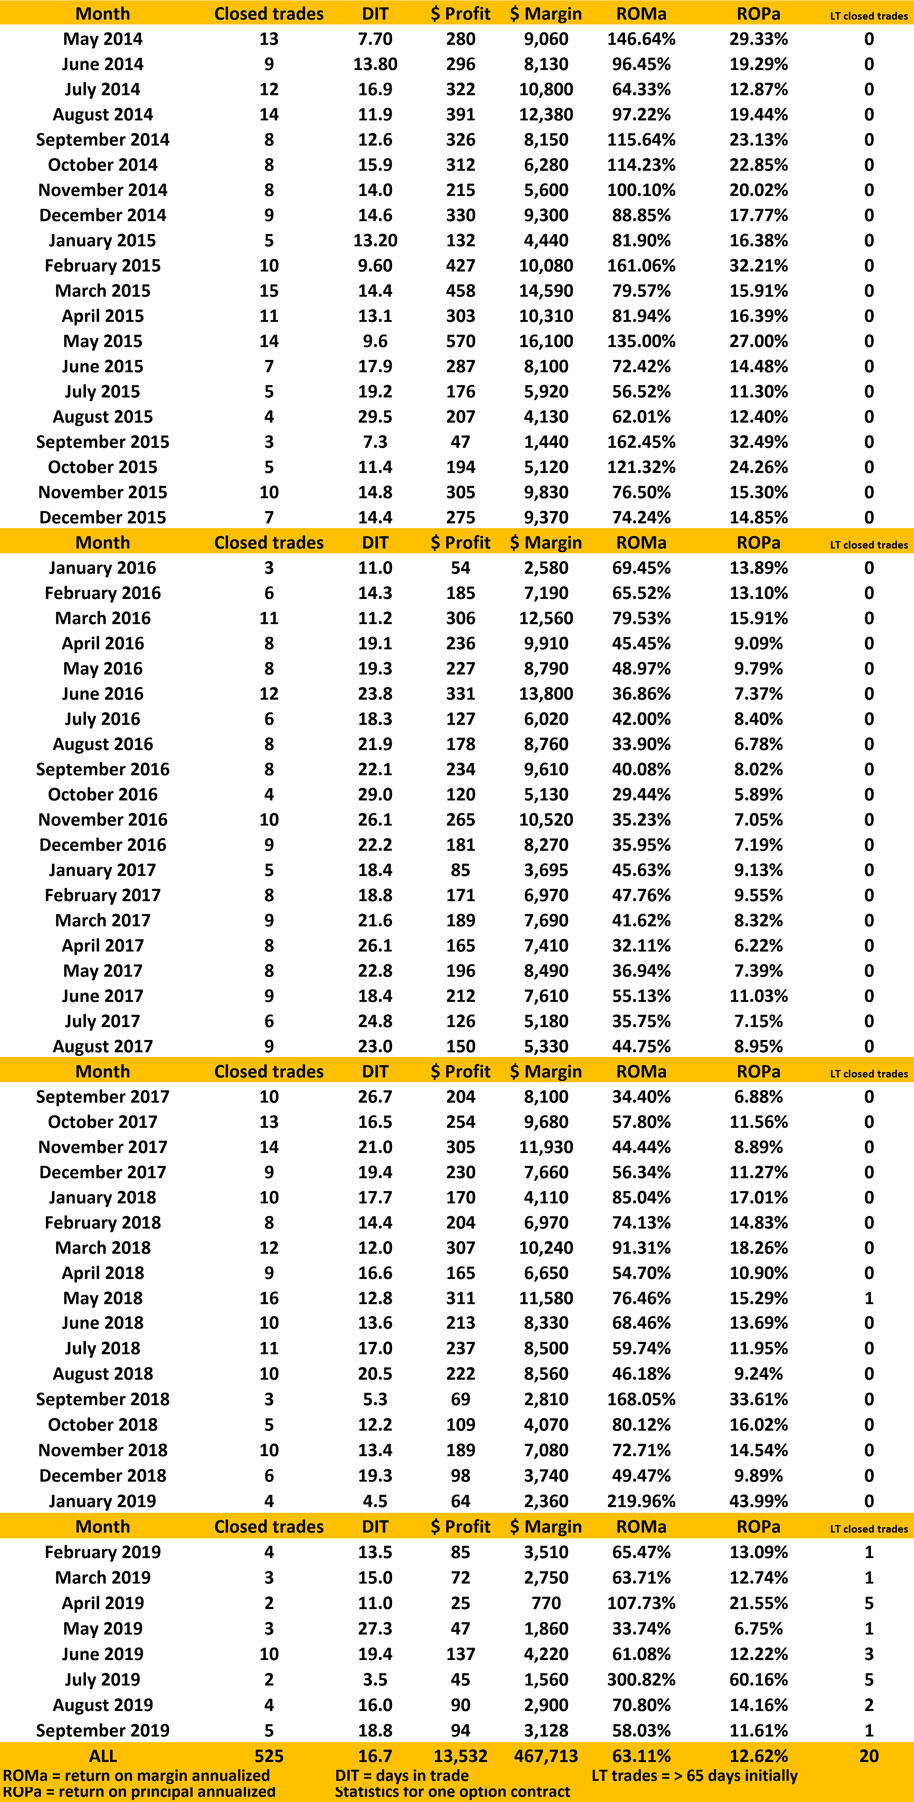
PERFORMANCE RECORD
SINCE MAY 2014
INSTANT INCOME GUARANTEED
Need more information? We want to hear from you.
Email questions to This email address is being protected from spambots. You need JavaScript enabled to view it.
30% Savings using coupon code: iig30

30% Savings using coupon code: iig30
Trading Idea: Instant Income Guaranteed
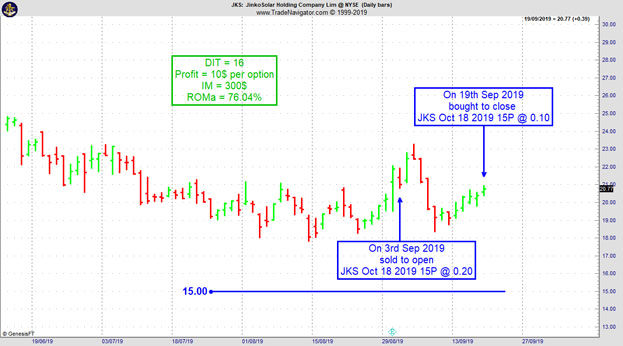
JKS Trade
- On 3rd September 2019, we sold to open JKS Oct 18 2019 15P @ 0.20, with 46 days until expiration and our short strike about 31% below price action, making the trade very safe.
- On 19th September 2019, we bought to close JKS Oct 18 2019 15P @ 0.10, after 16 days in the trade
Philippe
30% Savings using coupon code: iig30
Receive daily trade recommendations - we do the research for you.
♦ SIGN UP TODAY! WEALTH BUILDING FOR YOUR FUTURE ♦
Learn More!
Instant Income Guaranteed
© by Joe Ross and Philippe Gautier. Re-transmission or reproduction of any part of this material is strictly prohibited without the prior written consent of Trading Educators, Inc.
BECOME A PART OF OUR TRADING TEAM
JOIN TODAY
INSTANT INCOME GUARANTEED

by Professional Trader Andy Jordan
Educator for Spreads, Options, Swing, Day Trading, and
Editor of Traders Notebook Complete
Trading Article: The Law of Large Numbers
In this instance, you spread by taking an opposite position in a related contract. You might spread corn against wheat. You might spread heating oil against unleaded gasoline. Quite often, operators who trade large size and are market makers hedge the S&P 500 by taking an opposite position in the Nasdaq or the Dow.
(Some basic mathematics stuff a trader should know – but don’t get discouraged if the first part of this lesson seems very complicated. It all becomes crystal clear later on.)
The law of large numbers (LLN) is a theorem in probability that describes the long-term stability of the mean of a random variable. Given a random variable with a finite expected value, if its values are repeatedly sampled, as the number of these observations increases, their mean will tend to approach and stay close to the expected value.
The LLN can easily be illustrated using the rolls of a die. That is, outcomes of a multinomial distribution in which the numbers 1, 2, 3, 4, 5, and 6 are equally likely to be chosen. The population mean (or "expected value") of the outcomes is:
(1 + 2 + 3 + 4 + 5 + 6) / 6 = 3.5.
The graph below plots the results of an experiment of rolls of a die. In this experiment we see that the average of die rolls deviates wildly at first. As predicted by LLN, the average stabilizes around the expected value of 3.5 as the number of observations becomes larger.
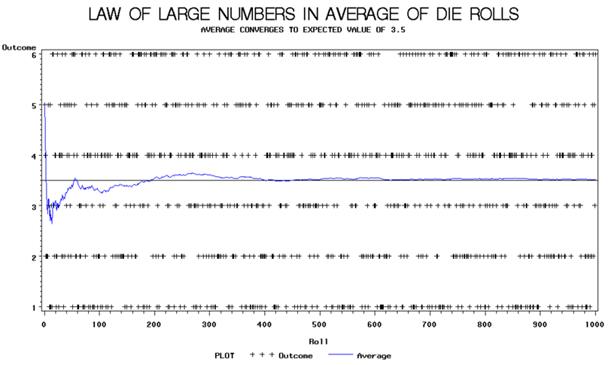
The LLN is important because it "guarantees" stable long-term results for random events. For example, while a casino may lose money in a single spin of the American roulette wheel, it will almost certainly gain very close to 5.3% of all gambled money over thousands of spins. Any winning streak by a player will eventually be overcome by the parameters of the game. It is important to remember that the LLN only applies (as the name indicates) when a large number of observations are considered. There is no principle that a small number of observations will converge to the expected value, or that a streak of one value will immediately be "balanced" by the others.
So, why is this important for a trader?
It is important to understand that we all trade based on probabilities. All we really know is that we can make money with trading only in the long run. We have no idea of what will happen with our next trade, or with the next ten trades!
Let’s have a look at the following chart:
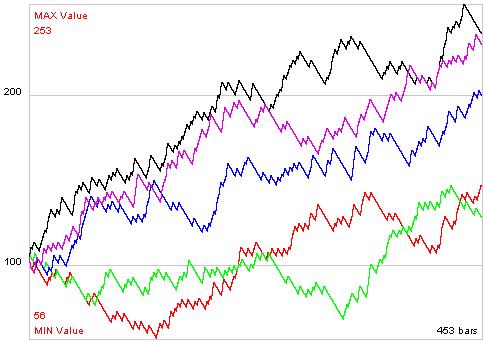
The 5 equity curves from above are based on a trading method with the following statistical values:
Winning Percentage is 20%, and the winners are 5 times bigger then the losers.
As we can see on the chart above, all equity curves are showing a profit in the long run. But we would have to go through different emotional periods while trading on the same probabilities. The trader trading the red line would get mad right in the beginning. He would start losing in the beginning, but do well later. The green trader would get even more frustrated. After trading for almost nothing for the first half, the equity goes down a lot before moving up nicely at end of the year.
As you can see, both would end the year with almost the same result. But the way they got there was completely different.
Once again, all curves above are based and calculated at random using the same parameters.
What does this mean for us?
This means we have to make sure we stay in the water long enough for the big wave to take us into the profit zone. We have no idea when this will happen, at the beginning of the year or at the end.
Here is what we have to do:
- We need a solid money management technique. There is no way to get around losing periods, and we have to make sure we survive such times.
- We have to understand how important it is to look at our results in the long run. Everything that happens in a shorter time period has no meaning.
- We need a solid system we can follow. Otherwise we will have problems following the system in bad times (many, many traders don’t understand this point and they just jump from one method to the next, losing all the money they have).
- We have to make sure we let the big winning trades run, and cash in as much as we can on such trades.
- We have to stay “in the water.” We just don’t know if the next trade will be a losing trade, a winning trade, or one of the really “big fishes”.
Trading is not about what happens on a single trade. What really counts is if your trading is based on a solid method, and that you understand good money management. If so, the large numbers of tries will make sure you are profitable in the long run.
Andy Jordan is the editor for Traders Notebook which shows you Futures Trading Strategies in Spreads, Options, and Swing Trades. Learn step-by-step how to trade successfully.
Traders Notebook Complete
Learn how to manage this trade by getting daily detailed trading instructions, click here!
© by Andy Jordan. Re-transmission or reproduction of any part of this material is strictly prohibited without the prior written consent of Trading Educators, Inc.

by Professional Trader Marco Mayer
Educator for Forex, Futures and Systematic Trader
Creator of Ambush Trading Method, Ambush Signals, and Head of AlgoStrats.com
Trading Article: Manual Backtesting Pitfalls
If you don’t want to learn how to backtest automatically right now but still want to profit from backtesting, you got to do it manually. That’s how I started too many years ago. I still remember sitting there with printed charts and writing down trade results on a separate sheet of paper.
Now there are some pitfalls you better...read more.
Marco Mayer is an Educator for Forex, Futures and a Systematic Trader, so if you have questions, he wants to hear from you! This email address is being protected from spambots. You need JavaScript enabled to view it.
Check out Ambush Signals
LEARN ABOUT AMBUSH TRADING METHOD
© by Marco Mayer. Re-transmission or reproduction of any part of this material is strictly prohibited without the prior written consent of Trading Educators, Inc.
GOING...GOING...Almost Gone
WE APPRECIATE YOUR TRUST IN US
THANK YOU FOR YOUR BUSINESS!
Check out our Blog!
To view previous published Chart Scan newsletters, please log in or click on "Join Us,"
shown above, to subscribe to our free "Members Only" section.
A WEALTH OF INFORMATION & EDUCATION:
Joe Ross-Trading Educators' popular free Chart Scan Newsletter has been published since 2004.
Note: Unless otherwise noted, all charts used in Chart Scan commentary were created
by using Genesis Financial Technologies' Trade Navigator (with permission).
Legal Notice and Copyright 2019 Disclaimer - Published by Trading Educators, Inc.
Chart Scan is a complimentary educational newsletter.


