Trades in Stock Options. Receive daily trade recommendations. Can you imagine discovering a way to trade that promises instant income? If you think such a method is impossible, think again. It is definitely achievable, and everything you need to know is available online for one low price that includes special three-part online webinars.
Ambush is a time-proven mean-reversion day trading System focused on a variety of Futures markets around the globe. With Ambush Signals you can now easily follow the Ambush System on a subscription basis for educational purposes.
If you didn't fail early in your trading business, then you have probably been around long enough to realize that many of the problems you encounter as a trader are those that derive from your own individuality. Such problems are common among traders and, in fact, common among all human beings. Seeking spiritual help from a power much greater than your own is the area I address in the "Spiritual Side of Trading".
Chart Scan with Commentary: My Favorite Way to Trade Earnings Dates
Earnings reports enable me to be an occasional trader, in no way tied to a trading screen. In my semi-retirement, I trade only around earnings reports, which means I trade for a few days once each quarter when earnings are reported. That leaves me a lot of time for other activities.
I found that whenever the price of shares shoots up after earnings, I am able to get a second trade the day after prices react to the earnings report. The way I do it is through the strategies we use in out Instant Income Guaranteed program (IIG). Using Implied Volatility as described in the most recent issues of Chart Scan, and following with IIG the following day may be the perfect way to trade around earnings dates.
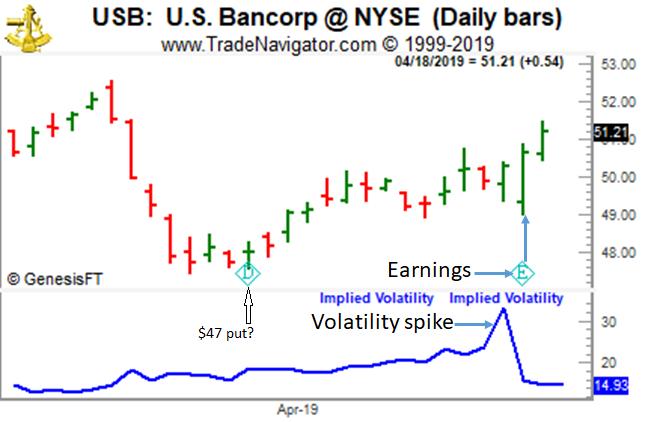
If share prices shoot up the day after the earnings report hits the market, why not sell some put options. Take a look at the following chart of U.S. Bancorp:
We see the volatility spike the day before earnings. We see that prices initially dropped but made a strong recovery by the end of the day. The next day prices continued the upward momentum from earnings day. Why not consider selling a $47 put if the premium is satisfactory?
Let’s look at a recent IIG trade. We make these kinds of trades over and over again. They are not at all unusual.
PETQ trade
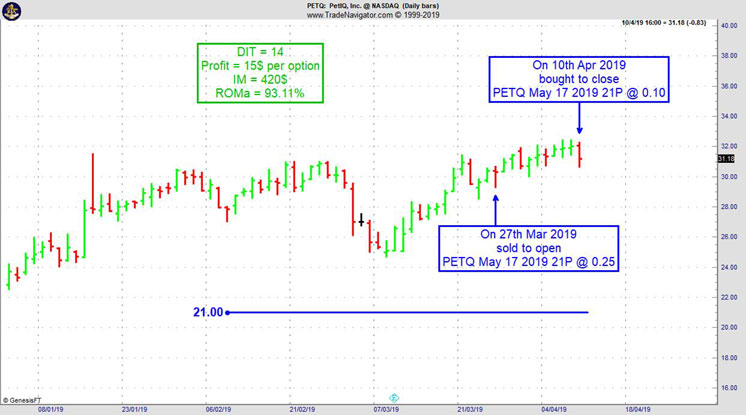
On 26th March 2019 we gave our Instant Income Guaranteed subscribers the following trade on PetIQ Inc. (PETQ). Price insurance (put) could be sold as follows:
On 27th March 2019, we sold to open PETQ May 17 2019 21P @ 0.25, with 50 days until expiration with our short strike about 31% below price action, making the trade pretty safe..
On 10th April 2019, we bought to close PETQ May 17 2019 21P @ 0.10, after 14 days in the trade.
Why do so many traders abandon their trading plan? Is it their personality, an inherent pitfall of the trading profession, or temporary insanity? A host of factors may contribute to a lack of...read more.
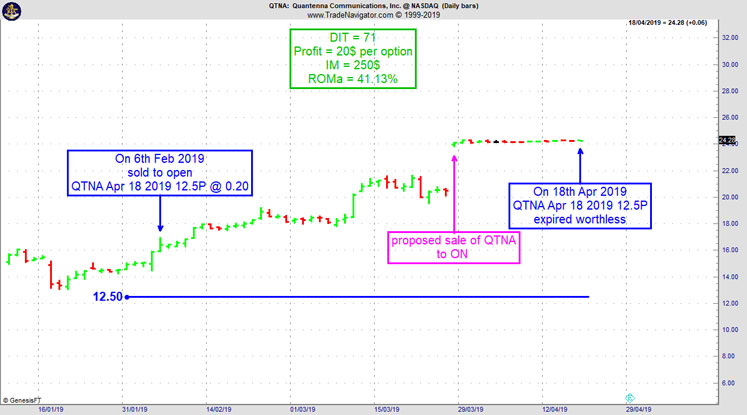
On 5th February 2019 we gave our Instant Income Guaranteed subscribers the following trade on Quantenna Communications, Inc. (QTNA). Price insurance could be sold as follows:
On 6th February 2019, we sold to open QTNA Apr 18 2019 12.5P @ 0.20, with 72 days until expiration and our short strike about 22% below price action.
On 18th April 2019, QTNA Apr 18 2019 12.5P expired worthless
Whe.n On Semiconductor Corp (ON) announced a takeover of QTNA, our short strike was more than 45% below price action and it was pretty safe to let our option expire worthless.
Profit: 20$ per option
Margin: 250$
Return on Margin annualized: 41.13%
Philippe
Receive daily trade recommendations - we do the research for you.
♦ SIGN UP TODAY! WEALTH BUILDING FOR YOUR FUTURE ♦
CME Group is aiming to make equity index futures trading more accessible to active traders through the launch of Micro E-mini futures on the S&P 500, Nasdaq-100, Russell 2000 and Dow Jones Industrial Average indexes.
"Futures trading has been growing in popularity for active traders all over the world," says Tim McCourt, CME Group Global Head of Equity Index and Alternative Investment Products. "The smaller contract size of Micro E-mini equity index futures will make it easier to more nimbly execute a variety of equity trading strategies, while benefiting from the deep liquidity that CME Group markets offer around the clock."
Andy Jordan is the editor for Traders Notebook which shows you Futures Trading Strategies in Spreads, Options, and Swing Trades. Learn step-by-step how to trade successfully.
Traders Notebook Complete
Learn how to manage this trade by getting daily detailed trading instructions, click here!
Ambush extends its crazy rally in the Australian Dollar!
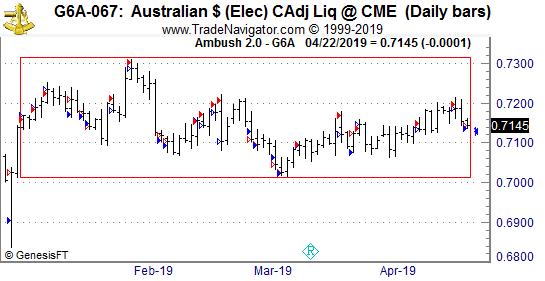
The Ambush trading method is specialised in catching intraday market tops and bottoms in a variety of Futures markets. Including the Australian Dollar Future (6A) traded at the CME, where Ambush Traders are having an amazing time so far in 2019.
Ambush day trades on an end-of-day basis so there’s no need to even check the markets during the day.
Some of you might remember the last time we had a look at the Aussie Dollar in February. Till then Ambush showed an amazing performance trading that currency in 2019. But how did things go on from there? Was it worth buying the Ambush eBook or signing up to Ambush Signals to take the following trades?
The answer is a clear YES. The 6A just kept on moving in tight ranges and has been trading between about 0.71 and 0.73 for the whole year now. Just perfect conditions for Ambush allowing the Australian Dollar to make new equity highs in its Ambush performance.
That method still was able to capture some nice profits, often getting in at the top/bottom of a day’s range!
Once you realise that this isn’t that uncommon but that it’s exactly what the markets do most of the time don’t you want a strategy that works well under such conditions?
Where is the Australian Dollar going next? For sure to either the top or the bottom of the trading range it’s in. As Ambush Traders we don’t mind, we’ll be there ready to sell to or buy from the novice traders who’ll then accelerate our profits as they got to get out of their next losing trade.
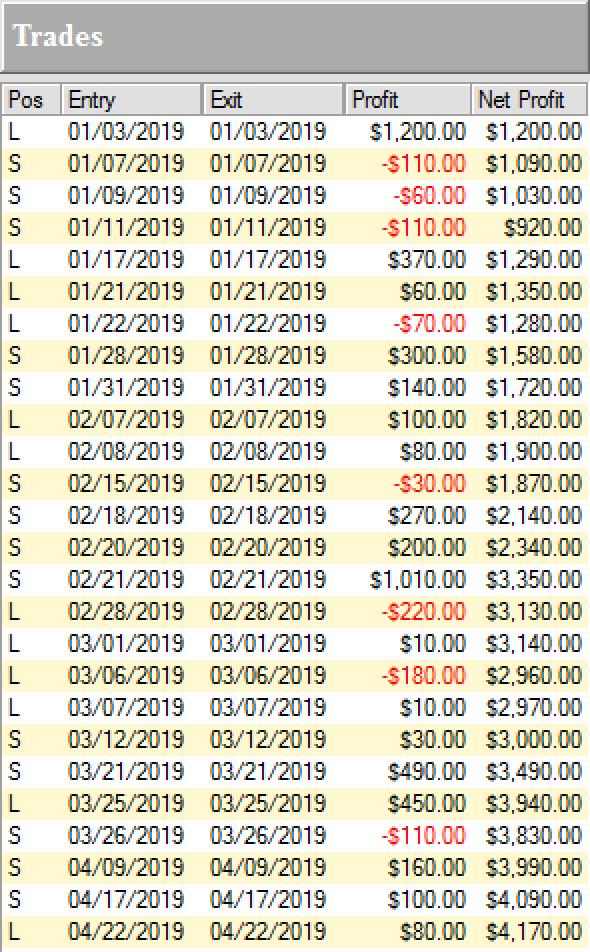
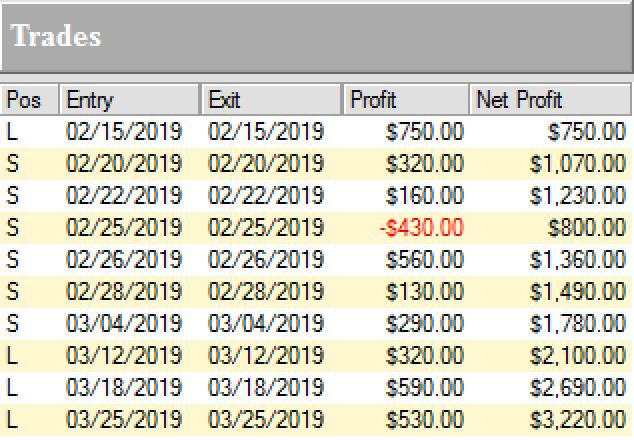
Here’s the result of all of these trades, trading one Australian Dollar Index (6A) contract, including $10 commissions/slippage per trade. We’re up over $4000 in the Aussie Dollar now, and that’s just one of many markets Ambush covers!
Now if you’ve been on the other sides of these trades trying to buy the breakouts you maybe should think about switching sides!
With Ambush Signals you can easily follow Ambush, a system specialized in catching intraday market tops and bottoms in the Futures markets!
The most popular and easiest way to follow Ambush is Ambush Signals. It does all the work for you, allows you to customise what markets you want to see and has a position sizing tool implemented to automatically adjust the positions to your risk preferences.
Each day around 6:30 pm NY Time the Signals are available for you on the Dashboard. You can then place your orders and literally walk away until the next market close! To find out more about the details of Ambush and how Ambush Signals works, have a look at the Ambush Signals Website.
Let’s be realistic. Following any System can be tough, especially in the beginning. It simply needs time to build the confidence needed to make it through inevitable drawdowns. So what if you are unlucky and don’t catch a good start right away?
I want you to succeed trading Ambush Signals, so here’s something for you that will strongly increase your odds of success and allow you to easily gain the confidence you’ll need to become a long-term profitable Ambush trader.
Did you come up with questions? Don't be shy, email Marco Mayer, he wants to hear from you! This email address is being protected from spambots. You need JavaScript enabled to view it.
To view previous published Chart Scan newsletters, please log in or click on "Join Us,"
shown above, to subscribe to our free "Members Only" section.
A WEALTH OF INFORMATION & EDUCATION:
Joe Ross-Trading Educators' popular free Chart Scan Newsletter has been published since 2004.
Note: Unless otherwise noted, all charts used in Chart Scan commentary were created
by using Genesis Financial Technologies' Trade Navigator (with permission).
Legal Notice and Copyright 2019 Disclaimer - Published by Trading Educators, Inc.
Chart Scan is a complimentary educational newsletter.
One of the better money-making trading patterns is something you might call a “quick reversal.”
These are not the easily identified major reversal bars you see at the end of a swing or trend. The one I will be describing in this issue of Chart Scan requires fast action on your part. The reversal pattern is especially good for scalping in the context of day trading.
A quick reversal is a short 1-day reversal opposite the main trend.
When the pattern is forming it looks like the market is suddenly breaking out in the opposite direction from the trend. However, as the day continues the market quickly changes direction and closes back in line with the main trend.
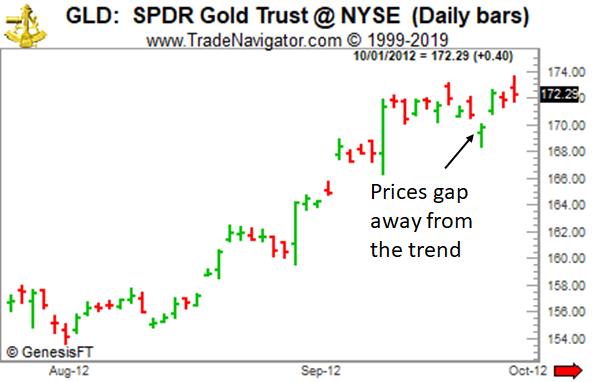
In the example below, you can see how prices gap down against the trend, and at first appear to be heading down.
However, as the day progresses buyers come into the market who feel that this is a good buying opportunity, and momentum going in the direction of the trend begins again.
This is a short term trade that's designed to take advantage of prices being temporarily out of balance.
Make sure the breakaway day closes in the upper 20 percent of the trading day.
You want to make sure momentum is coming into the market the day before your entry.
Let’s look at this on a daily chart GLD, aka, Spider Gold Trust.
You need 1-day gap away from the main trend and a close near the high of the day as the best setup for the trade.
The next day is the entry day, and this is the most important time because this strategy moves fast, and you want to make sure you don't miss the momentum coming into the market.
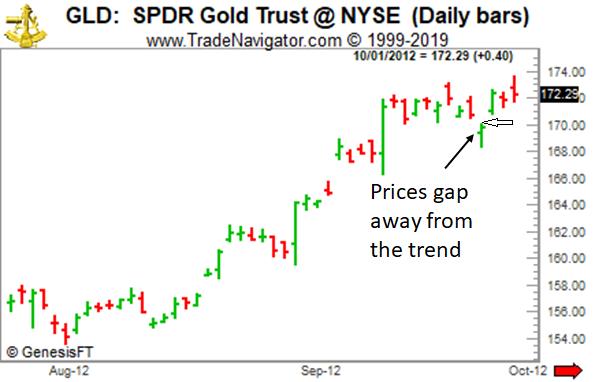
The entry point is above the high that was made on the signal bar which is the gap down bar.
The best trades get filled at or near the opening bell so you probably want to place a buy stop order just above the gap-day high price.
This way your trade will be filled automatically when the market trades above the gap high day.
One Important word of caution, do not take signals that occur after the first 2 hours of the trading day. This is a day trade so you want to make sure you have plenty of time for the trade to develop and achieve some degree of profit.
Don't limit yourself and your opportunities by day trading too late in the day when there is less profit potential and less time for trades to develop. Remember! This is a scalp trade. Take your money and run.
Jim has been holding a position for six months. A media analyst predicted the stock would hit $100 by the end of the year. He bought it at ...read more.
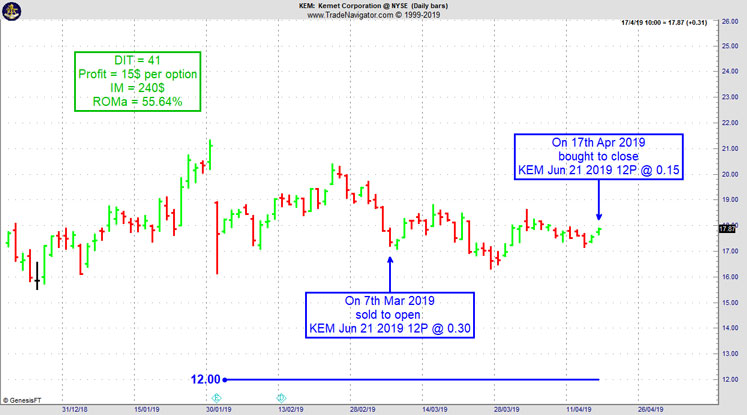
On 19th February 2019 we gave our Instant Income Guaranteed subscribers the following trade on Kemet Corporation (KEM). Price insurance could be sold as follows:
On 7th March 2019, on a GTC order, we sold to open KEM Jun 21 2019 12P @ 0.30, with 106 days until expiration with our short strike about 35% below price action, making the trade pretty safe.
On 17th April 2019, we bought to close KEM Jun 21 2019 12P @ 0.15, after 41 days in the trade.
Profit: 15$ per option
Margin: 240$
Return on Margin annualized: 55.64%
Philippe
Receive daily trade recommendations - we do the research for you.
♦ SIGN UP TODAY! WEALTH BUILDING FOR YOUR FUTURE ♦
CME Group is aiming to make equity index futures trading more accessible to active traders through the launch of Micro E-mini futures on the S&P 500, Nasdaq-100, Russell 2000 and Dow Jones Industrial Average indexes.
"Futures trading has been growing in popularity for active traders all over the world," says Tim McCourt, CME Group Global Head of Equity Index and Alternative Investment Products. "The smaller contract size of Micro E-mini equity index futures will make it easier to more nimbly execute a variety of equity trading strategies, while benefiting from the deep liquidity that CME Group markets offer around the clock."
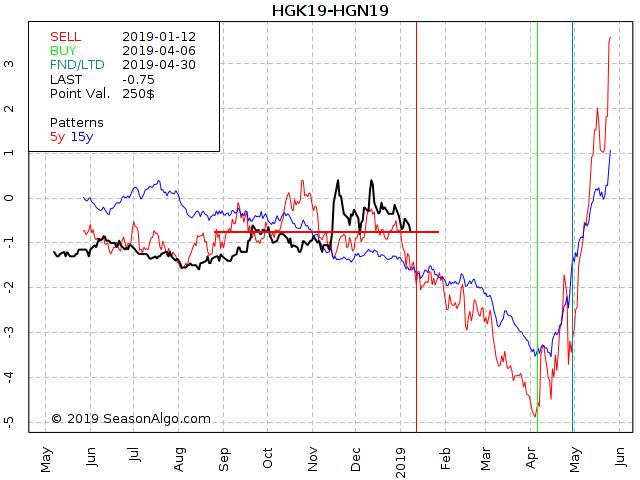
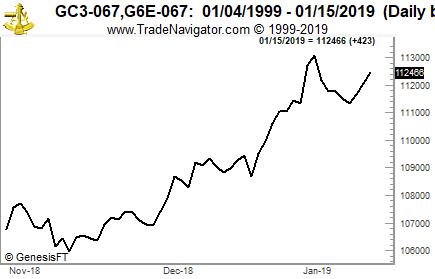
This week, we're looking at short HGK19 – HGN19: short May 2019 and long July 2019 Copper (COMEX at Globex).
Today we consider a Copper calender spread: short May 2019 and long July 2019 Copper (COMEX at Globex). The spread has been trading in a range between 0.50 and -0.90 for almost two months. Will the spread drop below the December low and will it follow its seasonal path to the down-side?
Andy Jordan is the editor for Traders Notebook which shows you Futures Trading Strategies in Spreads, Options, and Swing Trades. Learn step-by-step how to trade successfully.
Traders Notebook Complete
Learn how to manage this trade by getting daily detailed trading instructions, CLICK HERE!
Careful risk management is a key component you being able to trade at your best. Comfort level is really important when it…read more.
Andy Jordan is the editor for Traders Notebook which shows you Futures Trading Strategies in Spreads, Options, and Swing Trades. Learn step-by-step how to trade successfully.
Traders Notebook Complete
Learn how to manage this trade by getting daily detailed trading instructions, click here!
Ambush extends its crazy rally in the Australian Dollar!
The Ambush trading method is specialised in catching intraday market tops and bottoms in a variety of Futures markets. Including the Australian Dollar Future (6A) traded at the CME, where Ambush Traders are having an amazing time so far in 2019.
Ambush day trades on an end-of-day basis so there’s no need to even check the markets during the day.
Some of you might remember the last time we had a look at the Aussie Dollar in February. Till then Ambush showed an amazing performance trading that currency in 2019. But how did things go on from there? Was it worth buying the Ambush eBook or signing up to Ambush Signals to take the following trades?
The answer is a clear YES. The 6A just kept on moving in tight ranges and has been trading between about 0.71 and 0.73 for the whole year now. Just perfect conditions for Ambush allowing the Australian Dollar to make new equity highs in its Ambush performance.
That method still was able to capture some nice profits, often getting in at the top/bottom of a day’s range!
Once you realise that this isn’t that uncommon but that it’s exactly what the markets do most of the time don’t you want a strategy that works well under such conditions?
Where is the Australian Dollar going next? For sure to either the top or the bottom of the trading range it’s in. As Ambush Traders we don’t mind, we’ll be there ready to sell to or buy from the novice traders who’ll then accelerate our profits as they got to get out of their next losing trade.
Here’s the result of all of these trades, trading one Australian Dollar Index (6A) contract, including $10 commissions/slippage per trade. We’re up over $4000 in the Aussie Dollar now, and that’s just one of many markets Ambush covers!
Now if you’ve been on the other sides of these trades trying to buy the breakouts you maybe should think about switching sides!
With Ambush Signals you can easily follow Ambush, a system specialized in catching intraday market tops and bottoms in the Futures markets!
The most popular and easiest way to follow Ambush is Ambush Signals. It does all the work for you, allows you to customise what markets you want to see and has a position sizing tool implemented to automatically adjust the positions to your risk preferences.
Each day around 6:30 pm NY Time the Signals are available for you on the Dashboard. You can then place your orders and literally walk away until the next market close! To find out more about the details of Ambush and how Ambush Signals works, have a look at the Ambush Signals Website.
Let’s be realistic. Following any System can be tough, especially in the beginning. It simply needs time to build the confidence needed to make it through inevitable drawdowns. So what if you are unlucky and don’t catch a good start right away?
I want you to succeed trading Ambush Signals, so here’s something for you that will strongly increase your odds of success and allow you to easily gain the confidence you’ll need to become a long-term profitable Ambush trader.
Did you come up with questions? Don't be shy, email Marco Mayer, he wants to hear from you! This email address is being protected from spambots. You need JavaScript enabled to view it.
To view previous published Chart Scan newsletters, please log in or click on "Join Us,"
shown above, to subscribe to our free "Members Only" section.
A WEALTH OF INFORMATION & EDUCATION:
Joe Ross-Trading Educators' popular free Chart Scan Newsletter has been published since 2004.
Note: Unless otherwise noted, all charts used in Chart Scan commentary were created
by using Genesis Financial Technologies' Trade Navigator (with permission).
Legal Notice and Copyright 2019 Disclaimer - Published by Trading Educators, Inc.
Chart Scan is a complimentary educational newsletter.
Hey Joe! I suspect from my trading results that I probably should be a swing trader, but I have no idea of how to go about it. Do you have a way to use a simple method that would help me with these doggone swinging markets? Maybe something that doesn’t use indicators?
Yes, I think I can help, but there are those that laugh at the simplicity of what I’m going to show you.
One method that fits the criteria of swing trading strategies that work is relative strength, while it may sound fancy, it's just a term for looking at several related markets and seeing which one is stronger and which one is weaker. The key is to make sure there is relationship between the markets. We don’t need a relative strength indicator for this one.
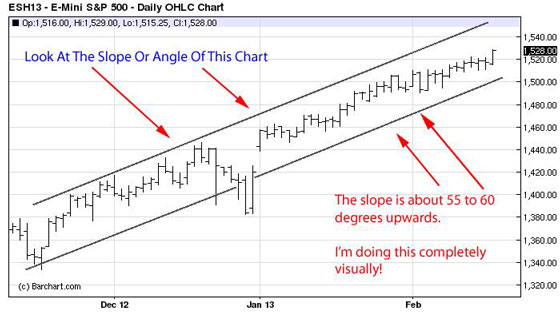
What you want to do is to find two markets that have a relationship between them. A good example would be the e-Mini S&P along with the e-Mini Nasdaq. These two markets are about 85% correlated.
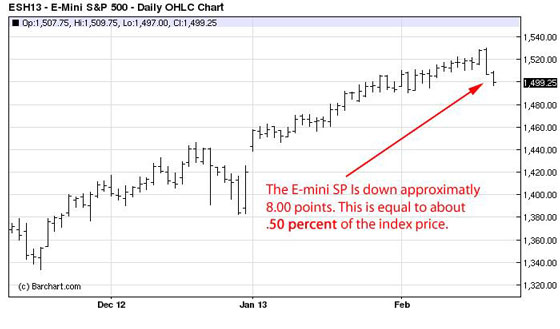
The e-Mini S&P is sloping about 55%
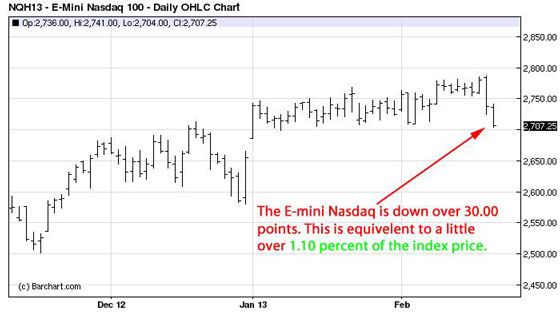
If I was to place a relative strength trade between these two contracts I would simply purchase the E-mini SP Contract and Sell the E-mini Nasdaq Futures Contract. Let's see how this would work out in reality.
Take a look at both charts as they appear on the February 21, 2013. See for yourself how it would have worked out.
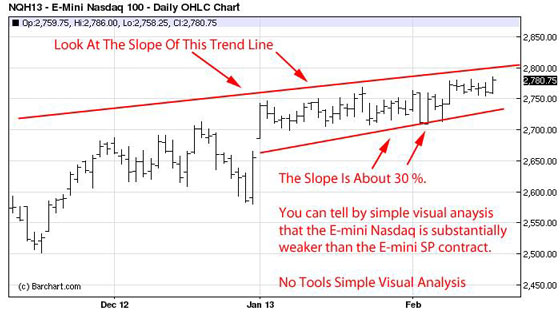
e-Mini S&P drops about half as much as e-Mini Nasdaq
Simple! All you need are your eyeballs. This is a simple observation spread. Just remember that the two markets must be closely related.
E-mini Nasdaq falls twice as hard as SP index
You can clearly see from these two charts that the E-mini Nasdaq is dropping about twice as hard as the E-mini SP Futures Contract. This is a great example of swing trading strategies that work in the real world. We simply combined visual trend analysis and took two markets that are related and compared the strength of one vs. the other.
You would simply go long the E-mini SP and you would short the E-mini Nasdaq contract at the exact same time. You can apply this same method to related stocks or other related markets. But make sure your positions are of equal size, this is very important.
Disciplined trading is critical for lasting success. Profitable trading requires a combination of skill and probabilities. The winning trader implements proven trading strategies over and over, so that across a series of trades, the law of averages works...read more.
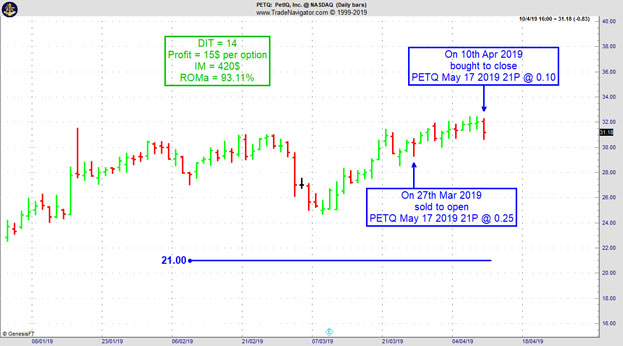
On 26th March 2019 we gave our Instant Income Guaranteed subscribers the following trade on PetIQ Inc. (PETQ). Price insurance could be sold as follows:
On 27th March 2019, we sold to open PETQ May 17 2019 21P @ 0.25, with 50 days until expiration with our short strike about 31% below price action, making the trade pretty safe.
On 10th April 2019, we bought to close PETQ May 17 2019 21P @ 0.10, after 14 days in the trade.
Profit: 15$ per option
Margin: 420$
Return on Margin annualized: 93.11%
Philippe
Receive daily trade recommendations - we do the research for you.
♦ SIGN UP TODAY! WEALTH BUILDING FOR YOUR FUTURE ♦
During ongoing activities, such as day trading, you have to learn how to pace yourself. This means…read more.
Andy Jordan is the editor for Traders Notebook which shows you Futures Trading Strategies in Spreads, Options, and Swing Trades. Learn step-by-step how to trade successfully.
Is Natural Gas back to normal?! Ambush traders have one of their cash cows back!
The Ambush trading method is specialised in catching intraday market tops and bottoms in a variety of Futures markets. Including the Natural Gas Future (NG) traded at the CME, where Ambush Traders are cashing in again lately.
Ambush day trades on an end-of-day basis so there’s no need to even check the markets during the day.
Towards the end of 2018, fundamental news caused prices in Natural Gas to go crazy with volatility levels almost 10 times above normal. This didn’t just put various funds out of business but also caused most Ambush traders to stay away from NatGas for a while.
Right now NG is trading pretty much where it traded before the hype and looks much more like the NatGas market we are used to again.
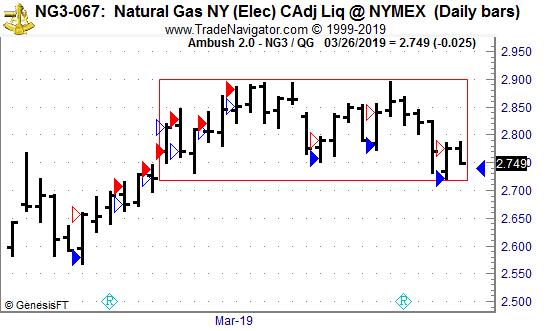
As you can see on the chart below it moves in boxes and has a lot of false intraday breakouts, perfect conditions again for Ambush:
With NatGas behaving normal again, Ambush results look great again too.
Here’s the result of all of these trades, trading one Natural Gas (NG) contract, including $10 commissions/slippage per trade:
Now if you’ve been the one making money on the crazy up-move just ask yourself how often that actually happens and if you wouldn’t rather be making money the other 95% of the time ;)
With Ambush Signals you can easily follow Ambush, a system specialized in catching intraday market tops and bottoms in the Futures markets!
The most popular and easiest way to follow Ambush is Ambush Signals. It does all the work for you, allows you to customise what markets you want to see and has a position sizing tool implemented to automatically adjust the positions to your risk preferences.
Each day around 6:30 pm NY Time the Signals are available for you on the Dashboard. You can then place your orders and literally walk away until the next market close! To find out more about the details of Ambush and how Ambush Signals works, have a look at the Ambush Signals Website.
Let’s be realistic. Following any System can be tough, especially in the beginning. It simply needs time to build the confidence needed to make it through inevitable drawdowns. So what if you are unlucky and don’t catch a good start right away?
I want you to succeed trading Ambush Signals, so here’s something for you that will strongly increase your odds of success and allow you to easily gain the confidence you’ll need to become a long-term profitable Ambush trader.
Did you come up with questions? Don't be shy, email Marco Mayer, he wants to hear from you! This email address is being protected from spambots. You need JavaScript enabled to view it.
To view previous published Chart Scan newsletters, please log in or click on "Join Us,"
shown above, to subscribe to our free "Members Only" section.
A WEALTH OF INFORMATION & EDUCATION:
Joe Ross-Trading Educators' popular free Chart Scan Newsletter has been published since 2004.
Note: Unless otherwise noted, all charts used in Chart Scan commentary were created
by using Genesis Financial Technologies' Trade Navigator (with permission).
Legal Notice and Copyright 2019 Disclaimer - Published by Trading Educators, Inc.
Chart Scan is a complimentary educational newsletter.
Hey Joe, what do they mean when they talk about “picks and shovels” companies?
"Picks and shovels" companies can make great low-risk investments. That's because these businesses provide the tools and services that support entire sectors.
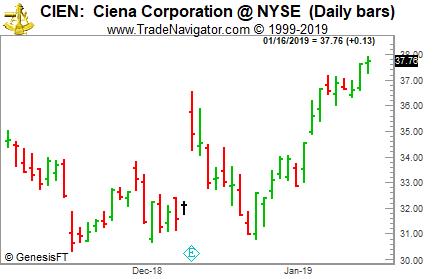
I can best answer your question with an example: Ciena (CIEN) is a $6 billion telecommunications supplier. It provides the hardware and software that runs broadband Internet, cable, and telecom networks. Although you may not have heard of Ciena, its partners include telecom giants like AT&T (T), Comcast (CMCSA), and Verizon (VZ). And as those giants compete for market share, Ciena keeps making sales... Ciena recently reported sales of more than $3 billion for the fiscal year 2018, a 10% increase from 2017.
As you can see on the chart at the time of this writing CIEN shares are up, too. The stock soared more than 60% over the past year, and it recently hit a new multiyear high. It's more proof that investing in picks-and-shovels companies is a solid strategy.
Successful trading is part reliable method and part mental edge. Without a sound set of methods and financial resources, it is impossible to trade profitably. Your method should also have a good track record, and it is essential to have enough capital to allow your method to work in terms of realistic position sizes and the number of losing trades you can afford to take before you hit upon a winning streak. But method is only part of the equation. You also need to approach trading with the proper mindset.
Trading can be a matter of probabilities. Even when you have accounted for all possibilities, there are times when the circumstances don't match up with your trading plan and you end up with a losing trade. For example, a company may miss earnings expectations, and from studying the products of the competition, you can arrive at the astute conclusion that the company's stock price is destined to decline. You buy to cover. But what you didn't account for was a popular media analyst talking up the stock and claiming that it was bound to hit new highs in the next quarter. The masses act on the report and the price goes up. What can you do? Rather than kick yourself for being wrong, it is prudent to take it in stride and move on. Trading the markets with assurance can be a matter of probabilities. You have to go where the markets take you and accept what happens. You cannot impose your will onto the markets, and when things don't go your way, you cannot take it personally.
Why do we take setbacks personally? Many times, it is how we look at the situation that dictates how we will feel about it. When we believe a setback happens because it was our fault, and circumstances cannot be changed, we will take the setback personally. A trader might think, for example, "I don't have the natural ability to make it as a trader. It's not the markets, it is me, and I will never master the markets." Psychologists call this kind of thinking "helpless prone." When we make a failure a big deal, we cannot help but feel pessimistic and helpless. Instead of falling prey to a sense of hopelessness, you need to develop an action-based, realistic plan for overcoming obstacles. You must work under the assumption that you can achieve your goals if you put in enough time and effort. What is wonderful about the trading profession is that it is only about the markets and you. There is no supervisors or customers to please. It's not about overcoming interpersonal or institutional factors.
Accept personal responsibility when appropriate. The method you use to trade the markets is your responsibility. You must decide to use a sound method. You must decide to carefully manage risk to ensure your long-term survival. You must decide to put in the necessary effort to find high probability setups. But you can't control the market action. You can't control how much public interest there will be in the market you are trading. You can't control the extent that unexpected news or unexpected world events may influence prices. Assuming you can control everything will make you "helpless prone." Once you have taken every precaution and trade with a sound method, you can limit the amount of risk on each trade and make a profit across a series of trades. Rather than mull over the outcome of a single trade, you can coolly move on to the next trade. And when you take losses and setbacks in stride, you will be more likely to trade freely, creatively, and profitably.
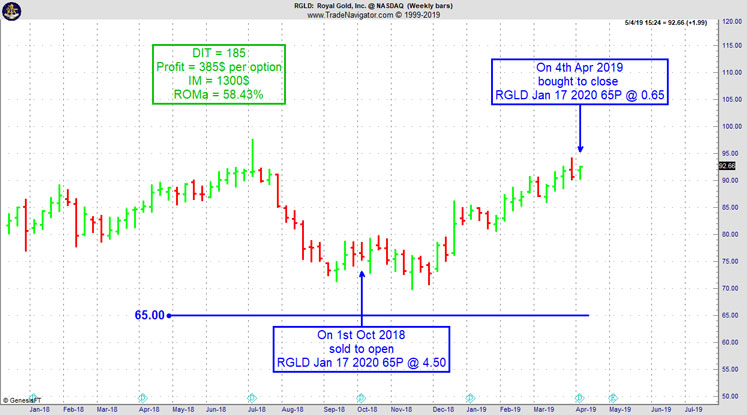
On 1st October 2018 we gave our Instant Income Guaranteed subscribers the following trade on Royal Gold Inc. (RGLD). Commercials had just become net long gold futures for the first time since 2001. Price insurance could be sold as follows:
On 1st October 2018, we sold to open RGLD Jan 17 2020 65P @ 4.50, with 466 days until expiration with our short strike about 15% below price action.
On 4th April 2019, we bought to close RGLD Jan 17 2020 65P @ 0.65, after 185 days in the trade for a nice profit of 385$ per option
This trade went comfortably through the sharp correction in December 2018.
Profit: 385$ per option
Margin: 1300$
Return on Margin annualized: 58.43%
Philippe
Receive daily trade recommendations - we do the research for you.
♦ SIGN UP TODAY! WEALTH BUILDING FOR YOUR FUTURE ♦
Trading Article: Trading In One Market Than In Many
Develop a relationship with that market, as though it was one of your best friends. Know the market's personality and feel its…read more.
Andy Jordan is the editor for Traders Notebook which shows you Futures Trading Strategies in Spreads, Options, and Swing Trades. Learn step-by-step how to trade successfully.
Is Natural Gas back to normal?! Ambush traders have one of their cash cows back!
The Ambush trading method is specialised in catching intraday market tops and bottoms in a variety of Futures markets. Including the Natural Gas Future (NG) traded at the CME, where Ambush Traders are cashing in again lately.
Ambush day trades on an end-of-day basis so there’s no need to even check the markets during the day.
Towards the end of 2018, fundamental news caused prices in Natural Gas to go crazy with volatility levels almost 10 times above normal. This didn’t just put various funds out of business but also caused most Ambush traders to stay away from NatGas for a while.
Right now NG is trading pretty much where it traded before the hype and looks much more like the NatGas market we are used to again.
As you can see on the chart below it moves in boxes and has a lot of false intraday breakouts, perfect conditions again for Ambush:
With NatGas behaving normal again, Ambush results look great again too.
Here’s the result of all of these trades, trading one Natural Gas (NG) contract, including $10 commissions/slippage per trade:
Now if you’ve been the one making money on the crazy up-move just ask yourself how often that actually happens and if you wouldn’t rather be making money the other 95% of the time ;)
With Ambush Signals you can easily follow Ambush, a system specialized in catching intraday market tops and bottoms in the Futures markets!
The most popular and easiest way to follow Ambush is Ambush Signals. It does all the work for you, allows you to customise what markets you want to see and has a position sizing tool implemented to automatically adjust the positions to your risk preferences.
Each day around 6:30 pm NY Time the Signals are available for you on the Dashboard. You can then place your orders and literally walk away until the next market close! To find out more about the details of Ambush and how Ambush Signals works, have a look at the Ambush Signals Website.
Let’s be realistic. Following any System can be tough, especially in the beginning. It simply needs time to build the confidence needed to make it through inevitable drawdowns. So what if you are unlucky and don’t catch a good start right away?
I want you to succeed trading Ambush Signals, so here’s something for you that will strongly increase your odds of success and allow you to easily gain the confidence you’ll need to become a long-term profitable Ambush trader.
Did you come up with questions? Don't be shy, email Marco Mayer, he wants to hear from you! This email address is being protected from spambots. You need JavaScript enabled to view it.
To view previous published Chart Scan newsletters, please log in or click on "Join Us,"
shown above, to subscribe to our free "Members Only" section.
A WEALTH OF INFORMATION & EDUCATION:
Joe Ross-Trading Educators' popular free Chart Scan Newsletter has been published since 2004.
Note: Unless otherwise noted, all charts used in Chart Scan commentary were created
by using Genesis Financial Technologies' Trade Navigator (with permission).
Legal Notice and Copyright 2019 Disclaimer - Published by Trading Educators, Inc.
Chart Scan is a complimentary educational newsletter.
Feel free to email Andy Jordan, This email address is being protected from spambots. You need JavaScript enabled to view it., with any questions about Traders Notebook
Sign up today to start receiving Andy's daily advisory newsletter
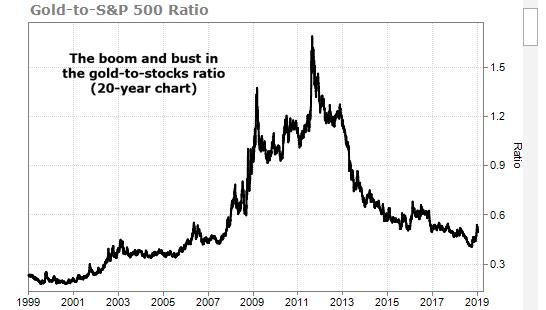
I’ve been asked many times whether or not someone should buy gold. This is especially true of people who are using a currency that is not the US dollar. What you need to look at is whether or not gold is rising or falling in terms of the currency you use for everyday living. You can easily determine which way gold is moving by looking at the ratio between your local currency compared with gold.
If it’s costing more and more of your local currency to buy an ounce of gold, then gold is in an uptrend for you, and you should consider buying it. For example, if I take the price of gold and divide it by the price of the euro, I can see that in terms of the euro gold is in an uptrend.
It is taking more and more euros to buy an ounce of gold.
Please realize that what we are showing is gold in terms of a currency. However, gold can be measured in terms of just about anything. What if we looked at gold vs the S&P 500 over a period of 20 years? Until just a short time ago, gold was in a downtrend relative to the S&P 500.
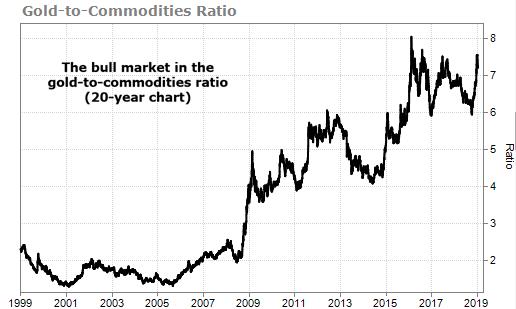
What if we look at gold compared with other commodities? How is gold doing from that view point.
I suppose we can say that how gold is doing, is relative to the context in which you are looking.
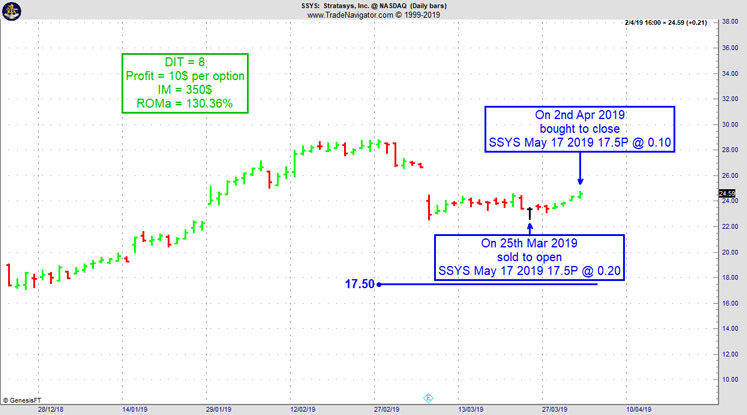
On 19th March 2019 we gave our Instant Income Guaranteed subscribers the following trade on Stratasys Inc. (SSYS). Price insurance could be sold as follows:
On 25th March 2019, on a GTC order, we sold to open SSYS May 17 2019 6P @ 0.20, with 52 days until expiration with our short strike about 27% below price action.
On 2nd April 2019, we bought to close SSYS May 17 2019 6P @ 0.10, after 8 days in the trade for quick premium compounding.
Profit: 10$ per option
Margin: 350$
Return on Margin annualized: 130.36%
Philippe
Receive daily trade recommendations - we do the research for you.
♦ SIGN UP TODAY! WEALTH BUILDING FOR YOUR FUTURE ♦
Feel free to email Andy Jordan, This email address is being protected from spambots. You need JavaScript enabled to view it., with any questions about Traders Notebook
Sign up today to start receiving Andy's daily advisory newsletter
It is critical to develop a well thought out and organized trading plan. It is then important to have…read more.
Andy Jordan is the editor for Traders Notebook which shows you Futures Trading Strategies in Spreads, Options, and Swing Trades. Learn step-by-step how to trade successfully.
Is Natural Gas back to normal?! Ambush traders have one of their cash cows back!
The Ambush trading method is specialised in catching intraday market tops and bottoms in a variety of Futures markets. Including the Natural Gas Future (NG) traded at the CME, where Ambush Traders are cashing in again lately.
Ambush day trades on an end-of-day basis so there’s no need to even check the markets during the day.
Towards the end of 2018, fundamental news caused prices in Natural Gas to go crazy with volatility levels almost 10 times above normal. This didn’t just put various funds out of business but also caused most Ambush traders to stay away from NatGas for a while.
Right now NG is trading pretty much where it traded before the hype and looks much more like the NatGas market we are used to again.
As you can see on the chart below it moves in boxes and has a lot of false intraday breakouts, perfect conditions again for Ambush:
With NatGas behaving normal again, Ambush results look great again too.
Here’s the result of all of these trades, trading one Natural Gas (NG) contract, including $10 commissions/slippage per trade:
Now if you’ve been the one making money on the crazy up-move just ask yourself how often that actually happens and if you wouldn’t rather be making money the other 95% of the time ;)
With Ambush Signals you can easily follow Ambush, a system specialized in catching intraday market tops and bottoms in the Futures markets!
The most popular and easiest way to follow Ambush is Ambush Signals. It does all the work for you, allows you to customise what markets you want to see and has a position sizing tool implemented to automatically adjust the positions to your risk preferences.
Each day around 6:30 pm NY Time the Signals are available for you on the Dashboard. You can then place your orders and literally walk away until the next market close! To find out more about the details of Ambush and how Ambush Signals works, have a look at the Ambush Signals Website.
Let’s be realistic. Following any System can be tough, especially in the beginning. It simply needs time to build the confidence needed to make it through inevitable drawdowns. So what if you are unlucky and don’t catch a good start right away?
I want you to succeed trading Ambush Signals, so here’s something for you that will strongly increase your odds of success and allow you to easily gain the confidence you’ll need to become a long-term profitable Ambush trader.
Did you come up with questions? Don't be shy, email Marco Mayer, he wants to hear from you! This email address is being protected from spambots. You need JavaScript enabled to view it.
Feel free to email Andy Jordan, This email address is being protected from spambots. You need JavaScript enabled to view it., with any questions about Traders Notebook
Sign up today to start receiving Andy's daily advisory newsletter
To view previous published Chart Scan newsletters, please log in or click on "Join Us,"
shown above, to subscribe to our free "Members Only" section.
A WEALTH OF INFORMATION & EDUCATION:
Joe Ross-Trading Educators' popular free Chart Scan Newsletter has been published since 2004.
Note: Unless otherwise noted, all charts used in Chart Scan commentary were created
by using Genesis Financial Technologies' Trade Navigator (with permission).
Legal Notice and Copyright 2019 Disclaimer - Published by Trading Educators, Inc.
Chart Scan is a complimentary educational newsletter.
"Teach our students the truth in trading - teach them how to trade,"
and
"Give them a way to earn while they learn - realizing that it takes time to develop a successful trader."
Derivative transactions, including futures, are complex and carry a high degree of risk. They are intended for sophisticated investors and are not suitable for everyone.
There are numerous other factors related to the markets in general or to the implementation of any specific trading program which cannot be
fully accounted for in the preparation of hypothetical performance results, and all of which can adversely affect actual trading results.
For more information, see the Risk Disclosure Statement for Futures and Options.