Trades in Stock Options. Receive daily trade recommendations. Can you imagine discovering a way to trade that promises instant income? If you think such a method is impossible, think again. It is definitely achievable, and everything you need to know is available online for one low price that includes special three-part online webinars.
Ambush is a time-proven mean-reversion day trading System focused on a variety of Futures markets around the globe. With Ambush Signals you can now easily follow the Ambush System on a subscription basis for educational purposes.
If you didn't fail early in your trading business, then you have probably been around long enough to realize that many of the problems you encounter as a trader are those that derive from your own individuality. Such problems are common among traders and, in fact, common among all human beings. Seeking spiritual help from a power much greater than your own is the area I address in the "Spiritual Side of Trading".
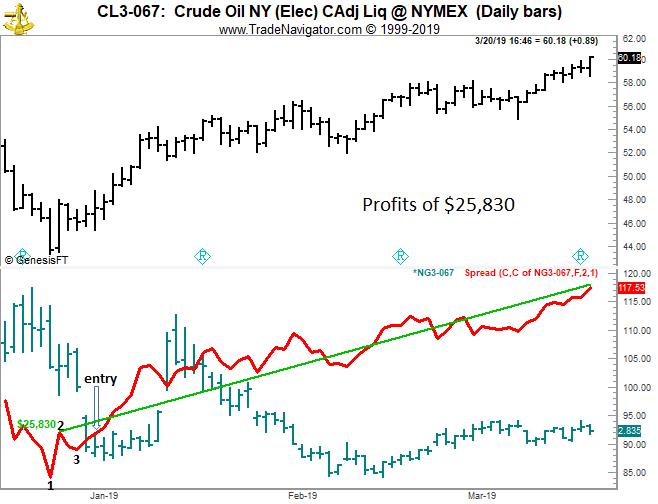
Crude Oil has been outpacing Natural Gas since the beginning of 2019. A spread long CL and short NG continues to earn steady profits. It’s not unusual for a spread to trend much longer than the underlying commodities, which tend to swing wildly as you see with the lower NG graph on the chart below.
Spreads take a lot of the volatility out of trading the markets. The CL-NG spread began with nice 1-2-3 low on the chart. From the point of breakout to the day this chart was recorded the spread has earned $25,830. If you’re missing these trades in favor of getting your butt kicked on a 5 minute e-Mini S&P chart, you need to think things through….again!
Fear and greed drive market action. We enthusiastically put on trades when we think a huge profit is assured, but when we see the market shift dramatically, we get out as quickly as possible. We fear being trampled by the masses as they all rush to sell. Fear and greed are powerful emotions that underlie the actions of the masses, but behavioral economists argue...read more.
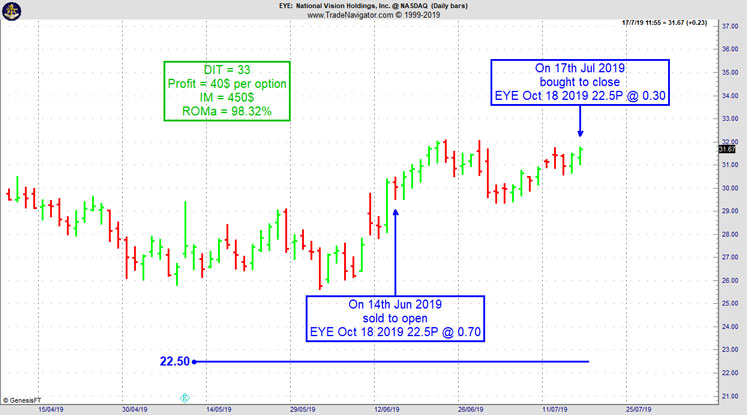
On 13th June 2019 we gave our Instant Income Guaranteed subscribers the following trade on National Vision Holdings Inc. (EYE). Price insurance could be sold as follows:
On 14th June 2019, we sold to open EYE Oct 18 2019 22.5P @ 0.70, with 124 days until expiration and our short strike about 26% below price action.
On 17th July 2019, we bought to close EYE Oct 18 2019 22.5P @ 0.30, after 33 days in the trade.
Profit: 40$ per option
Margin: 450$
Return on Margin annualized: 98.32%
Philippe
Receive daily trade recommendations - we do the research for you.
♦ SIGN UP TODAY! WEALTH BUILDING FOR YOUR FUTURE ♦
Because we don't know what "successful" means to every individual, we should divide traders into different groups. I think most traders can be found in one of the following groups: Group One - these are mainly traders new in the...read more.
Andy Jordan is the editor for Traders Notebook which shows you Futures Trading Strategies in Spreads, Options, and Swing Trades. Learn step-by-step how to trade successfully.
Traders Notebook Complete
Learn how to manage this trade by getting daily detailed trading instructions, click here!
The Russell 2000 is simply too easy to trade right now!
The Ambush trading method is specialised in catching intraday market tops and bottoms in a variety of Futures markets. Including the Russell 2000 Mini Future (RTY/M2K) traded at the CME, where Ambush Traders keep on cashing in big time again over the last couple of months!
Ambush day trades on an end-of-day basis so there’s no need to even check the markets during the day.
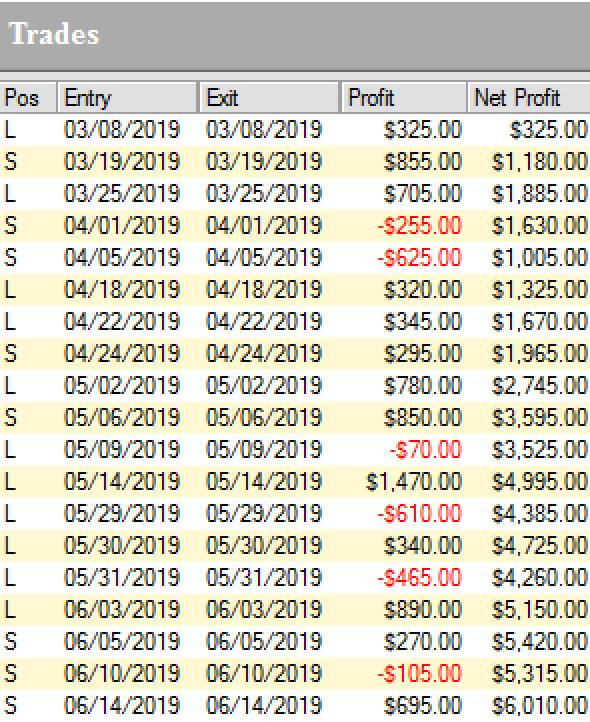
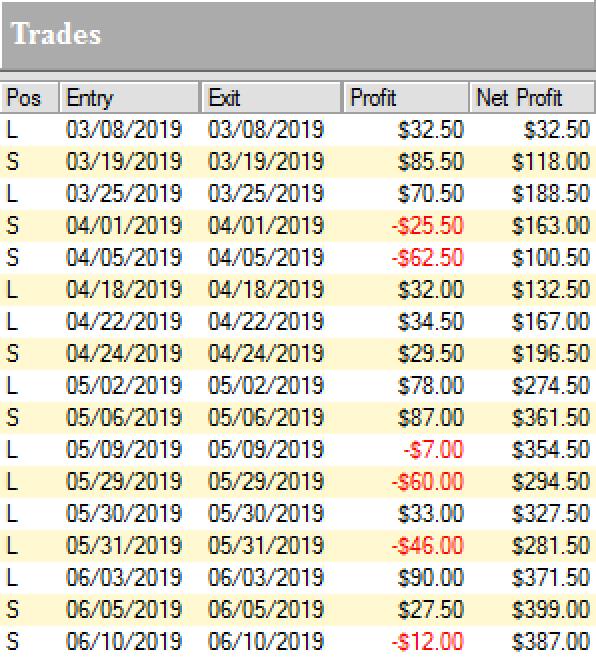
The Russell 2000 a very popular market out there among traders. It has two of the most important things private traders are looking for liquidity and volatility. I won’t even include a daily chart here as it does look quite boring. To keep it brief, the Russell is trading in a wide range for a long time now. Perfect conditions for Ambush and so this has paid out big time, here are all the recent trades:
Yes, that’s over $6000 within just three month and not even 20 trades! Which means Ambush traders made over $300 on average per trade doing nothing more than placing one entry order per day. I guess most active day traders made a lot less…but their brokers rich!
Now those are huge amounts if you have a small account and you might not want to make or lose hundreds or dollars per trade. Thanks to the new Micro Russell 2000 Mini Contracts (M2K) this is not an issue anymore. You can trade these with a small account now. Here are the results trading one M2K contract:
If that is not enough bang for the buck simply size it up and trade two contracts or three. It’s so great now you can position size as you like exactly matching your risk preferences!
In either case you have to ask yourself if you really can afford to miss out on these trades!
So whether you’re trading a $10k account or a $100k account, Ambush has the right markets for you to start following the signals.
Again, ask yourself if you really can afford to miss out on these trades or at least be aware of the signals? Now if you’ve been on the other sides of these trades trying to buy the breakouts you maybe should think about switching sides?
With Ambush Signals you can easily follow Ambush, a system specialized in catching intraday market tops and bottoms in the Futures markets!
The most popular and easiest way to follow Ambush is Ambush Signals. It does all the work for you, allows you to customise what markets you want to see and has a position sizing tool implemented to automatically adjust the positions to your risk preferences.
Each day around 6:30 pm NY Time the Signals are available for you on the Dashboard. You can then place your orders and literally walk away until the next market close! To find out more about the details of Ambush and how Ambush Signals works, have a look at the Ambush Signals Website.
Let’s be realistic. Following any System can be tough, especially in the beginning. It simply needs time to build the confidence needed to make it through inevitable drawdowns. So what if you are unlucky and don’t catch a good start right away?
I want you to succeed trading Ambush Signals, so here’s something for you that will strongly increase your odds of success and allow you to easily gain the confidence you’ll need to become a long-term profitable Ambush trader.
Did you come up with questions? Don't be shy, email Marco Mayer, he wants to hear from you! This email address is being protected from spambots. You need JavaScript enabled to view it.
To view previous published Chart Scan newsletters, please log in or click on "Join Us,"
shown above, to subscribe to our free "Members Only" section.
A WEALTH OF INFORMATION & EDUCATION:
Joe Ross-Trading Educators' popular free Chart Scan Newsletter has been published since 2004.
Note: Unless otherwise noted, all charts used in Chart Scan commentary were created
by using Genesis Financial Technologies' Trade Navigator (with permission).
Legal Notice and Copyright 2019 Disclaimer - Published by Trading Educators, Inc.
Chart Scan is a complimentary educational newsletter.
Chart Scan with Commentary: BBs as a Momentum Indicator
One of my earliest uses of an indicator came about in the 1980s, when John Bollinger invented his Bollinger Bands (BBs). To tell the truth, it was superior to almost every other method of creating a price envelope because instead of the trader guessing where to place the envelope outer bands, BBs allow the bands to be set at least partially by actual price volatility. The trader has only to decide how many bars are to be used for the moving average, and the trader decides at what level to set the Standard Deviation (STD).
I began to use the BBs as an overbought, oversold indicator, typically together with a reversal bar, which I called a Gimmee Bar. When I saw a reversal bar with prices at one of the outer bands, I knew it was just a matter of time until prices reverted to the moving average line. Statistics show that sooner or later prices will revert to the Mean. I’m not a statistician, nor am I much of a mathematician, but my experience was that Gimmee Bars worked around 80% of the time.
However, I always wondered if there might be another way to use the BBs. Could BBs tell me when to make a momentum trade? What would such a setup look like?
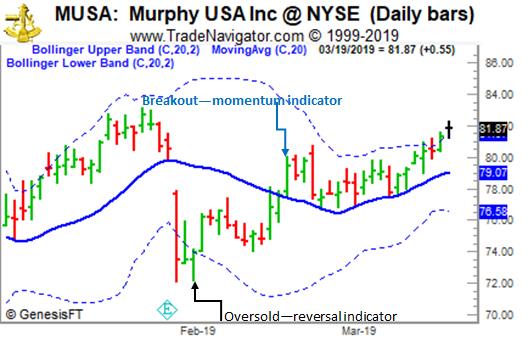
The chart above gives you a very good picture of how to use BBs as a momentum indicator.
First, in February, we see prices exceed the lower outer band which I set at 2 STD distant from a moving average of 20 bars. Any time frame can be used—in this case we have a daily chart.
We see that at the lower band there was a reversal bar (Gimmee Bar).
In about mid-February, after having reversed direction, we see prices break and close above the moving average. That was the momentum indicator. Entry is at the high of the momentum bar, and the stop is trailed below the moving average. You tighten the stop when prices hit the upper band in anticipation of an imminent reversal to the downside. Success rate for this kind of trade is around 80%.
Have you ever been so excited about a trade that you couldn't sleep at night? Or perhaps you are trying to dig yourself out of a hole and worry has taken a toll. Studies of disasters, ranging from major environmental catastrophes to minor laboratory accidents, happen when people are under ...read more.
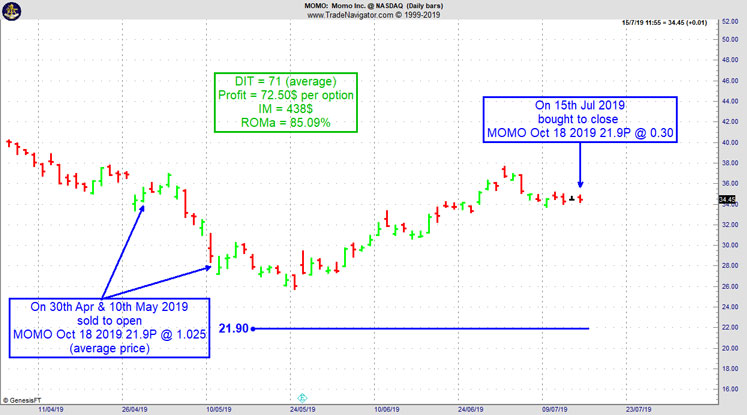
On 30th April 2019 we gave our Instant Income Guaranteed subscribers the following trade on Momo Inc. (MOMO). Price insurance could be sold as follows:
On 30th April 2019, and on 10th May 2019 on a GTC order, we sold to open MOMO Oct 18 2019 21.9P @ 1.025 (average price), with 167 days until expiration and our short strike about 38% below price action initially.
On 15th July 2019, we bought to close MOMO Oct 18 2019 21.9P @ 0.30, after 71 days in the trade on average
Profit: 72.50$ per option
Margin: 438$
Return on Margin annualized: 85.09%
Philippe
Receive daily trade recommendations - we do the research for you.
♦ SIGN UP TODAY! WEALTH BUILDING FOR YOUR FUTURE ♦
Don't get irritated or angered because you haven't put on a new trade in a long time. Whenever there is nothing to trade, don't trade. Accept it and stay on the "sideline." There will be …read more.
Andy Jordan is the editor for Traders Notebook which shows you Futures Trading Strategies in Spreads, Options, and Swing Trades. Learn step-by-step how to trade successfully.
Traders Notebook Complete
Learn how to manage this trade by getting daily detailed trading instructions, click here!
The Russell 2000 is simply too easy to trade right now!
The Ambush trading method is specialised in catching intraday market tops and bottoms in a variety of Futures markets. Including the Russell 2000 Mini Future (RTY/M2K) traded at the CME, where Ambush Traders keep on cashing in big time again over the last couple of months!
Ambush day trades on an end-of-day basis so there’s no need to even check the markets during the day.
The Russell 2000 a very popular market out there among traders. It has two of the most important things private traders are looking for liquidity and volatility. I won’t even include a daily chart here as it does look quite boring. To keep it brief, the Russell is trading in a wide range for a long time now. Perfect conditions for Ambush and so this has paid out big time, here are all the recent trades:
Yes, that’s over $6000 within just three month and not even 20 trades! Which means Ambush traders made over $300 on average per trade doing nothing more than placing one entry order per day. I guess most active day traders made a lot less…but their brokers rich!
Now those are huge amounts if you have a small account and you might not want to make or lose hundreds or dollars per trade. Thanks to the new Micro Russell 2000 Mini Contracts (M2K) this is not an issue anymore. You can trade these with a small account now. Here are the results trading one M2K contract:
If that is not enough bang for the buck simply size it up and trade two contracts or three. It’s so great now you can position size as you like exactly matching your risk preferences!
In either case you have to ask yourself if you really can afford to miss out on these trades!
So whether you’re trading a $10k account or a $100k account, Ambush has the right markets for you to start following the signals.
Again, ask yourself if you really can afford to miss out on these trades or at least be aware of the signals? Now if you’ve been on the other sides of these trades trying to buy the breakouts you maybe should think about switching sides?
With Ambush Signals you can easily follow Ambush, a system specialized in catching intraday market tops and bottoms in the Futures markets!
The most popular and easiest way to follow Ambush is Ambush Signals. It does all the work for you, allows you to customise what markets you want to see and has a position sizing tool implemented to automatically adjust the positions to your risk preferences.
Each day around 6:30 pm NY Time the Signals are available for you on the Dashboard. You can then place your orders and literally walk away until the next market close! To find out more about the details of Ambush and how Ambush Signals works, have a look at the Ambush Signals Website.
Let’s be realistic. Following any System can be tough, especially in the beginning. It simply needs time to build the confidence needed to make it through inevitable drawdowns. So what if you are unlucky and don’t catch a good start right away?
I want you to succeed trading Ambush Signals, so here’s something for you that will strongly increase your odds of success and allow you to easily gain the confidence you’ll need to become a long-term profitable Ambush trader.
Did you come up with questions? Don't be shy, email Marco Mayer, he wants to hear from you! This email address is being protected from spambots. You need JavaScript enabled to view it.
To view previous published Chart Scan newsletters, please log in or click on "Join Us,"
shown above, to subscribe to our free "Members Only" section.
A WEALTH OF INFORMATION & EDUCATION:
Joe Ross-Trading Educators' popular free Chart Scan Newsletter has been published since 2004.
Note: Unless otherwise noted, all charts used in Chart Scan commentary were created
by using Genesis Financial Technologies' Trade Navigator (with permission).
Legal Notice and Copyright 2019 Disclaimer - Published by Trading Educators, Inc.
Chart Scan is a complimentary educational newsletter.
Joe! Does classical chart analysis still work in today’s crazy markets? I wonder how it could be when you consider the volatility in the markets, the insane political situation, and the amount of not-knowing what the Fed will do next!
Human behavior remains quite consistent even in seemingly crazy markets. Markets are driven by human emotion. That’s why trading is an art form and not really scientific or mathematical.
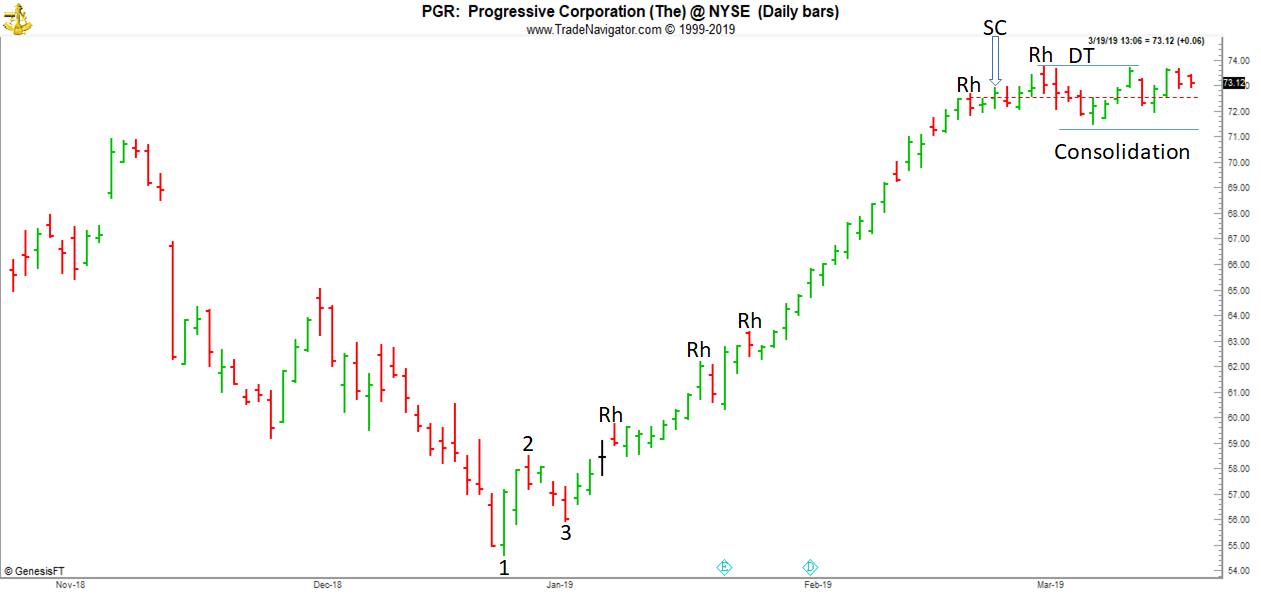
Take a look at the following chart. It is current as of March of 2019. As you will see, it is as classical as it could possibly be.
Classic 1-2-3 low, followed by Ross Hooks, formed a double top (DT), while in consolidation (SC). The hollow arrow shows where consolidation started. It is the furthest bar back that most typifies prices during the consolidation. Prices have been in consolidation for 17 bars. The red dotted line is half-way between the low and the high of consolidation, which is the vertical center of the consolidation. The DT could very well be the beginning of a turn in trend. However, it is not clear yet which way prices will break out.
The winning trader stays ahead of the crowd. In ever-changing market conditions, you have to think of new, innovative trading ideas. But it isn't always easy. There are times when you feel mentally stuck and unable to think creatively. When you are feeling....read more.
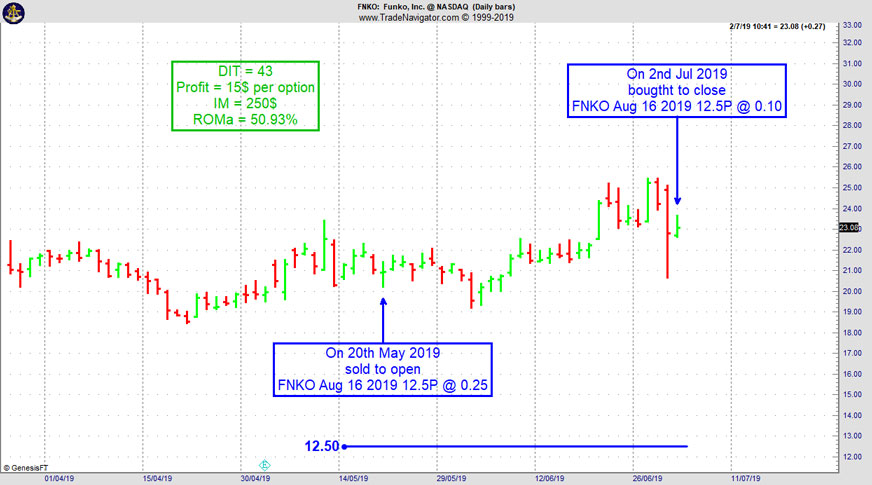
On 15th May 2019 we gave our Instant Income Guaranteed subscribers the following trade on Funko Inc. (FNKO). Price insurance could be sold as follows:
On 20th May 2019, on a GTC order, we sold to open FNKO Aug 16 2019 12.5P @ 0.25, with 86 days until expiration and our short strike about 42% below price action, making the trade very safe.
On 2nd June 2019, we bought to close FNKO Aug 16 2019 12.5P @ 0.10, after 43 days in the trade.
Profit: 15$ per option
Margin: 250$
Return on Margin annualized: 50.93%
Philippe
Receive daily trade recommendations - we do the research for you.
♦ SIGN UP TODAY! WEALTH BUILDING FOR YOUR FUTURE ♦
Trading Article: I just can’t seem to accept uncertainty and risk. What can I do?
I’ll try to give you a few things to think about, but unless you can overcome your inability to accept risk, you don’t have much of a chance to make it as a trader.
Trading and risk are virtually one and the same. Shorter-term trading isn't about …read more.
Andy Jordan is the editor for Traders Notebook which shows you Futures Trading Strategies in Spreads, Options, and Swing Trades. Learn step-by-step how to trade successfully.
Traders Notebook Complete
Learn how to manage this trade by getting daily detailed trading instructions, click here!
The Russell 2000 is simply too easy to trade right now!
The Ambush trading method is specialised in catching intraday market tops and bottoms in a variety of Futures markets. Including the Russell 2000 Mini Future (RTY/M2K) traded at the CME, where Ambush Traders keep on cashing in big time again over the last couple of months!
Ambush day trades on an end-of-day basis so there’s no need to even check the markets during the day.
The Russell 2000 a very popular market out there among traders. It has two of the most important things private traders are looking for liquidity and volatility. I won’t even include a daily chart here as it does look quite boring. To keep it brief, the Russell is trading in a wide range for a long time now. Perfect conditions for Ambush and so this has paid out big time, here are all the recent trades:
Yes, that’s over $6000 within just three month and not even 20 trades! Which means Ambush traders made over $300 on average per trade doing nothing more than placing one entry order per day. I guess most active day traders made a lot less…but their brokers rich!
Now those are huge amounts if you have a small account and you might not want to make or lose hundreds or dollars per trade. Thanks to the new Micro Russell 2000 Mini Contracts (M2K) this is not an issue anymore. You can trade these with a small account now. Here are the results trading one M2K contract:
If that is not enough bang for the buck simply size it up and trade two contracts or three. It’s so great now you can position size as you like exactly matching your risk preferences!
In either case you have to ask yourself if you really can afford to miss out on these trades!
So whether you’re trading a $10k account or a $100k account, Ambush has the right markets for you to start following the signals.
Again, ask yourself if you really can afford to miss out on these trades or at least be aware of the signals? Now if you’ve been on the other sides of these trades trying to buy the breakouts you maybe should think about switching sides?
With Ambush Signals you can easily follow Ambush, a system specialized in catching intraday market tops and bottoms in the Futures markets!
The most popular and easiest way to follow Ambush is Ambush Signals. It does all the work for you, allows you to customise what markets you want to see and has a position sizing tool implemented to automatically adjust the positions to your risk preferences.
Each day around 6:30 pm NY Time the Signals are available for you on the Dashboard. You can then place your orders and literally walk away until the next market close! To find out more about the details of Ambush and how Ambush Signals works, have a look at the Ambush Signals Website.
Let’s be realistic. Following any System can be tough, especially in the beginning. It simply needs time to build the confidence needed to make it through inevitable drawdowns. So what if you are unlucky and don’t catch a good start right away?
I want you to succeed trading Ambush Signals, so here’s something for you that will strongly increase your odds of success and allow you to easily gain the confidence you’ll need to become a long-term profitable Ambush trader.
Did you come up with questions? Don't be shy, email Marco Mayer, he wants to hear from you! This email address is being protected from spambots. You need JavaScript enabled to view it.
To view previous published Chart Scan newsletters, please log in or click on "Join Us,"
shown above, to subscribe to our free "Members Only" section.
A WEALTH OF INFORMATION & EDUCATION:
Joe Ross-Trading Educators' popular free Chart Scan Newsletter has been published since 2004.
Note: Unless otherwise noted, all charts used in Chart Scan commentary were created
by using Genesis Financial Technologies' Trade Navigator (with permission).
Legal Notice and Copyright 2019 Disclaimer - Published by Trading Educators, Inc.
Chart Scan is a complimentary educational newsletter.
Hey Joe! I brought up an old chart the other day, and it had a pattern on it that I’ve seen many times before. I’m never sure quite what it means, but surely it is telling us something. Would you please comment? Thanks.
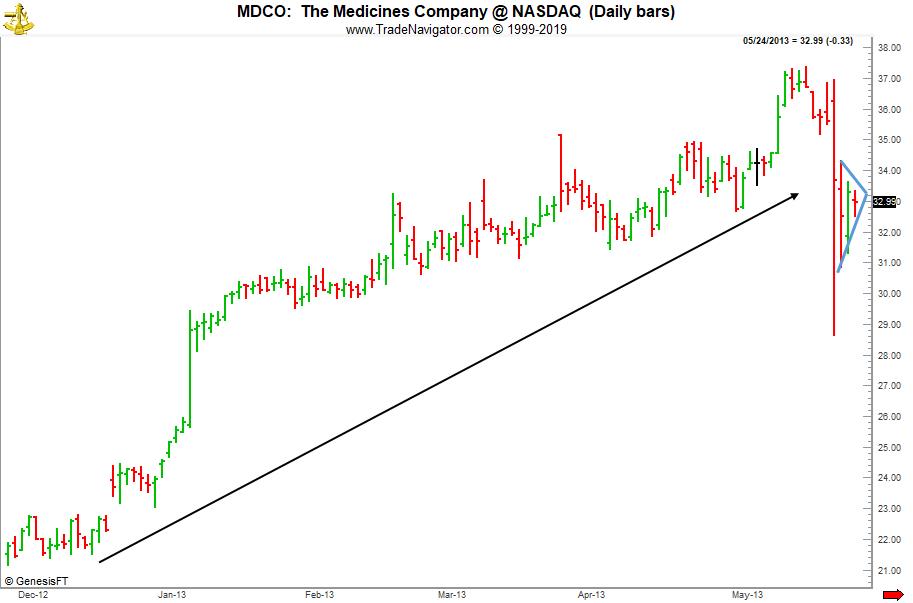
Sure! What you are looking at is an inside breakout pattern. It looks like a mini-triangle. It is made up of successive inside bars. The probabilities are that the breakout will result in a continuation of the previous trend.
This pattern frequently occurs after a strong trend comes to a temporary pause for a few bars. What I like about this pattern is that it provides a low risk entry opportunity because the volatility and the length of the trading bars is greatly reduced from the normal bar to bar volatility of the underlying.
This provides a good low risk entry area without having to incur excessive risk due to extended volatility which causes extended trading range and more risk to the position. You can see in the example you sent. MDCO was still in a strong uptrend and was consolidating temporarily. The stock looked like it will continue moving to the upside in the near future.
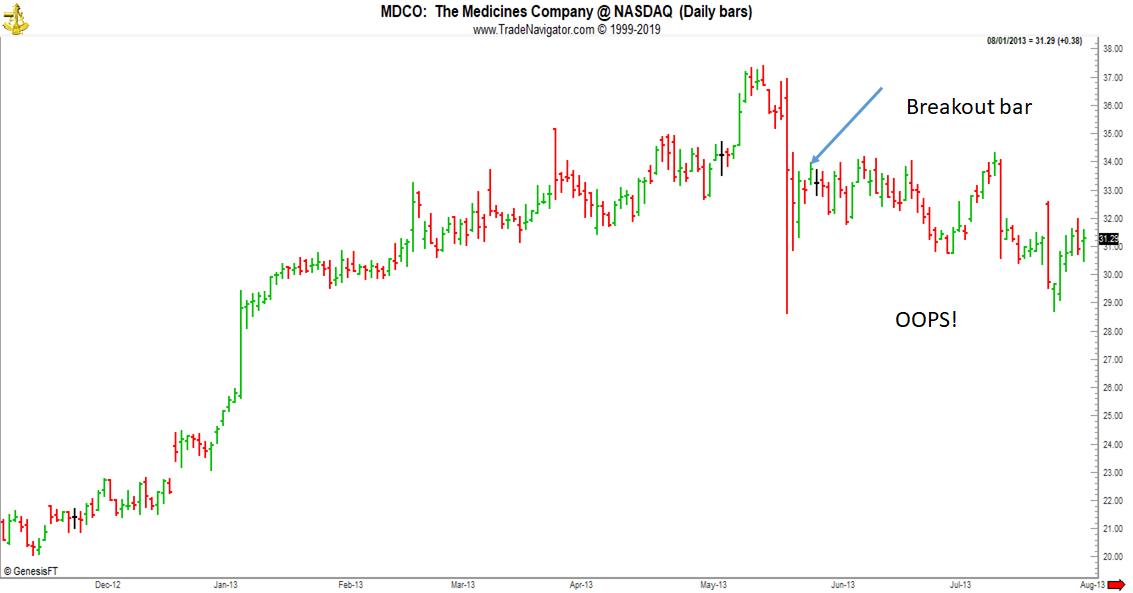
Okay! So, did it do what the chart pattern predicted? I took the liberty of looking back to find that stock, and below is the result.
I guess there is nothing that always works in trading!
The expectations you hold about where your trading career is going can have a powerful impact on what you do and how you do it. Consider three traders, Jake, Steve, and Paul. Each has a different outlook, and this outlook dictates how they approach the markets.
Jake is a pessimist. He wants to become a profitable trader, but his attitude....read more.
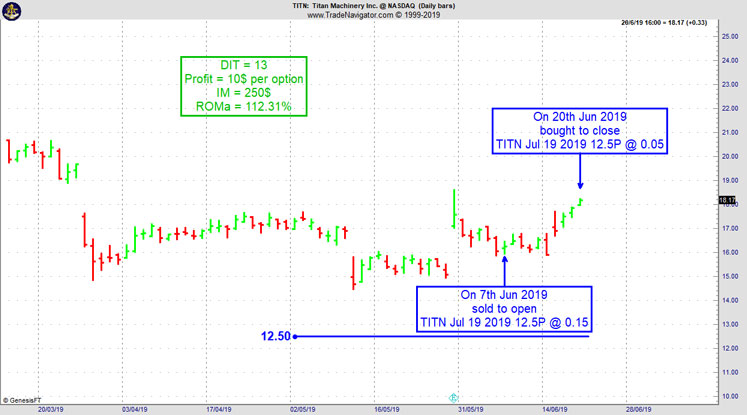
On 6th June 2019 we gave our Instant Income Guaranteed subscribers the following trade on Titan Machinery Inc. (TITN). Price insurance could be sold as follows:
On 7th June 2019, we sold to open TITN Jul 19 2019 12.5P @ 0.15, with 42 days until expiration and our short strike about 42% below price action, making the trade very safe.
On 20th June 2019, we bought to close TITN Jul 19 2019 12.5P @ 0.05, after 13 days in the trade
Profit: 10$ per option
Margin: 250$
Return on Margin annualized: 112.31%
Philippe
Receive daily trade recommendations - we do the research for you.
♦ SIGN UP TODAY! WEALTH BUILDING FOR YOUR FUTURE ♦
Trading Article: Should I reverse when I am having a loss?
Professional day traders reverse their positions about 60% of the time when they take losses? Why do they do this? The market should not have…read more.
Andy Jordan is the editor for Traders Notebook which shows you Futures Trading Strategies in Spreads, Options, and Swing Trades. Learn step-by-step how to trade successfully.
Traders Notebook Complete
Learn how to manage this trade by getting daily detailed trading instructions, click here!
The Russell 2000 is simply too easy to trade right now!
The Ambush trading method is specialised in catching intraday market tops and bottoms in a variety of Futures markets. Including the Russell 2000 Mini Future (RTY/M2K) traded at the CME, where Ambush Traders keep on cashing in big time again over the last couple of months!
Ambush day trades on an end-of-day basis so there’s no need to even check the markets during the day.
The Russell 2000 a very popular market out there among traders. It has two of the most important things private traders are looking for liquidity and volatility. I won’t even include a daily chart here as it does look quite boring. To keep it brief, the Russell is trading in a wide range for a long time now. Perfect conditions for Ambush and so this has paid out big time, here are all the recent trades:
Yes, that’s over $6000 within just three month and not even 20 trades! Which means Ambush traders made over $300 on average per trade doing nothing more than placing one entry order per day. I guess most active day traders made a lot less…but their brokers rich!
Now those are huge amounts if you have a small account and you might not want to make or lose hundreds or dollars per trade. Thanks to the new Micro Russell 2000 Mini Contracts (M2K) this is not an issue anymore. You can trade these with a small account now. Here are the results trading one M2K contract:
If that is not enough bang for the buck simply size it up and trade two contracts or three. It’s so great now you can position size as you like exactly matching your risk preferences!
In either case you have to ask yourself if you really can afford to miss out on these trades!
So whether you’re trading a $10k account or a $100k account, Ambush has the right markets for you to start following the signals.
Again, ask yourself if you really can afford to miss out on these trades or at least be aware of the signals? Now if you’ve been on the other sides of these trades trying to buy the breakouts you maybe should think about switching sides?
With Ambush Signals you can easily follow Ambush, a system specialized in catching intraday market tops and bottoms in the Futures markets!
The most popular and easiest way to follow Ambush is Ambush Signals. It does all the work for you, allows you to customise what markets you want to see and has a position sizing tool implemented to automatically adjust the positions to your risk preferences.
Each day around 6:30 pm NY Time the Signals are available for you on the Dashboard. You can then place your orders and literally walk away until the next market close! To find out more about the details of Ambush and how Ambush Signals works, have a look at the Ambush Signals Website.
Let’s be realistic. Following any System can be tough, especially in the beginning. It simply needs time to build the confidence needed to make it through inevitable drawdowns. So what if you are unlucky and don’t catch a good start right away?
I want you to succeed trading Ambush Signals, so here’s something for you that will strongly increase your odds of success and allow you to easily gain the confidence you’ll need to become a long-term profitable Ambush trader.
Did you come up with questions? Don't be shy, email Marco Mayer, he wants to hear from you! This email address is being protected from spambots. You need JavaScript enabled to view it.
To view previous published Chart Scan newsletters, please log in or click on "Join Us,"
shown above, to subscribe to our free "Members Only" section.
A WEALTH OF INFORMATION & EDUCATION:
Joe Ross-Trading Educators' popular free Chart Scan Newsletter has been published since 2004.
Note: Unless otherwise noted, all charts used in Chart Scan commentary were created
by using Genesis Financial Technologies' Trade Navigator (with permission).
Legal Notice and Copyright 2019 Disclaimer - Published by Trading Educators, Inc.
Chart Scan is a complimentary educational newsletter.
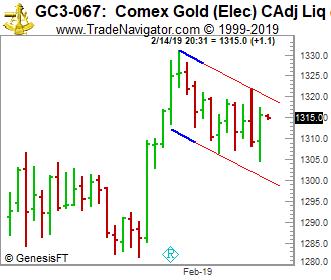
In Chart Scan 784, we looked at a descending flag formation on gold futures. Here’s a review of what was written:
Look at some statistics about the descending flag:
Descending Flag statistics
– In 87% of cases, there is an upward exit.
– In 90% of cases, it shows a continuation pattern.
– In 62% of cases, the target of the pattern will be reached .
– 76% of cases, it occurs when the price is at the highest third of its annual range.
– In 10% of cases, a pullback occurs on the support.
The more the previous movement precedes the formation of the descending flag it is powerful, the more the bullish breakout will be strong.
The flags performance is not as important when it is oriented in the direction of the trend.
A descending flag with narrowed lines performs more than a flag with outspread lines and is more powerful if there is no false breakout. Based on statistics, I would have to say the bias should be to the upside for gold.
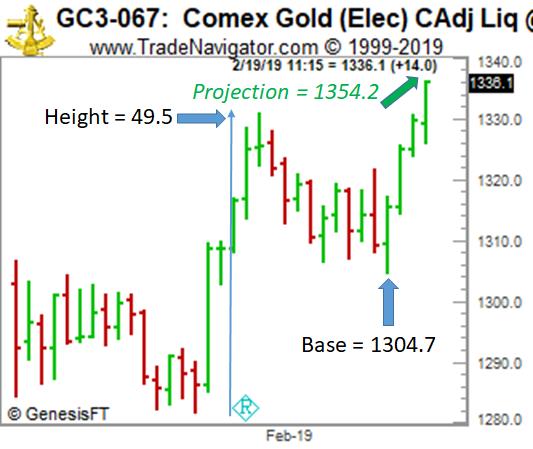
Now let’s look at what transpired since article 784 in Chart Scan was written.
An old-fashioned way of projecting how far prices will move is by taking the height of the flagpole 49.5, and adding it to the base of the flag 1304.7. The result is a projection to 1354.2. Of course, this is not rocket science, but you would be amazed at how often the projection comes true give or take a few ticks.
Your ability to concentrate fully and intensely can mean the difference between consistently taking home huge profits and barely staying above water. It's really important that you pay attention to....read more.
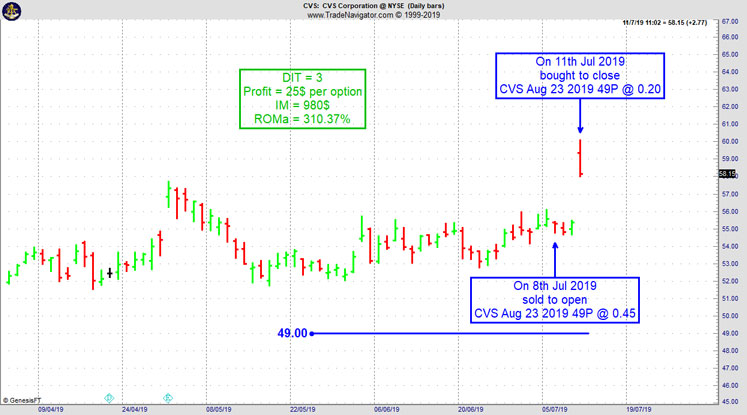
On 7th July 2019 we gave our Instant Income Guaranteed subscribers the following trade on CVS Corporation (CVS). Price insurance could be sold as follows:
On 8th July 2019, we sold to open CVS Aug 23 2019 49P @ 0.45, with 38 days until expiration and our short strike about 12% below price action.
On 11th July 2019, we bought to close CVS Aug 23 2019 49P @ 0.20, after 3 days in the trade, for quick premium compounding
Profit: 25$ per option
Margin: 980$
Return on Margin annualized: 310.37%
Philippe
Receive daily trade recommendations - we do the research for you.
♦ SIGN UP TODAY! WEALTH BUILDING FOR YOUR FUTURE ♦
Andy Jordan is the editor for Traders Notebook which shows you Futures Trading Strategies in Spreads, Options, and Swing Trades. Learn step-by-step how to trade successfully.
Traders Notebook Complete
Learn how to manage this trade by getting daily detailed trading instructions, click here!
The Russell 2000 is simply too easy to trade right now!
The Ambush trading method is specialised in catching intraday market tops and bottoms in a variety of Futures markets. Including the Russell 2000 Mini Future (RTY/M2K) traded at the CME, where Ambush Traders keep on cashing in big time again over the last couple of months!
Ambush day trades on an end-of-day basis so there’s no need to even check the markets during the day.
The Russell 2000 a very popular market out there among traders. It has two of the most important things private traders are looking for liquidity and volatility. I won’t even include a daily chart here as it does look quite boring. To keep it brief, the Russell is trading in a wide range for a long time now. Perfect conditions for Ambush and so this has paid out big time, here are all the recent trades:
Yes, that’s over $6000 within just three month and not even 20 trades! Which means Ambush traders made over $300 on average per trade doing nothing more than placing one entry order per day. I guess most active day traders made a lot less…but their brokers rich!
Now those are huge amounts if you have a small account and you might not want to make or lose hundreds or dollars per trade. Thanks to the new Micro Russell 2000 Mini Contracts (M2K) this is not an issue anymore. You can trade these with a small account now. Here are the results trading one M2K contract:
If that is not enough bang for the buck simply size it up and trade two contracts or three. It’s so great now you can position size as you like exactly matching your risk preferences!
In either case you have to ask yourself if you really can afford to miss out on these trades!
So whether you’re trading a $10k account or a $100k account, Ambush has the right markets for you to start following the signals.
Again, ask yourself if you really can afford to miss out on these trades or at least be aware of the signals? Now if you’ve been on the other sides of these trades trying to buy the breakouts you maybe should think about switching sides?
With Ambush Signals you can easily follow Ambush, a system specialized in catching intraday market tops and bottoms in the Futures markets!
The most popular and easiest way to follow Ambush is Ambush Signals. It does all the work for you, allows you to customise what markets you want to see and has a position sizing tool implemented to automatically adjust the positions to your risk preferences.
Each day around 6:30 pm NY Time the Signals are available for you on the Dashboard. You can then place your orders and literally walk away until the next market close! To find out more about the details of Ambush and how Ambush Signals works, have a look at the Ambush Signals Website.
Let’s be realistic. Following any System can be tough, especially in the beginning. It simply needs time to build the confidence needed to make it through inevitable drawdowns. So what if you are unlucky and don’t catch a good start right away?
I want you to succeed trading Ambush Signals, so here’s something for you that will strongly increase your odds of success and allow you to easily gain the confidence you’ll need to become a long-term profitable Ambush trader.
Did you come up with questions? Don't be shy, email Marco Mayer, he wants to hear from you! This email address is being protected from spambots. You need JavaScript enabled to view it.
To view previous published Chart Scan newsletters, please log in or click on "Join Us,"
shown above, to subscribe to our free "Members Only" section.
A WEALTH OF INFORMATION & EDUCATION:
Joe Ross-Trading Educators' popular free Chart Scan Newsletter has been published since 2004.
Note: Unless otherwise noted, all charts used in Chart Scan commentary were created
by using Genesis Financial Technologies' Trade Navigator (with permission).
Legal Notice and Copyright 2019 Disclaimer - Published by Trading Educators, Inc.
Chart Scan is a complimentary educational newsletter.
"Teach our students the truth in trading - teach them how to trade,"
and
"Give them a way to earn while they learn - realizing that it takes time to develop a successful trader."
Derivative transactions, including futures, are complex and carry a high degree of risk. They are intended for sophisticated investors and are not suitable for everyone.
There are numerous other factors related to the markets in general or to the implementation of any specific trading program which cannot be
fully accounted for in the preparation of hypothetical performance results, and all of which can adversely affect actual trading results.
For more information, see the Risk Disclosure Statement for Futures and Options.