Trades in Stock Options. Receive daily trade recommendations. Can you imagine discovering a way to trade that promises instant income? If you think such a method is impossible, think again. It is definitely achievable, and everything you need to know is available online for one low price that includes special three-part online webinars.
Ambush is a time-proven mean-reversion day trading System focused on a variety of Futures markets around the globe. With Ambush Signals you can now easily follow the Ambush System on a subscription basis for educational purposes.
If you didn't fail early in your trading business, then you have probably been around long enough to realize that many of the problems you encounter as a trader are those that derive from your own individuality. Such problems are common among traders and, in fact, common among all human beings. Seeking spiritual help from a power much greater than your own is the area I address in the "Spiritual Side of Trading".
Hey Joe! I don’t want to bother you with a whole bunch of questions about options, but could you please tell me if Option Open Interest is of any value, and if so, how would you use it?
Keeping in mind that I am strictly an option seller. I mainly sell put options.
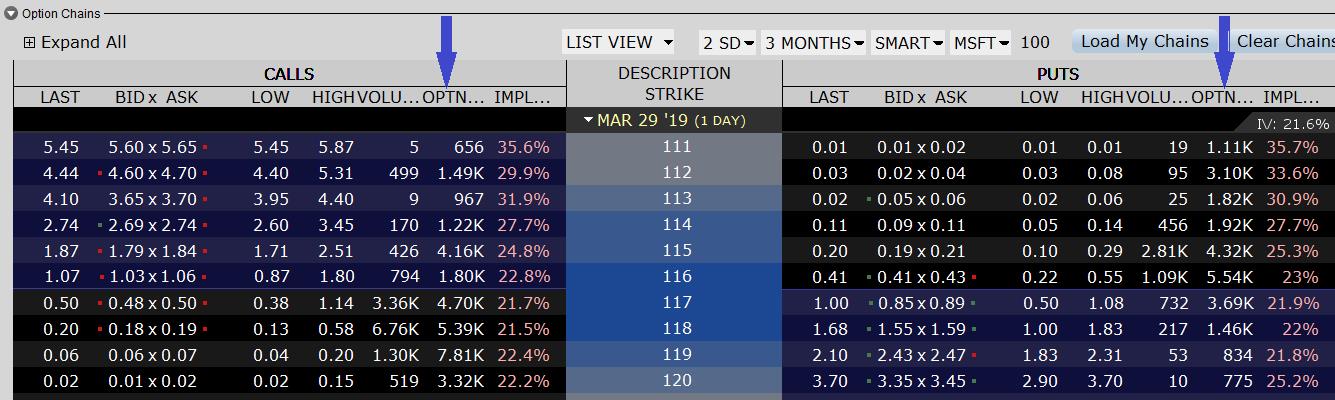
Open interest shows all open options contracts that are available for exercise that have not been closed out. (Arrows)
One way traders use open interest is to determine supply and demand levels for the underlying asset. For example, let's assume that I’m looking to sell put options for ABC stock that's priced at $50.00 per share and I believe that the stock is going to go up, or at least stay in a trading range.
When I look at the put options that expire 2 months from now, I find that the open interest on the $30.00 strike price put option is only 10 contracts, while the open interest on the 40 strike price put option is 500 contracts.
This tells me that the majority of speculators don't believe that the underlying stock is going to move up very much in the next two months and I may want to consider selling a lower strike price put option or reconsider the trade because the sentiment is against the stock moving up.
Another very simple way to use open interest is to determine whether the overall sentiment on the underlying assets that I’m analyzing is bullish or bearish. Let's say that I’m looking at XYZ stock and once again the stock is priced at $50.00 per share. When I look at the open interest column the 50 strike price put option has open interest of only 100, while the 50 strike price call option has open interest of 500.
This would tell me that the current market sentiment for this stock is bullish, since open interest is 5 times higher for the at the money call option compared to the at the money put option, this would tell me that the current sentiment favors XYZ stock moving higher.
If on the other hand the at the money put options have higher open interest than the at the money call options, then I would conclude that the sentiment is bearish.
If I find that open interest for the at the money call option and the at the money put option are similar to each other, then I would avoid using open interest as a directional sentiment indicator. I find that it works best when the open interest numbers favoring either the calls or the puts outweighs the other side by a very large margin.
Lastly, another very common way of utilizing open interest is to monitor for unusual options activity. For example, if ABC stock is trading at $50.00 and the $40 strike price call option that expires in 1 month has open interest of 10,000 contracts and within the next few trading sessions the open interest dramatically rises, this would imply that speculators are accumulating that option because they believe ABC stock is going to move lower within the next few weeks. Similarly, if the open interest drastically increased in a short period of time in an out of the money call option, the $60 strike price for example, it would imply that speculators believe that ABC stock is going to move higher.
Screening for unusual rise in open interest is so popular that several financial analysis firms specialize in screening for options with major changes in open interest in a short period of time.
I personally find that keeping an eye on stock index open interest levels, for different options strike price levels, offers an excellent analysis tool for short term price swings as well as support and resistance levels.
Beginning traders may make trade after trade and watch their account balance dwindle with each trade. They may feel unintelligent and thoughtless and think, "Why am I making so many losing trades?" At times they may wonder...read more.
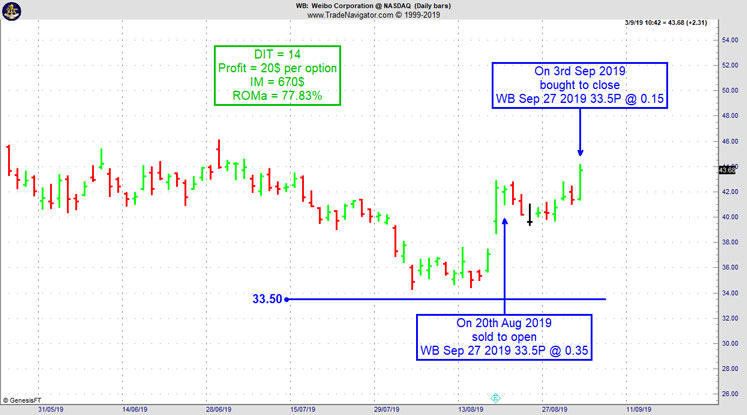
On 18th August 2019 we gave our Instant Income Guaranteed subscribers the following trade on Weibo Corporation (WB), after a gap up on earnings. Price insurance could be sold as follows:
On 20th August 2019, we sold to open WB Sep 27 2019 33.5P @ 0.35, with 37 days until expiration and our short strike about 22% below price action, making the trade very safe.
On 3rd September 2019, we bought to close WB Sep 27 2019 33.5P @ 0.15, after 14 days in the trade.
Profit: 20$ per option
Margin: 670$
Return on Margin annualized: 77.83%
Philippe
Receive daily trade recommendations - we do the research for you.
♦ SIGN UP TODAY! WEALTH BUILDING FOR YOUR FUTURE ♦
As a trader, it's very important that you keep accurate records of all factors that may impact the outcome of your trades so that you can learn from your losses, improve your performance, and....read more.
Andy Jordan is the editor for Traders Notebook which shows you Futures Trading Strategies in Spreads, Options, and Swing Trades. Learn step-by-step how to trade successfully.
Traders Notebook Complete
Learn how to manage this trade by getting daily detailed trading instructions, click here!
The Russell 2000 is simply too easy to trade right now!
The Ambush trading method is specialised in catching intraday market tops and bottoms in a variety of Futures markets. Including the Russell 2000 Mini Future (RTY/M2K) traded at the CME, where Ambush Traders keep on cashing in big time again over the last couple of months!
Ambush day trades on an end-of-day basis so there’s no need to even check the markets during the day.
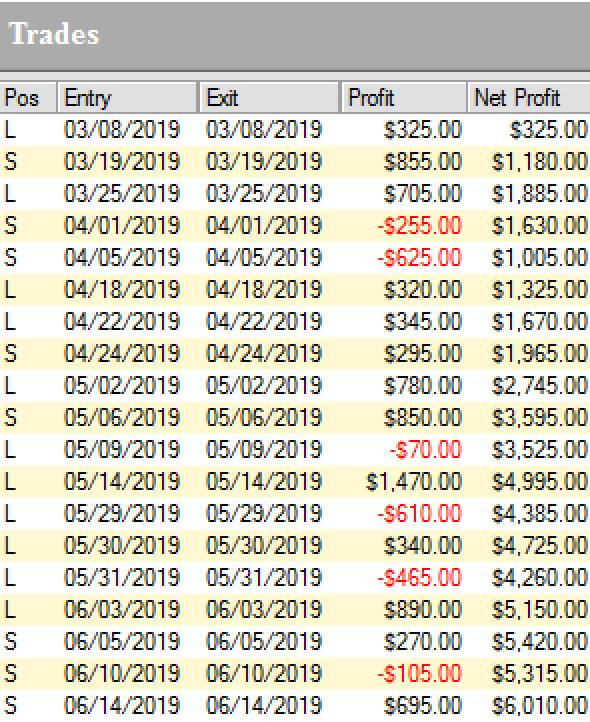
The Russell 2000 a very popular market out there among traders. It has two of the most important things private traders are looking for liquidity and volatility. I won’t even include a daily chart here as it does look quite boring. To keep it brief, the Russell is trading in a wide range for a long time now. Perfect conditions for Ambush and so this has paid out big time, here are all the recent trades:
Yes, that’s over $6000 within just three month and not even 20 trades! Which means Ambush traders made over $300 on average per trade doing nothing more than placing one entry order per day. I guess most active day traders made a lot less…but their brokers rich!
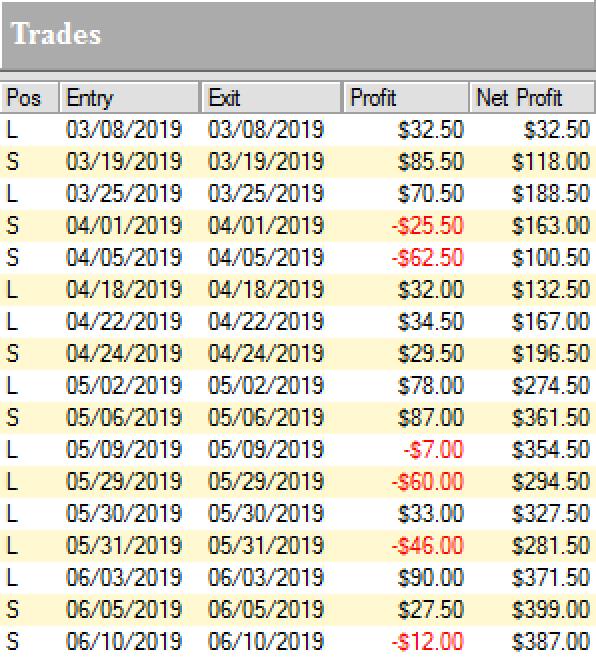
Now those are huge amounts if you have a small account and you might not want to make or lose hundreds or dollars per trade. Thanks to the new Micro Russell 2000 Mini Contracts (M2K) this is not an issue anymore. You can trade these with a small account now. Here are the results trading one M2K contract:
If that is not enough bang for the buck simply size it up and trade two contracts or three. It’s so great now you can position size as you like exactly matching your risk preferences!
In either case you have to ask yourself if you really can afford to miss out on these trades!
So whether you’re trading a $10k account or a $100k account, Ambush has the right markets for you to start following the signals.
Again, ask yourself if you really can afford to miss out on these trades or at least be aware of the signals? Now if you’ve been on the other sides of these trades trying to buy the breakouts you maybe should think about switching sides?
With Ambush Signals you can easily follow Ambush, a system specialized in catching intraday market tops and bottoms in the Futures markets!
The most popular and easiest way to follow Ambush is Ambush Signals. It does all the work for you, allows you to customise what markets you want to see and has a position sizing tool implemented to automatically adjust the positions to your risk preferences.
Each day around 6:30 pm NY Time the Signals are available for you on the Dashboard. You can then place your orders and literally walk away until the next market close! To find out more about the details of Ambush and how Ambush Signals works, have a look at the Ambush Signals Website.
Let’s be realistic. Following any System can be tough, especially in the beginning. It simply needs time to build the confidence needed to make it through inevitable drawdowns. So what if you are unlucky and don’t catch a good start right away?
I want you to succeed trading Ambush Signals, so here’s something for you that will strongly increase your odds of success and allow you to easily gain the confidence you’ll need to become a long-term profitable Ambush trader.
Did you come up with questions? Don't be shy, email Marco Mayer, he wants to hear from you! This email address is being protected from spambots. You need JavaScript enabled to view it.
To view previous published Chart Scan newsletters, please log in or click on "Join Us,"
shown above, to subscribe to our free "Members Only" section.
A WEALTH OF INFORMATION & EDUCATION:
Joe Ross-Trading Educators' popular free Chart Scan Newsletter has been published since 2004.
Note: Unless otherwise noted, all charts used in Chart Scan commentary were created
by using Genesis Financial Technologies' Trade Navigator (with permission).
Legal Notice and Copyright 2019 Disclaimer - Published by Trading Educators, Inc.
Chart Scan is a complimentary educational newsletter.
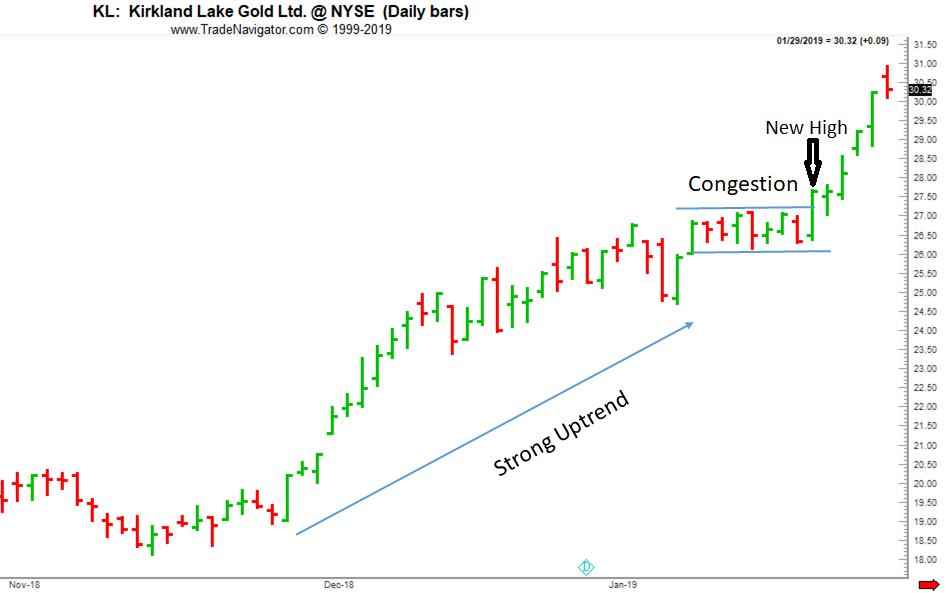
Hey Joe! I’ve heard that a trader or investor should buy new highs. Couldn’t that be disastrous?
Yes, it could be disastrous. It’s not a good idea to simply buy new highs. There should be some qualifying parameters to go with new highs that increase the probabilities of making a good trade.
For example, the new high should be part of an overall strong uptrend. It should come as the result of a breakout from congestion. It might be a sideways congestion as pictured above or perhaps a flag or pennant formation. Other fundamental reasons should also be considered. Is there something in the news that would indicate higher prices to come. Is there a shortage of an underlying commodity that will increase demand? Does an underlying company have a new product, or innovation that is going to put its stock in demand? There are many more reasons that can cause prices to continue rising, that I’m sure you can think of. Consider doing a bit of research to find out why the underlying made a new high.
Whether you're a novice or seasoned trader, there are days when you face setback after setback: Adverse events go against you. You make a trading error. You misread the markets. The possible setbacks can be endless, and it hurts a little to watch your account balance take a hit when one of them catches you off guard. But whatever roadblocks get in your way, you have to take...read more.
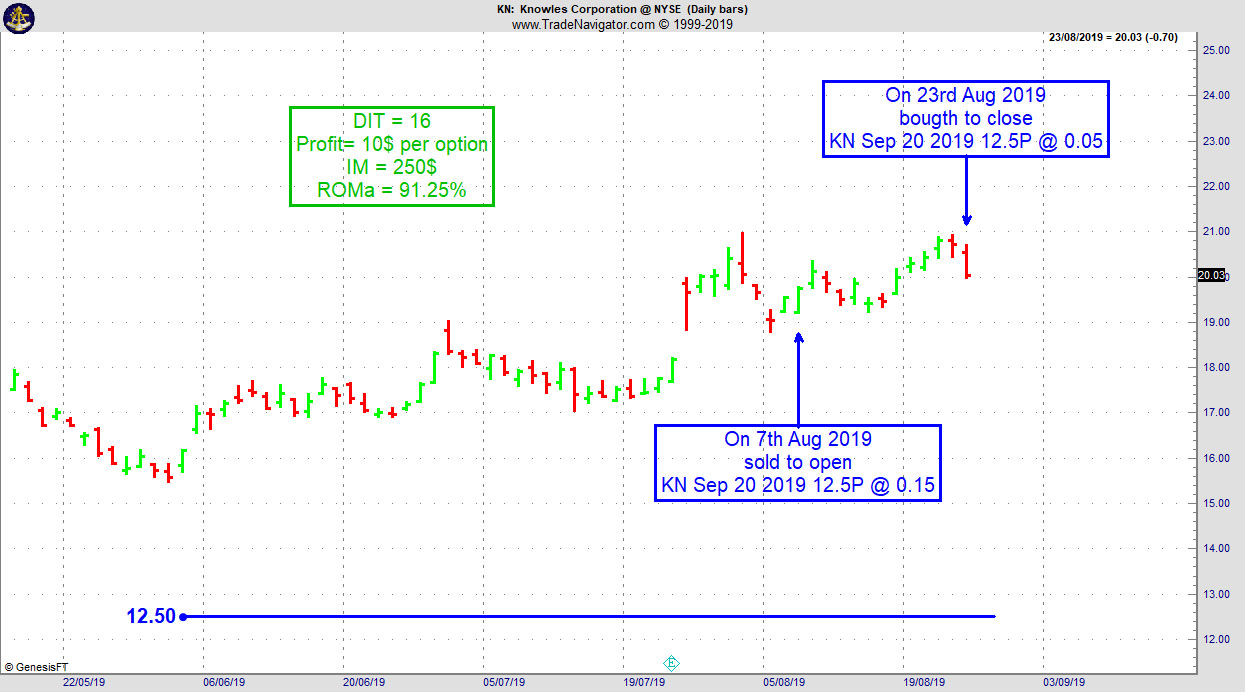
On 6th August 2019 we gave our Instant Income Guaranteed subscribers the following trade on Knowles Corporation (KN). Price insurance could be sold as follows:
On 7th August 2019, we sold to open KN Sep 20 2019 12.5P @ 0.15, with 43 days until expiration and our short strike about 36% below price action, making the trade very safe,
On 23rd August 2019, we bought to close KN Sep 20 2019 12.5P @ 0.05, after 16 days in the trade.
Profit: 10$ per option
Margin: 250$
Return on Margin annualized: 91.25%
Philippe
Receive daily trade recommendations - we do the research for you.
♦ SIGN UP TODAY! WEALTH BUILDING FOR YOUR FUTURE ♦
Our past experience is a factor coloring the way we see things. We get an electric shock, and we decide....read more.
Andy Jordan is the editor for Traders Notebook which shows you Futures Trading Strategies in Spreads, Options, and Swing Trades. Learn step-by-step how to trade successfully.
Traders Notebook Complete
Learn how to manage this trade by getting daily detailed trading instructions, click here!
The Russell 2000 is simply too easy to trade right now!
The Ambush trading method is specialised in catching intraday market tops and bottoms in a variety of Futures markets. Including the Russell 2000 Mini Future (RTY/M2K) traded at the CME, where Ambush Traders keep on cashing in big time again over the last couple of months!
Ambush day trades on an end-of-day basis so there’s no need to even check the markets during the day.
The Russell 2000 a very popular market out there among traders. It has two of the most important things private traders are looking for liquidity and volatility. I won’t even include a daily chart here as it does look quite boring. To keep it brief, the Russell is trading in a wide range for a long time now. Perfect conditions for Ambush and so this has paid out big time, here are all the recent trades:
Yes, that’s over $6000 within just three month and not even 20 trades! Which means Ambush traders made over $300 on average per trade doing nothing more than placing one entry order per day. I guess most active day traders made a lot less…but their brokers rich!
Now those are huge amounts if you have a small account and you might not want to make or lose hundreds or dollars per trade. Thanks to the new Micro Russell 2000 Mini Contracts (M2K) this is not an issue anymore. You can trade these with a small account now. Here are the results trading one M2K contract:
If that is not enough bang for the buck simply size it up and trade two contracts or three. It’s so great now you can position size as you like exactly matching your risk preferences!
In either case you have to ask yourself if you really can afford to miss out on these trades!
So whether you’re trading a $10k account or a $100k account, Ambush has the right markets for you to start following the signals.
Again, ask yourself if you really can afford to miss out on these trades or at least be aware of the signals? Now if you’ve been on the other sides of these trades trying to buy the breakouts you maybe should think about switching sides?
With Ambush Signals you can easily follow Ambush, a system specialized in catching intraday market tops and bottoms in the Futures markets!
The most popular and easiest way to follow Ambush is Ambush Signals. It does all the work for you, allows you to customise what markets you want to see and has a position sizing tool implemented to automatically adjust the positions to your risk preferences.
Each day around 6:30 pm NY Time the Signals are available for you on the Dashboard. You can then place your orders and literally walk away until the next market close! To find out more about the details of Ambush and how Ambush Signals works, have a look at the Ambush Signals Website.
Let’s be realistic. Following any System can be tough, especially in the beginning. It simply needs time to build the confidence needed to make it through inevitable drawdowns. So what if you are unlucky and don’t catch a good start right away?
I want you to succeed trading Ambush Signals, so here’s something for you that will strongly increase your odds of success and allow you to easily gain the confidence you’ll need to become a long-term profitable Ambush trader.
Did you come up with questions? Don't be shy, email Marco Mayer, he wants to hear from you! This email address is being protected from spambots. You need JavaScript enabled to view it.
To view previous published Chart Scan newsletters, please log in or click on "Join Us,"
shown above, to subscribe to our free "Members Only" section.
A WEALTH OF INFORMATION & EDUCATION:
Joe Ross-Trading Educators' popular free Chart Scan Newsletter has been published since 2004.
Note: Unless otherwise noted, all charts used in Chart Scan commentary were created
by using Genesis Financial Technologies' Trade Navigator (with permission).
Legal Notice and Copyright 2019 Disclaimer - Published by Trading Educators, Inc.
Chart Scan is a complimentary educational newsletter.
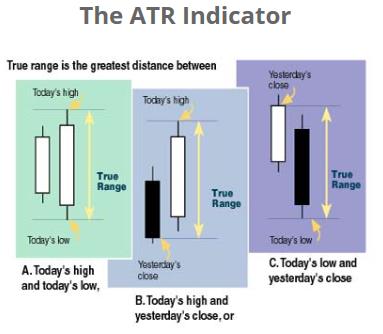
Hey Joe! I’ve been trying to figure out the correct way to program the Average True Range (ATR). Various charting programs seem to come up with different answers. Which one is the right one?
The Charting Software that I use, Genesis Trade Navigator, has two different ways to do it. I’m not sure which is which, but one of them is based on Welles Wilder’s original formula and the other way is based on their own in-house formula. It seems to me that the last two ways pictured above are the most correct. As you see above in the graphic that you sent, the first way if fine for a single day, but what would you do if prices gapped open either up or down? The first way above fails to take into consideration any gap that might occur. Going from the close to the next day’s high, or from the close to the next day’s low, at least takes into consideration any gap that might occur. However, there is yet another way not pictured above. It would be to measure from yesterday’s low to today’s high for a move up, or to measure from yesterday’s high to today’s low, to envision the correct amount of volatility in the price movement. Of course, why use only the close? Why not substitute from the Open to the low or high? I don’t know which is the correct way, and I don’t think anyone else knows it either. It seems to be a matter of opinion. The main thing for ATR is to be consistent in the way it is calculated.
Are you experiencing an emotional roller coaster, euphorically celebrating wins, but facing despair when losses mount? If you are, you may be taking things a little too personally. If you want to trade like a winner, you need to take responsibility for your actions, taking every precaution possible to neutralize...read more.
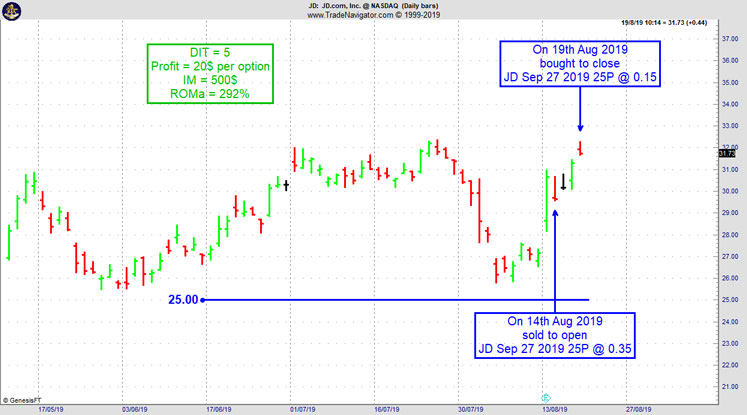
On 13th August 2019 we gave our Instant Income Guaranteed subscribers the following trade on JD.com Inc. (JD). Price insurance could be sold as follows:
On 14th August 2019, we sold to open JD Sep 27 2019 25P @ 0.35, with 43 days until expiration and our short strike about 18% below price action,
On 19th August 2019, we bought to close JD Sep 27 2019 25P @ 0.15, after 5 days in the trade, for quick premium compounding
Profit: 20$ per option
Margin: 500$
Return on Margin annualized: 292%
Philippe
Receive daily trade recommendations - we do the research for you.
♦ SIGN UP TODAY! WEALTH BUILDING FOR YOUR FUTURE ♦
Trading Article: The Ideal Parameters for Successful Trading
Your trading goals and objectives must be possible to complete. They cannot be too abstract or too high. It is best to just execute a trade rather than being overly concerned with profits or achieving unrealistic performance standards.
You must be able to intensely concentrate on....read more.
Andy Jordan is the editor for Traders Notebook which shows you Futures Trading Strategies in Spreads, Options, and Swing Trades. Learn step-by-step how to trade successfully.
Traders Notebook Complete
Learn how to manage this trade by getting daily detailed trading instructions, click here!
The Russell 2000 is simply too easy to trade right now!
The Ambush trading method is specialised in catching intraday market tops and bottoms in a variety of Futures markets. Including the Russell 2000 Mini Future (RTY/M2K) traded at the CME, where Ambush Traders keep on cashing in big time again over the last couple of months!
Ambush day trades on an end-of-day basis so there’s no need to even check the markets during the day.
The Russell 2000 a very popular market out there among traders. It has two of the most important things private traders are looking for liquidity and volatility. I won’t even include a daily chart here as it does look quite boring. To keep it brief, the Russell is trading in a wide range for a long time now. Perfect conditions for Ambush and so this has paid out big time, here are all the recent trades:
Yes, that’s over $6000 within just three month and not even 20 trades! Which means Ambush traders made over $300 on average per trade doing nothing more than placing one entry order per day. I guess most active day traders made a lot less…but their brokers rich!
Now those are huge amounts if you have a small account and you might not want to make or lose hundreds or dollars per trade. Thanks to the new Micro Russell 2000 Mini Contracts (M2K) this is not an issue anymore. You can trade these with a small account now. Here are the results trading one M2K contract:
If that is not enough bang for the buck simply size it up and trade two contracts or three. It’s so great now you can position size as you like exactly matching your risk preferences!
In either case you have to ask yourself if you really can afford to miss out on these trades!
So whether you’re trading a $10k account or a $100k account, Ambush has the right markets for you to start following the signals.
Again, ask yourself if you really can afford to miss out on these trades or at least be aware of the signals? Now if you’ve been on the other sides of these trades trying to buy the breakouts you maybe should think about switching sides?
With Ambush Signals you can easily follow Ambush, a system specialized in catching intraday market tops and bottoms in the Futures markets!
The most popular and easiest way to follow Ambush is Ambush Signals. It does all the work for you, allows you to customise what markets you want to see and has a position sizing tool implemented to automatically adjust the positions to your risk preferences.
Each day around 6:30 pm NY Time the Signals are available for you on the Dashboard. You can then place your orders and literally walk away until the next market close! To find out more about the details of Ambush and how Ambush Signals works, have a look at the Ambush Signals Website.
Let’s be realistic. Following any System can be tough, especially in the beginning. It simply needs time to build the confidence needed to make it through inevitable drawdowns. So what if you are unlucky and don’t catch a good start right away?
I want you to succeed trading Ambush Signals, so here’s something for you that will strongly increase your odds of success and allow you to easily gain the confidence you’ll need to become a long-term profitable Ambush trader.
Did you come up with questions? Don't be shy, email Marco Mayer, he wants to hear from you! This email address is being protected from spambots. You need JavaScript enabled to view it.
To view previous published Chart Scan newsletters, please log in or click on "Join Us,"
shown above, to subscribe to our free "Members Only" section.
A WEALTH OF INFORMATION & EDUCATION:
Joe Ross-Trading Educators' popular free Chart Scan Newsletter has been published since 2004.
Note: Unless otherwise noted, all charts used in Chart Scan commentary were created
by using Genesis Financial Technologies' Trade Navigator (with permission).
Legal Notice and Copyright 2019 Disclaimer - Published by Trading Educators, Inc.
Chart Scan is a complimentary educational newsletter.
Early in my trading career, apart from moving averages, there were no indicators worthy of much mention. The computations needed for creating indicators were much too time-consuming for anyone to do without having a large main-frame computer, or at the very least a mini computer (cost $400,000). I learned to trade by reading a chart. In my opinion, chart reading still has the advantage over trading with indicators, especially if an indicator become the prime reason for entry into a trade. Indicators are okay as confirming entities to what a trader can see with the naked eye, but in my opinion that’s all they are good for. Of course, this kind of thinking is contrary to the vast majority of opinion among those who trade the markets.
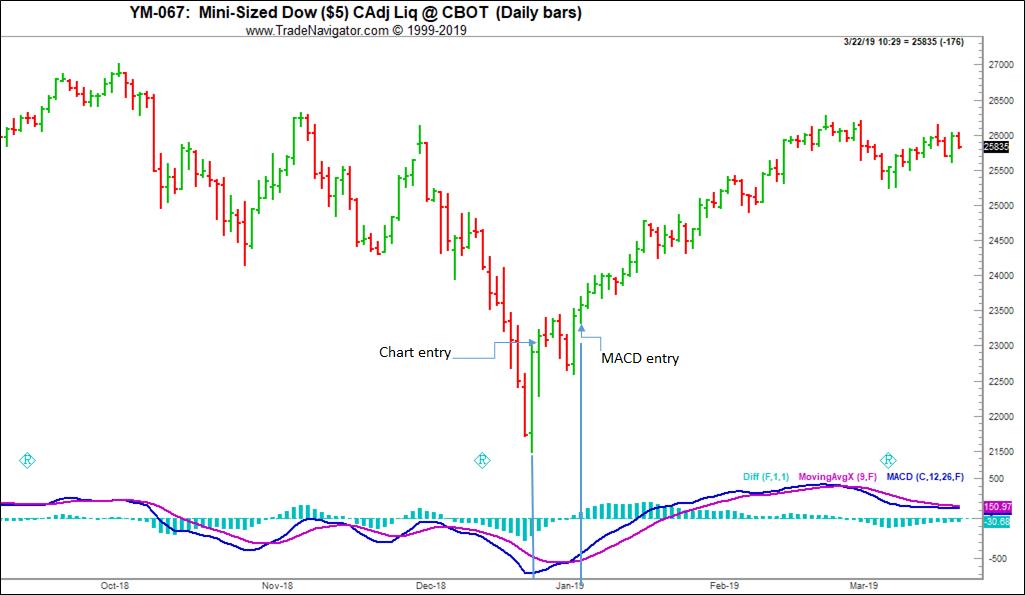
The greatest weakness of an indicator is the fact that it requires historical data. Indicators are generally detrended plots of moving averages of whatever is the underlying. Because they depend on historical data, they are always behind the actual price action. The following is an example of what I mean.
For the Chart entry all that was needed was single reversal bar. Buy on the following bar at the price of the high of the reversal bar. Take a scalp trade and a second trade was possible at the MACD entry. The reversal bar gave its signal 7 bars before the MACD entry signal. The MACD entry was possible on the 8th bar of the series.
As traders in the markets, it's informative to study everyday examples of mass psychology. Although humans are highly intelligent, they can act like cattle blindly following the leader of the pack to the slaughterhouse. For example, have you ever...read more.
Early in the trading day, as part of your daily preparation (you do have a daily preparation, don’t you?) it's helpful to practice a little to get a "feel" for what you might do and how you might trade. One way to do it is to make....read more.
Andy Jordan is the editor for Traders Notebook which shows you Futures Trading Strategies in Spreads, Options, and Swing Trades. Learn step-by-step how to trade successfully.
Traders Notebook Complete
Learn how to manage this trade by getting daily detailed trading instructions, click here!
The Russell 2000 is simply too easy to trade right now!
The Ambush trading method is specialised in catching intraday market tops and bottoms in a variety of Futures markets. Including the Russell 2000 Mini Future (RTY/M2K) traded at the CME, where Ambush Traders keep on cashing in big time again over the last couple of months!
Ambush day trades on an end-of-day basis so there’s no need to even check the markets during the day.
The Russell 2000 a very popular market out there among traders. It has two of the most important things private traders are looking for liquidity and volatility. I won’t even include a daily chart here as it does look quite boring. To keep it brief, the Russell is trading in a wide range for a long time now. Perfect conditions for Ambush and so this has paid out big time, here are all the recent trades:
Yes, that’s over $6000 within just three month and not even 20 trades! Which means Ambush traders made over $300 on average per trade doing nothing more than placing one entry order per day. I guess most active day traders made a lot less…but their brokers rich!
Now those are huge amounts if you have a small account and you might not want to make or lose hundreds or dollars per trade. Thanks to the new Micro Russell 2000 Mini Contracts (M2K) this is not an issue anymore. You can trade these with a small account now. Here are the results trading one M2K contract:
If that is not enough bang for the buck simply size it up and trade two contracts or three. It’s so great now you can position size as you like exactly matching your risk preferences!
In either case you have to ask yourself if you really can afford to miss out on these trades!
So whether you’re trading a $10k account or a $100k account, Ambush has the right markets for you to start following the signals.
Again, ask yourself if you really can afford to miss out on these trades or at least be aware of the signals? Now if you’ve been on the other sides of these trades trying to buy the breakouts you maybe should think about switching sides?
With Ambush Signals you can easily follow Ambush, a system specialized in catching intraday market tops and bottoms in the Futures markets!
The most popular and easiest way to follow Ambush is Ambush Signals. It does all the work for you, allows you to customise what markets you want to see and has a position sizing tool implemented to automatically adjust the positions to your risk preferences.
Each day around 6:30 pm NY Time the Signals are available for you on the Dashboard. You can then place your orders and literally walk away until the next market close! To find out more about the details of Ambush and how Ambush Signals works, have a look at the Ambush Signals Website.
Let’s be realistic. Following any System can be tough, especially in the beginning. It simply needs time to build the confidence needed to make it through inevitable drawdowns. So what if you are unlucky and don’t catch a good start right away?
I want you to succeed trading Ambush Signals, so here’s something for you that will strongly increase your odds of success and allow you to easily gain the confidence you’ll need to become a long-term profitable Ambush trader.
Did you come up with questions? Don't be shy, email Marco Mayer, he wants to hear from you! This email address is being protected from spambots. You need JavaScript enabled to view it.
To view previous published Chart Scan newsletters, please log in or click on "Join Us,"
shown above, to subscribe to our free "Members Only" section.
A WEALTH OF INFORMATION & EDUCATION:
Joe Ross-Trading Educators' popular free Chart Scan Newsletter has been published since 2004.
Note: Unless otherwise noted, all charts used in Chart Scan commentary were created
by using Genesis Financial Technologies' Trade Navigator (with permission).
Legal Notice and Copyright 2019 Disclaimer - Published by Trading Educators, Inc.
Chart Scan is a complimentary educational newsletter.
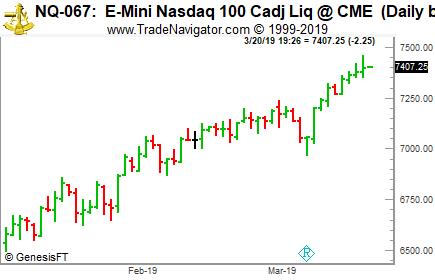
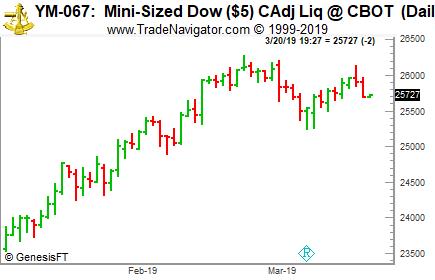
Take a look at the following two charts. Something should become immediately apparent. Do you see it? It’s a way for you to be able to make a low risk, high probability trade, with much of the volatility removed.
The E-mini Nasdaq 100 (NQ) futures are dramatically outperforming the Mini-Sized Dow (YM) futures. The result is an easily observable spread opportunity to go long NQ and short YM. To see it more clearly look at the sideways movement of both markets from about the middle February to the latest bar shown. NQ has broken out of a consolidation area, while YM is still in the middle of a sideways consolidation. Now do you see it?
Winning traders are extremely disciplined. They wisely study the markets, devise a trading plan, and follow it. They control their impulse to abandon their plans prematurely, and they don't allow emotions, such as fear and greed, to influence their trading decisions. In the trading profession,...read more.
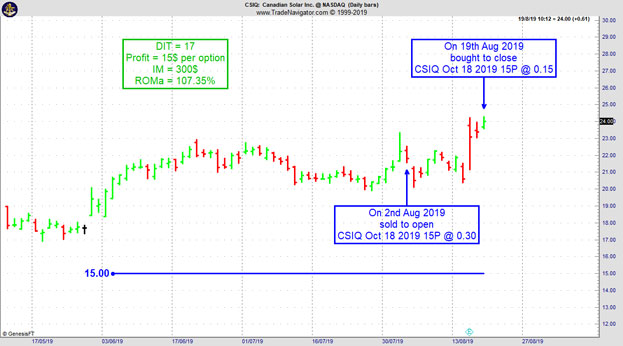
On 29th July 2019 we gave our Instant Income Guaranteed subscribers the following trade on Canadian Solar Inc. (CSIQ). Price insurance could be sold as follows:
On 2nd August 2019, on a GTC order, we sold to open CSIQ Oct 18 2019 15P @ 0.30, with 78 days until expiration and our short strike about 28% below price action.
On 19th August 2019, we bought to close CSIQ Oct 18 2019 15P @ 0.15, after 17 days in the trade.
Profit: 15$ per option
Margin: 300$
Return on Margin annualized: 107.35%
Philippe
Receive daily trade recommendations - we do the research for you.
♦ SIGN UP TODAY! WEALTH BUILDING FOR YOUR FUTURE ♦
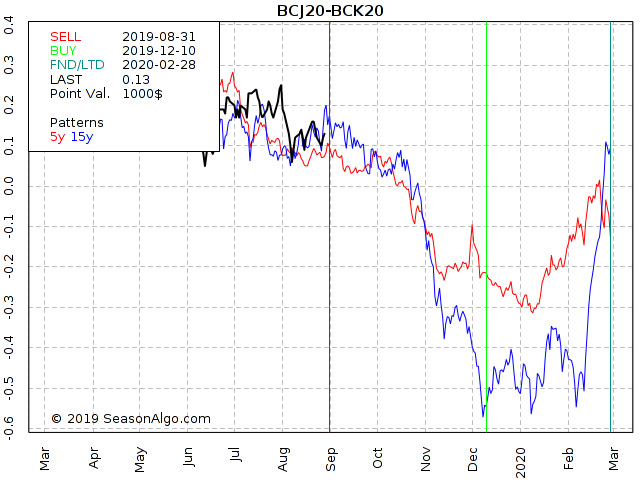
This week, we're looking at short BCJ20 – BCK20: short April 2020 and long May 2020 Brent Crude (NYMEX on Globex).
Today we consider a Brent Crude calendar spread: short April 2020 and long May 2020 Brent Crude (NYMEX on Globex). The spread was trading in a tight range between 0.160 and 0.260 in July, broke to the down-side at the beginning of August and has been trading in a range since then. It seems the former support level around 0.160 became resistance. Is this a good level for an entry or should we better wait for a break out to the down-side?
Andy Jordan is the editor for Traders Notebook which shows you Futures Trading Strategies in Spreads, Options, and Swing Trades. Learn step-by-step how to trade successfully.
Traders Notebook Complete
Learn how to manage this trade by getting daily detailed trading instructions, click here!
The Russell 2000 is simply too easy to trade right now!
The Ambush trading method is specialised in catching intraday market tops and bottoms in a variety of Futures markets. Including the Russell 2000 Mini Future (RTY/M2K) traded at the CME, where Ambush Traders keep on cashing in big time again over the last couple of months!
Ambush day trades on an end-of-day basis so there’s no need to even check the markets during the day.
The Russell 2000 a very popular market out there among traders. It has two of the most important things private traders are looking for liquidity and volatility. I won’t even include a daily chart here as it does look quite boring. To keep it brief, the Russell is trading in a wide range for a long time now. Perfect conditions for Ambush and so this has paid out big time, here are all the recent trades:
Yes, that’s over $6000 within just three month and not even 20 trades! Which means Ambush traders made over $300 on average per trade doing nothing more than placing one entry order per day. I guess most active day traders made a lot less…but their brokers rich!
Now those are huge amounts if you have a small account and you might not want to make or lose hundreds or dollars per trade. Thanks to the new Micro Russell 2000 Mini Contracts (M2K) this is not an issue anymore. You can trade these with a small account now. Here are the results trading one M2K contract:
If that is not enough bang for the buck simply size it up and trade two contracts or three. It’s so great now you can position size as you like exactly matching your risk preferences!
In either case you have to ask yourself if you really can afford to miss out on these trades!
So whether you’re trading a $10k account or a $100k account, Ambush has the right markets for you to start following the signals.
Again, ask yourself if you really can afford to miss out on these trades or at least be aware of the signals? Now if you’ve been on the other sides of these trades trying to buy the breakouts you maybe should think about switching sides?
With Ambush Signals you can easily follow Ambush, a system specialized in catching intraday market tops and bottoms in the Futures markets!
The most popular and easiest way to follow Ambush is Ambush Signals. It does all the work for you, allows you to customise what markets you want to see and has a position sizing tool implemented to automatically adjust the positions to your risk preferences.
Each day around 6:30 pm NY Time the Signals are available for you on the Dashboard. You can then place your orders and literally walk away until the next market close! To find out more about the details of Ambush and how Ambush Signals works, have a look at the Ambush Signals Website.
Let’s be realistic. Following any System can be tough, especially in the beginning. It simply needs time to build the confidence needed to make it through inevitable drawdowns. So what if you are unlucky and don’t catch a good start right away?
I want you to succeed trading Ambush Signals, so here’s something for you that will strongly increase your odds of success and allow you to easily gain the confidence you’ll need to become a long-term profitable Ambush trader.
Did you come up with questions? Don't be shy, email Marco Mayer, he wants to hear from you! This email address is being protected from spambots. You need JavaScript enabled to view it.
To view previous published Chart Scan newsletters, please log in or click on "Join Us,"
shown above, to subscribe to our free "Members Only" section.
A WEALTH OF INFORMATION & EDUCATION:
Joe Ross-Trading Educators' popular free Chart Scan Newsletter has been published since 2004.
Note: Unless otherwise noted, all charts used in Chart Scan commentary were created
by using Genesis Financial Technologies' Trade Navigator (with permission).
Legal Notice and Copyright 2019 Disclaimer - Published by Trading Educators, Inc.
Chart Scan is a complimentary educational newsletter.
"Teach our students the truth in trading - teach them how to trade,"
and
"Give them a way to earn while they learn - realizing that it takes time to develop a successful trader."
Derivative transactions, including futures, are complex and carry a high degree of risk. They are intended for sophisticated investors and are not suitable for everyone.
There are numerous other factors related to the markets in general or to the implementation of any specific trading program which cannot be
fully accounted for in the preparation of hypothetical performance results, and all of which can adversely affect actual trading results.
For more information, see the Risk Disclosure Statement for Futures and Options.