Trades in Stock Options. Receive daily trade recommendations. Can you imagine discovering a way to trade that promises instant income? If you think such a method is impossible, think again. It is definitely achievable, and everything you need to know is available online for one low price that includes special three-part online webinars.
Ambush is a time-proven mean-reversion day trading System focused on a variety of Futures markets around the globe. With Ambush Signals you can now easily follow the Ambush System on a subscription basis for educational purposes.
If you didn't fail early in your trading business, then you have probably been around long enough to realize that many of the problems you encounter as a trader are those that derive from your own individuality. Such problems are common among traders and, in fact, common among all human beings. Seeking spiritual help from a power much greater than your own is the area I address in the "Spiritual Side of Trading".
There is more than one way to think about selling put options. If you are strictly an option trader, you look at selling puts as a way to make money if prices remain sideways, or move up. You are a speculator. As a speculator, you might look at put selling as part of an overall option strategy involving one or more other options.
A person buying a put option can be either an investor or a speculator. As an investor, you want insurance against falling prices of the underlying you own. As a speculator you are hoping to profit from the premium earned if the put fails to reach the strike price of the put by the time the option expires.
At Trading Educators, we view selling puts as being in the insurance business. Insurance companies succeed to the extent that they are good underwriters of risk. With our Instant Income Guaranteed program (IIG), we strive to be excellent underwriters. We view the person buying the put as he/she getting what they want—either insurance, or as a way to speculate on falling prices. By selling puts, we give them what they want. So it is a win-win situation. Both buyer and seller are getting what they want.
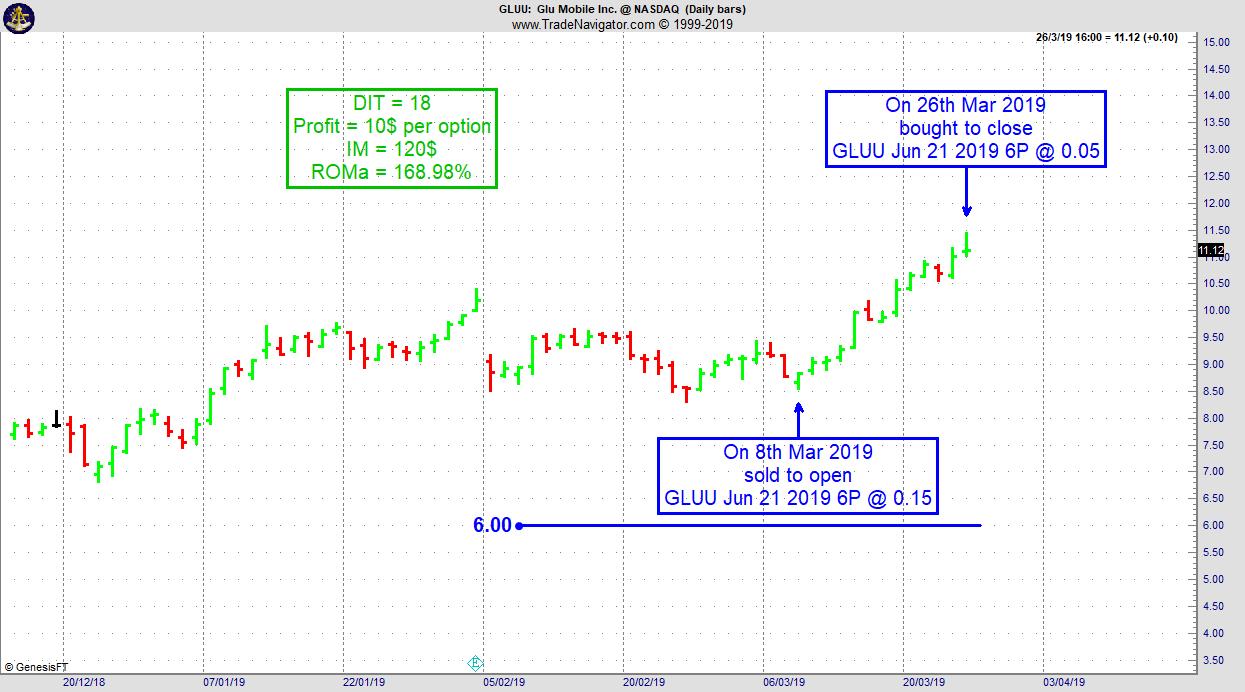
Following is a recent IIG trade. We were in the trade 18 days. Our annualized return on margin of $120 was 168.98%. If you’re tired of the losses you take trading with other methods, give IIG a try.
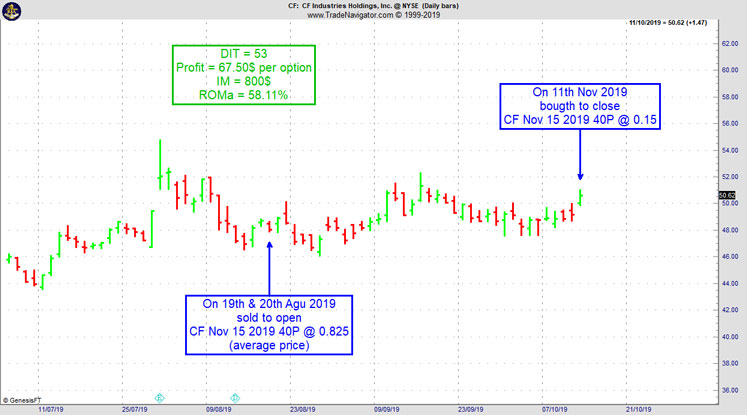
On 18th August 2019 we gave our Instant Income Guaranteed subscribers the following trade on CF Industries Holdings. Inc. (CF). Price insurance could be sold as follows:
On 19th and 20th August 2019, we sold to open CF Nov 15 2019 40P @ 0.825, with 86 days until expiration and our short strike about 17% below price action.
On 11th October 2019, we bought to close CF Nov 15 2019 40P @ 0.15, after 53 days in the trade.
Profit: 67.50$ per option
Margin: 800$
Return on Margin annualized: 58.11
Philippe
30% Savings using coupon code: iig30
Receive daily trade recommendations - we do the research for you.
♦ SIGN UP TODAY! WEALTH BUILDING FOR YOUR FUTURE ♦
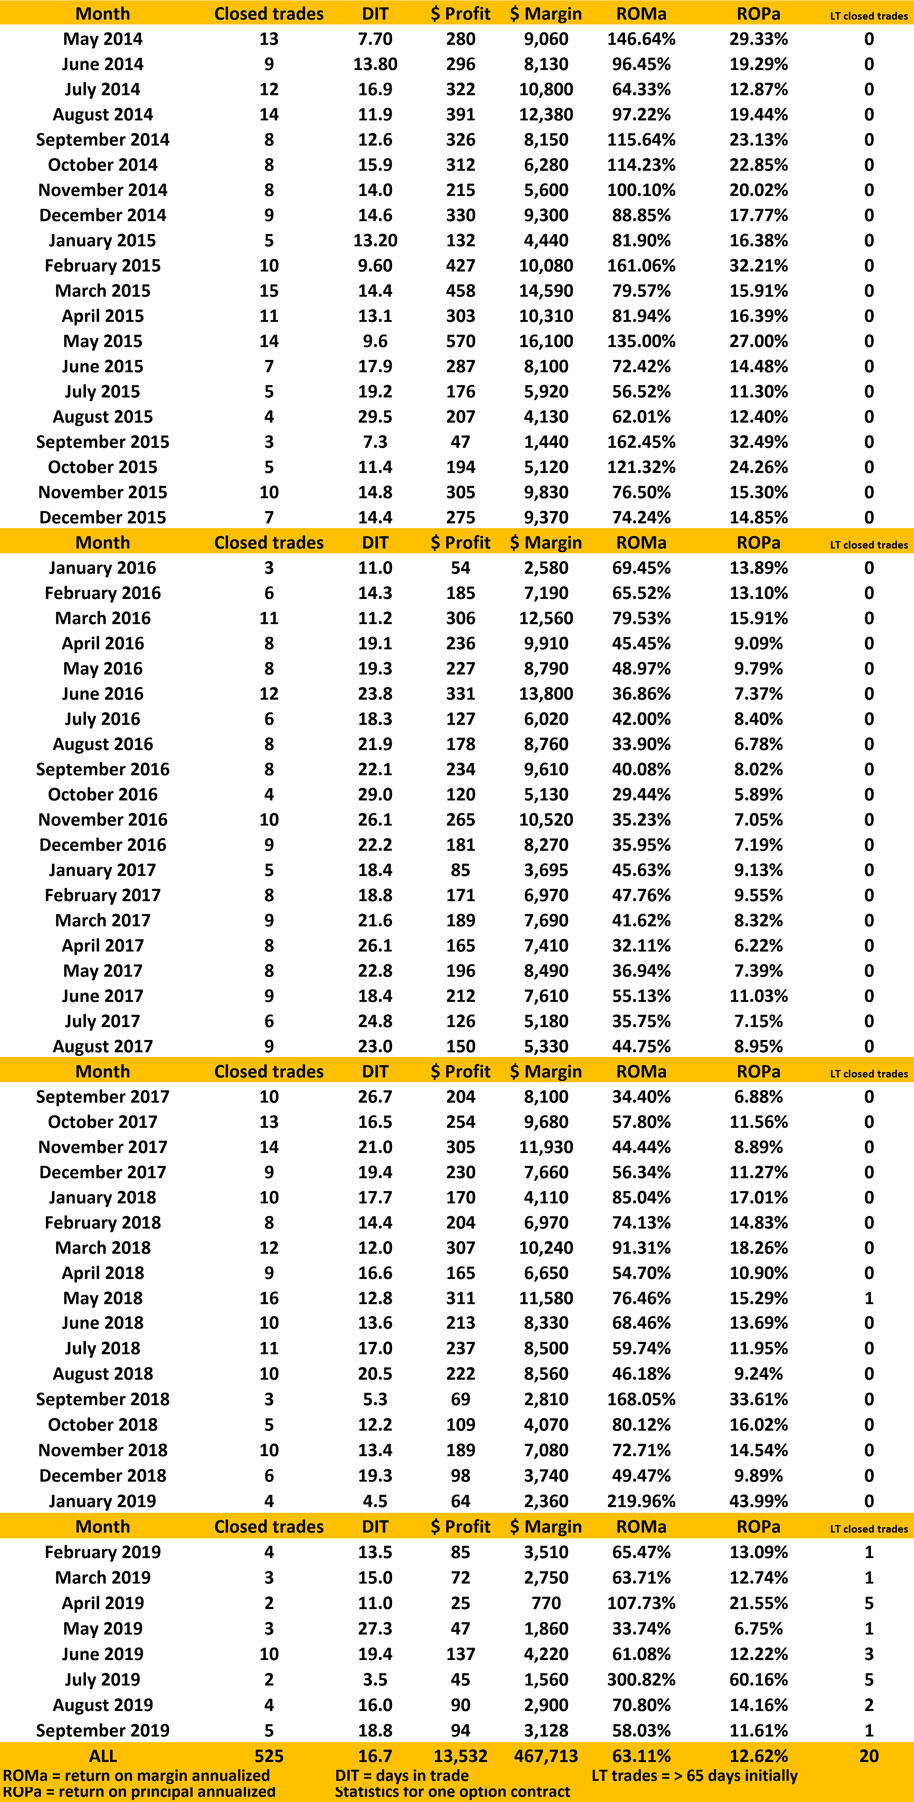
PERFORMANCE RECORD
SEPTEMBER 2019 TO MAY 2014
INSTANT INCOME GUARANTEED
Need more information? We want to hear from you.
Email questions to This email address is being protected from spambots. You need JavaScript enabled to view it.
30% Savings using coupon code: iig30
To become a truly successful trader you must become a truly committed trader. How do you get yourself to be in control?
Statistics and society may predict, but you alone....read more.
Andy Jordan is the editor for Traders Notebook which shows you Futures Trading Strategies in Spreads, Options, and Swing Trades. Learn step-by-step how to trade successfully.
Traders Notebook Complete
Learn how to manage this trade by getting daily detailed trading instructions, click here!
6-Months FREE when you purchase a 6-Month Subscription!
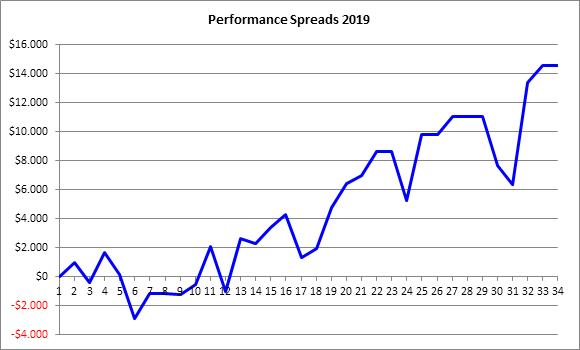
Let's look at the P&L chart of all spread trade recommendations in Traders Notebook since January 2019. I would like to discuss a few things a trader should always check to see if a trading method or a specific way of trading makes sense. As we can see on the (hypothetical) P&L chart from below, the profit reached almost $15k:
What does “$15k” mean?
What was the risk?
What about the draw-downs?
Were there enough trades to see the results are statistically significant?
Let’s go through it, step-by-step:
A result of about $15k is kind of meaningless, as long as we don’t know how much money we need so we can get to this result. This is usually the point, where a good marketing specialist will look up how much margin was used to cover the trades and then he will probably tell you the following: “You could have reached that result with an account size of about $15k, Andy. As you can see, this means a return of about 100%! Isn’t that awesome?” But wait a minute. After the trades are done, it is always easy to calculate the optimized values to present huge profits. But what would have happened if there were more losing trades in a row? Well, easy answer: You would have been out of business! So, let’s have a look at the chart by ourselves and forget about the marketing guy. As we can see, the largest draw-down happened around trade 31 of about $5k. Is there a way we can have a few of these draw-downs in a row? Yes, of course. To be on the save side, we better look at the largest draw-down and we multiply this value a couple of times so we can resist even larger draw-down periods. How often we multiply the draw-down is of course up to each trader, but I would use at least 3 to 4 times the largest draw-down ($15k - $20k). Therefore, an account size of about $30k to $40k or even better $50k make much more sense to reach these results. And if we use for example an account size of $50k for our calculation, our profit is down to about 30%, which is by the way still pretty good in the world of “real trading” and not “marketing trading”.
Of course, you can take the trades also with a smaller account, let’s say with only $25k, but then you should also reduce your profit expectation, just to be not too disappointed after one year of trading. Especially beginning traders get disappointed when they make “only” 20% or 30% a year because they have statements like “I made 1 million out of $10,000 in just one year” in mind. But I can tell you, using good risk and money management parameters, these statements are all bogus.
If you still think the results shown on the chart above are pretty good and you would like to join me with Traders Notebook, I want to make you a special offer today.
Pay for a 6-month subscription and get a 12-month subscription from us! That's right, 12-month subscription for only the 6-month subscription price!
Editor for Traders Notebook which shows you Futures Trading Strategies in Spreads, Options, and Swing Trades. Learn step-by-step how to trade successfully.
If you don’t want to learn how to backtest automatically right now but still want to profit from backtesting, you got to do it manually. That’s how I started too many years ago. I still remember sitting there with printed charts and writing down trade results on a separate sheet of paper.
Now there are some pitfalls you better...read more.
Marco Mayer is an Educator for Forex, Futures and a Systematic Trader, so if you have questions, he wants to hear from you! This email address is being protected from spambots. You need JavaScript enabled to view it.
To view previous published Chart Scan newsletters, please log in or click on "Join Us,"
shown above, to subscribe to our free "Members Only" section.
A WEALTH OF INFORMATION & EDUCATION:
Joe Ross-Trading Educators' popular free Chart Scan Newsletter has been published since 2004.
Note: Unless otherwise noted, all charts used in Chart Scan commentary were created
by using Genesis Financial Technologies' Trade Navigator (with permission).
Legal Notice and Copyright 2019 Disclaimer - Published by Trading Educators, Inc.
Chart Scan is a complimentary educational newsletter.
Let's look at the P&L chart of all spread trade recommendations in Traders Notebook since January 2019. I would like to discuss a few things a trader should always check to see if a trading method or a specific way of trading makes sense. As we can see on the (hypothetical) P&L chart from below, the profit reached almost $15k:
What does “$15k” mean?
What was the risk?
What about the draw-downs?
Were there enough trades to see the results are statistically significant?
Let’s go through it, step-by-step:
A result of about $15k is kind of meaningless, as long as we don’t know how much money we need so we can get to this result. This is usually the point, where a good marketing specialist will look up how much margin was used to cover the trades and then he will probably tell you the following: “You could have reached that result with an account size of about $15k, Andy. As you can see, this means a return of about 100%! Isn’t that awesome?” But wait a minute. After the trades are done, it is always easy to calculate the optimized values to present huge profits. But what would have happened if there were more losing trades in a row? Well, easy answer: You would have been out of business! So, let’s have a look at the chart by ourselves and forget about the marketing guy. As we can see, the largest draw-down happened around trade 31 of about $5k. Is there a way we can have a few of these draw-downs in a row? Yes, of course. To be on the save side, we better look at the largest draw-down and we multiply this value a couple of times so we can resist even larger draw-down periods. How often we multiply the draw-down is of course up to each trader, but I would use at least 3 to 4 times the largest draw-down ($15k - $20k). Therefore, an account size of about $30k to $40k or even better $50k make much more sense to reach these results. And if we use for example an account size of $50k for our calculation, our profit is down to about 30%, which is by the way still pretty good in the world of “real trading” and not “marketing trading”.
Of course, you can take the trades also with a smaller account, let’s say with only $25k, but then you should also reduce your profit expectation, just to be not too disappointed after one year of trading. Especially beginning traders get disappointed when they make “only” 20% or 30% a year because they have statements like “I made 1 million out of $10,000 in just one year” in mind. But I can tell you, using good risk and money management parameters, these statements are all bogus.
If you still think the results shown on the chart above are pretty good and you would like to join me with Traders Notebook, I want to make you a special offer today.
Pay for a 6-month subscription and get a 12-month subscription from us! That's right, 12-month subscription for only the 6-month subscription price!
Editor for Traders Notebook which shows you Futures Trading Strategies in Spreads, Options, and Swing Trades. Learn step-by-step how to trade successfully.
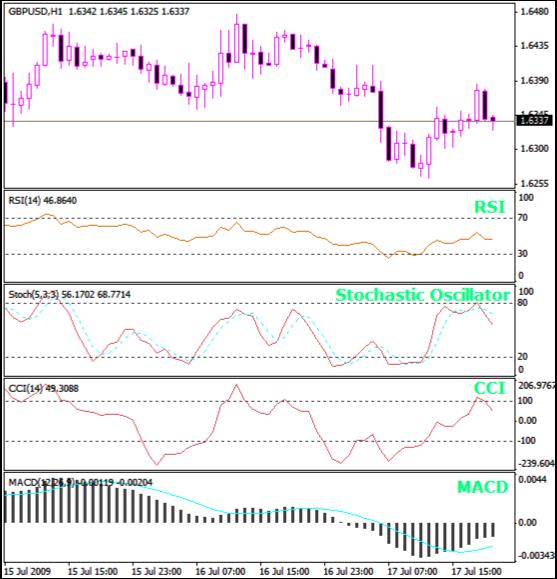
Hi Joe! I’ve attached a graphic showing how I view charts. I figured if all of my indicators are in agreement, then it’s probably okay to trade, especially if there is general agreement with the candlesticks. Please take a look at my chart. Am I on the right track?
What you are doing is a common mistake made by many beginning traders, so, I’m assuming that you are a beginner. If you are not, then you got off to a bad start in trading at some time in the past.
All of the indicators you are using can be employed as momentum indicators. In essence, they are all measuring the same thing—momentum. Within reason, they should all be showing the same thing, they should be in agreement. The only indicator that is not a pure momentum indicator, is CCI, which is really a volatility indicator. But by setting it at 14 bars, you have bastardized it so that it matches the momentum indicators.
Since you are used to looking at candlesticks, I’m not going to comment much about those, other than to say, for the most part studying them is a waste of time. However, virtually all Forex traders seem to use them, with or without having studied all the intricacies of candlestick lore.
All you really need is one of those momentum indicators. And what you want it to do is to confirm what you see in the prices. In other words, you should be trading based on the price action, not on an indicator. Indicators are always late. Use logic! All an indicator can reveal is what has already happened.
Personally, I prefer Stochastics, and I like that you set them at 5,3,3. That makes for a sensitive indicator, which will closely follow the price action. However, I know that many traders prefer MACD. But if you look closely, MACD is the one indicator you have that has been so smoothed, that it is hardly following the price action at all. MACD is useful for longer term trading, but at your current settings, it is not very useful for scalping or short-term trading.
I will make one suggestion: Set CCI at 30 bars, which will make it be truly a volatility indicator. Then if you want to use it along with any other momentum indicator, you will have true confirmation of what is taking place with prices.
In 1981, when I first started day trading, I would get to bed early night, wake up early, and be excited about starting the trading day. I remember on time when it was a cool, sunny day, and I really felt rejuvenated. After a quick...read more.
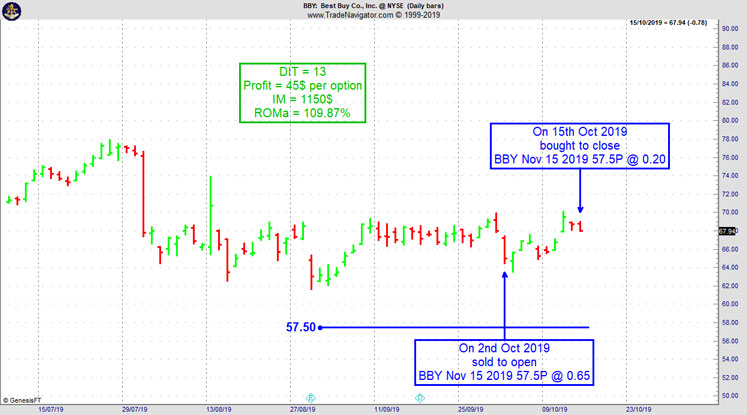
On 29th September 2019 we gave our Instant Income Guaranteed subscribers the following trade on Best Buy Co. Inc. (BBY). Price insurance could be sold as follows:
On 2nd October 2019, we sold to open BBY Nov 15 2019 57.5P @ 0.65, with 45 days until expiration and our short strike about 16% below price action.
On 15th October 2019, we bought to close BBY Nov 15 2019 57.5P @ 0.20, after 13 days in the trade.
Profit: 45$ per option
Margin: 1150$
Return on Margin annualized: 109.87%
Philippe
30% Savings using coupon code: iig30
Receive daily trade recommendations - we do the research for you.
♦ SIGN UP TODAY! WEALTH BUILDING FOR YOUR FUTURE ♦
PERFORMANCE RECORD
SEPTEMBER 2019 TO MAY 2014
INSTANT INCOME GUARANTEED
Need more information? We want to hear from you.
Email questions to This email address is being protected from spambots. You need JavaScript enabled to view it.
30% Savings using coupon code: iig30
Anyone is allowed to make one mistake. When the same mistake is repeated a second time, caution should be noted. The third repetition of the same mistake constitutes....read more.
Andy Jordan is the editor for Traders Notebook which shows you Futures Trading Strategies in Spreads, Options, and Swing Trades. Learn step-by-step how to trade successfully.
Traders Notebook Complete
Learn how to manage this trade by getting daily detailed trading instructions, click here!
6-Months FREE when you purchase a 6-Month Subscription!
If you don’t want to learn how to backtest automatically right now but still want to profit from backtesting, you got to do it manually. That’s how I started too many years ago. I still remember sitting there with printed charts and writing down trade results on a separate sheet of paper.
Now there are some pitfalls you better...read more.
Marco Mayer is an Educator for Forex, Futures and a Systematic Trader, so if you have questions, he wants to hear from you! This email address is being protected from spambots. You need JavaScript enabled to view it.
To view previous published Chart Scan newsletters, please log in or click on "Join Us,"
shown above, to subscribe to our free "Members Only" section.
A WEALTH OF INFORMATION & EDUCATION:
Joe Ross-Trading Educators' popular free Chart Scan Newsletter has been published since 2004.
Note: Unless otherwise noted, all charts used in Chart Scan commentary were created
by using Genesis Financial Technologies' Trade Navigator (with permission).
Legal Notice and Copyright 2019 Disclaimer - Published by Trading Educators, Inc.
Chart Scan is a complimentary educational newsletter.
Today I want to have a look at the P&L chart of all spread trade recommendation in Traders Notebook since January 2019 and I would like to discuss a few things a trader should always check to see if a trading method or a specific way of trading make sense to him or her. As we can see on the (hypothetical) P&L chart from below, the profit reached almost $15k But what does “$15k” mean? What was the risk? What about the draw-downs? Were there enough trades to see the results are statistically significant?
Let’s go through it, step-by-step:
A result of about $15k is kind of meaningless, as long as we don’t know how much money we need so we can get to this result. This is usually the point, where a good marketing specialist will look up how much margin was used to cover the trades and then he will probably tell you the following: “You could have reached that result with an account size of about $15k, Andy. As you can see, this means a return of about 100%! Isn’t that awesome?” But wait a minute. After the trades are done, it is always easy to calculate the optimized values to present huge profits. But what would have happened if there were more losing trades in a row? Well, easy answer: You would have been out of business! So, let’s have a look at the chart by ourselves and forget about the marketing guy. As we can see, the largest draw-down happened around trade 31 of about $5k. Is there a way we can have a few of these draw-downs in a row? Yes, of course. To be on the save side, we better look at the largest draw-down and we multiply this value a couple of times so we can resist even larger draw-down periods. How often we multiply the draw-down is of course up to each trader, but I would use at least 3 to 4 times the largest draw-down ($15k - $20k). Therefore, an account size of about $30k to $40k or even better $50k make much more sense to reach these results. And if we use for example an account size of $50k for our calculation, our profit is down to about 30%, which is by the way still pretty good in the world of “real trading” and not “marketing trading”.
Of course, you can take the trades also with a smaller account, let’s say with only $25k, but then you should also reduce your profit expectation, just to be not too disappointed after one year of trading. Especially beginning traders get disappointed when they make “only” 20% or 30% a year because they have statements like “I made 1 million out of $10,000 in just one year” in mind. But I can tell you, using good risk and money management parameters, these statements are all bogus.
If you still think the results shown on the chart above are pretty good and you would like to join me with Traders Notebook, I want to make you a special offer today.
Pay for a 6-month subscription and get a 12-month subscription from us! That's right, 12-month subscription for only the 6-month subscription price!
Editor for Traders Notebook which shows you Futures Trading Strategies in Spreads, Options, and Swing Trades. Learn step-by-step how to trade successfully.
Traders Notebook Complete
Learn how to manage this trade by getting daily detailed trading instructions, click here!
Mr. Joe! I heard that you have an eBook about stop placement. Would you be willing to tell us at least one of the techniques you have in the book?
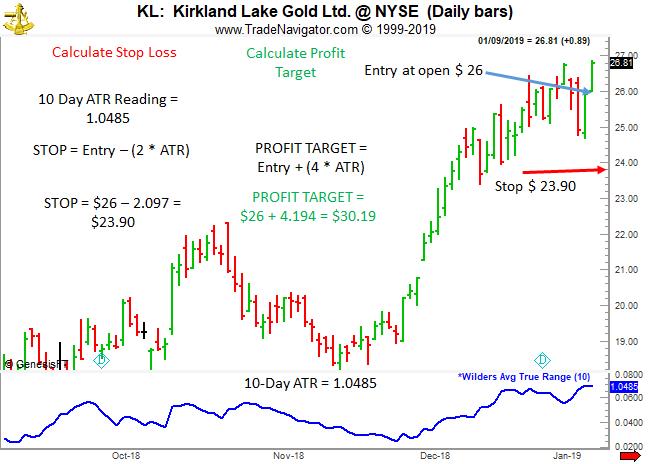
No, I cannot do that, it wouldn’t be fair to those who have purchased the eBook. However, since you asked for something, I am wilfing to offer you a strategy that uses one of the tools from the eBook—that tool is Average True Range (ATR).
For purposes of this article I will use Wilder’s ATR, which is pretty standard in most software. There is a lot of information as to how ATR is calculated available for free on the Internet, so I’m not going to go into that.
Typically, ATR is created with a 14 bar moving average of volatility. My use for ATR in this particular strategy is to use a 10 bar moving average of volatility—or more simply a 10 bar setting for Wilder’s ATR.
The strategy can be used in any time frame within which you want to make a short-term trade. This means anywhere from a few minutes to a few days, or even a few weeks.
Most of the explanation for the strategy can be seen on the chart below:
Step1: Calculate the Stop Loss—Stop loss = Entry price minus 2 times the ATR
Step 2: Calculate the Profit Target—Profit Target plus 4 times the ATR
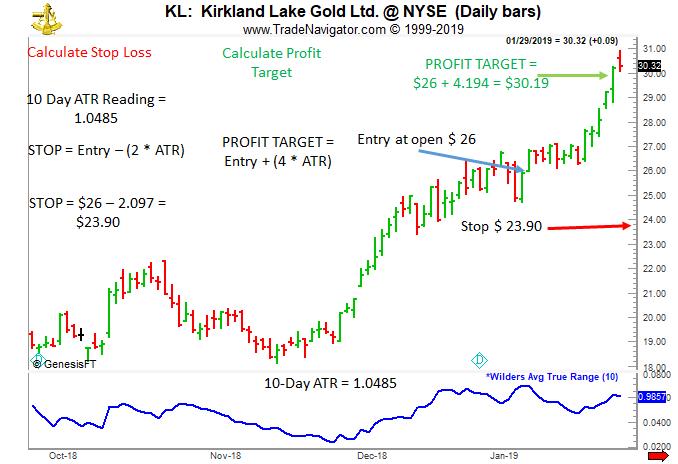
It’s all there on the chart. The following chart shows the result. Make sure you take the ATR reading from the day prior to entry.
Notice the drop in ATR at the time of the profit taking exit. Obviously, volatility has dropped and now reads 0.9857.
The Stop Placement that Makes Sense - Joe Ross wrote "Stopped Out" in order to show you four specialized ways for stop placement. Every single one of them is based on reality. Your stops will rarely be where everyone else puts theirs. Your stops will be unique to you, based on your personal risk tolerance, in conjunction with the risk in the market. Learn more!
Have you ever had a bad day when nothing seemed to go right? First, you got up late. Second, your computer wouldn't boot up, and third, when it did, you couldn't seem to get in and out at the right time when executing even the most basic trade. What really upset...read more.
PERFORMANCE RECORD
SEPTEMBER 2019 TO MAY 2014
INSTANT INCOME GUARANTEED
Need more information? We want to hear from you.
Email questions to This email address is being protected from spambots. You need JavaScript enabled to view it.
30% Savings using coupon code: iig30
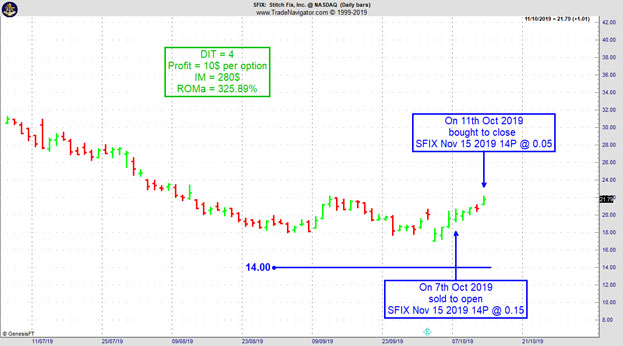
On 6th October 2019 we gave our Instant Income Guaranteed subscribers the following trade on Stitch Fix Inc. (SFIX). Price insurance could be sold as follows:
On 7th October 2019, we sold to open SFIX Nov 15 2019 14P @ 0.15, with 39 days until expiration and our short strike about 29% below price action, making the trade very safe.
On 11th October 2019, we bought to close SFIX Nov 15 2019 14P @ 0.05, after only 4 days in the trade.
Profit: 10$ per option
Margin: 280$
Return on Margin annualized: 325.89%
Philippe
30% Savings using coupon code: iig30
Receive daily trade recommendations - we do the research for you.
♦ SIGN UP TODAY! WEALTH BUILDING FOR YOUR FUTURE ♦
If you don’t want to learn how to backtest automatically right now but still want to profit from backtesting, you got to do it manually. That’s how I started too many years ago. I still remember sitting there with printed charts and writing down trade results on a separate sheet of paper.
Now there are some pitfalls you better...read more.
Marco Mayer is an Educator for Forex, Futures and a Systematic Trader, so if you have questions, he wants to hear from you! This email address is being protected from spambots. You need JavaScript enabled to view it.
To view previous published Chart Scan newsletters, please log in or click on "Join Us,"
shown above, to subscribe to our free "Members Only" section.
A WEALTH OF INFORMATION & EDUCATION:
Joe Ross-Trading Educators' popular free Chart Scan Newsletter has been published since 2004.
Note: Unless otherwise noted, all charts used in Chart Scan commentary were created
by using Genesis Financial Technologies' Trade Navigator (with permission).
Legal Notice and Copyright 2019 Disclaimer - Published by Trading Educators, Inc.
Chart Scan is a complimentary educational newsletter.
Chart Scan with Commentary: Instant Income CBOE Trade
Following is a typical Instant Income Guaranteed trade (IIG). For the past 5 years + these trades have had an average life span of 17 days - a number that is very consistent. Our IIG Advisory Service is something special so take advantage of our 30% off now, as an introductory price for our newsletter subscribers. Use coupon code during checkout: iig30
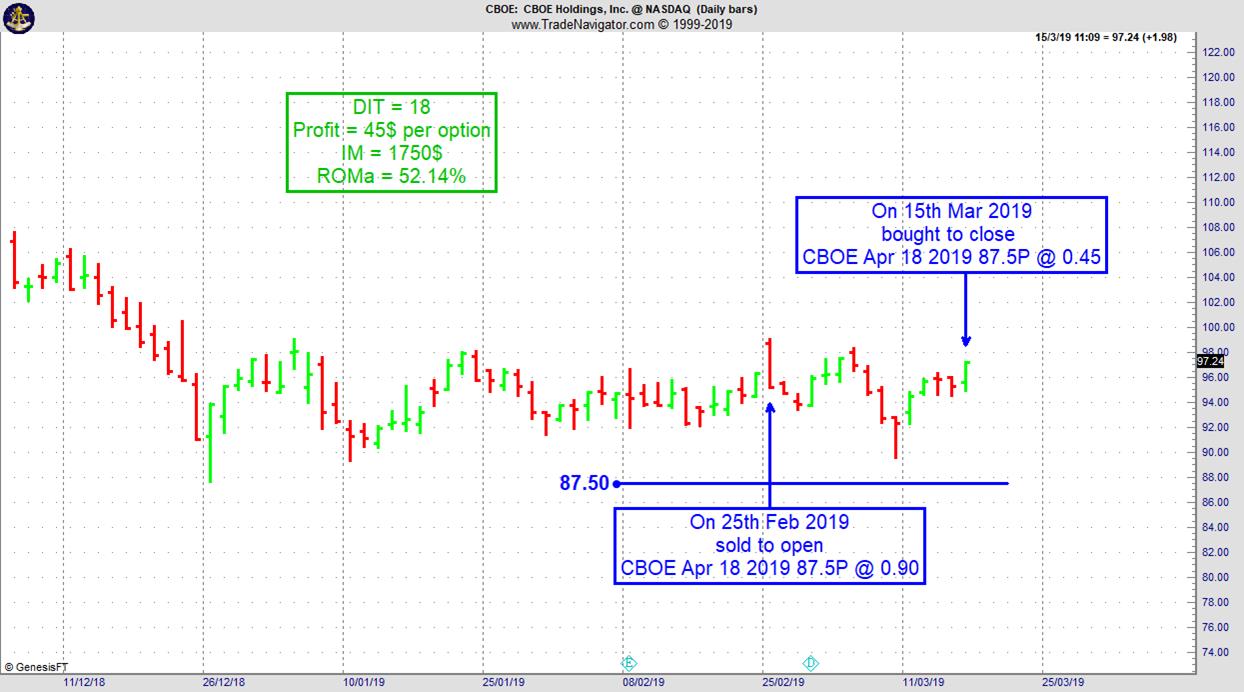
On 24th February 2019 we gave our IIG subscribers the following trade on CBOE Holdings Inc. (CBOE). Price insurance was sold as follows:
On 25th February 2019, we sold to open CBOE Apr 18 2019 87.5P @ 0.90, with 53 days until expiration with our short strike about 9% below price action.
On 15th March 2019, we bought to close CBOE Apr 18 2019 87.5P @ 0.45, after 18 days in the trade, even if CBOE was mostly going sideways during the life of the trade. As with most of our IIG trades, we doubled our money--$0.90 – $0.45. Although we anticipate having a loss sooner or later, we have had none since May of 2014. So far, there have been 584 trades closed out of a total of 616 trades.
If only humans were more like machines. In theory, the ultimate trader would act like a robot, analyzing market data with unfailing accuracy, devising a trading plan, and executing it without flaw. But does trading work that way? Trading is more art than science. Without an intuitive...read more.
PERFORMANCE RECORD
SINCE MAY 2014
INSTANT INCOME GUARANTEED
Need more information? We want to hear from you.
Email questions to This email address is being protected from spambots. You need JavaScript enabled to view it.
30% Savings using coupon code: iig30
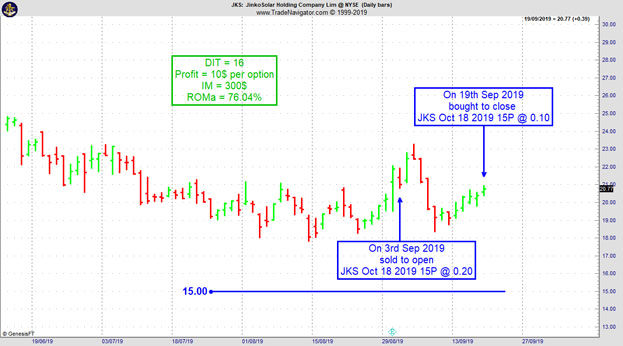
On 1st September 2019 we gave our Instant Income Guaranteed subscribers the following trade on JinkoSolar Holding Ltd (JKS). Price insurance could be sold as follows:
On 3rd September 2019, we sold to open JKS Oct 18 2019 15P @ 0.20, with 46 days until expiration and our short strike about 31% below price action, making the trade very safe.
On 19th September 2019, we bought to close JKS Oct 18 2019 15P @ 0.10, after 16 days in the trade
Profit: 10$ per option
Margin: 300$
Return on Margin annualized: 76.04%
Philippe
30% Savings using coupon code: iig30
Receive daily trade recommendations - we do the research for you.
♦ SIGN UP TODAY! WEALTH BUILDING FOR YOUR FUTURE ♦
In this instance, you spread by taking an opposite position in a related contract. You might spread corn against wheat. You might spread heating oil against unleaded gasoline. Quite often, operators who trade large size and are market makers hedge the S&P 500 by taking an opposite position in the Nasdaq or the Dow.
(Some basic mathematics stuff a trader should know – but don’t get discouraged if the first part of this lesson seems very complicated. It all becomes crystal clear later on.)
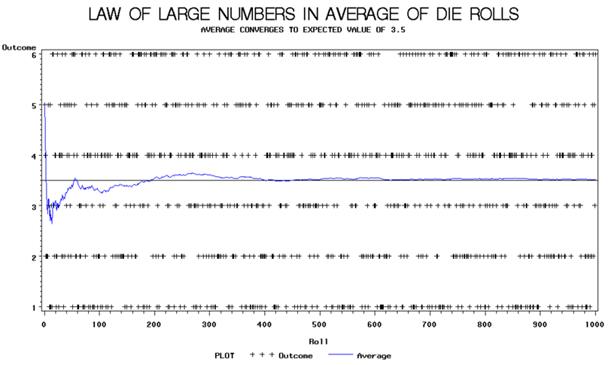
The law of large numbers (LLN) is a theorem in probability that describes the long-term stability of the mean of a random variable. Given a random variable with a finite expected value, if its values are repeatedly sampled, as the number of these observations increases, their mean will tend to approach and stay close to the expected value.
The LLN can easily be illustrated using the rolls of a die. That is, outcomes of a multinomial distribution in which the numbers 1, 2, 3, 4, 5, and 6 are equally likely to be chosen. The population mean (or "expected value") of the outcomes is:
(1 + 2 + 3 + 4 + 5 + 6) / 6 = 3.5.
The graph below plots the results of an experiment of rolls of a die. In this experiment we see that the average of die rolls deviates wildly at first. As predicted by LLN, the average stabilizes around the expected value of 3.5 as the number of observations becomes larger.
The LLN is important because it "guarantees" stable long-term results for random events. For example, while a casino may lose money in a single spin of the American roulette wheel, it will almost certainly gain very close to 5.3% of all gambled money over thousands of spins. Any winning streak by a player will eventually be overcome by the parameters of the game. It is important to remember that the LLN only applies (as the name indicates) when a large number of observations are considered. There is no principle that a small number of observations will converge to the expected value, or that a streak of one value will immediately be "balanced" by the others.
So, why is this important for a trader?
It is important to understand that we all trade based on probabilities. All we really know is that we can make money with trading only in the long run. We have no idea of what will happen with our next trade, or with the next ten trades!
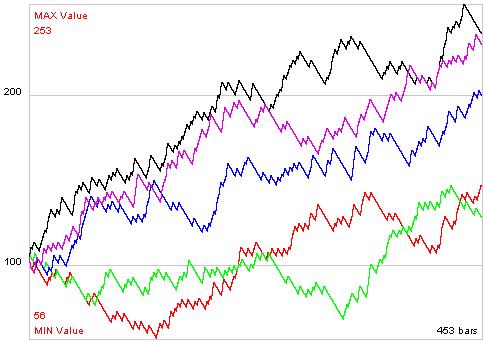
Let’s have a look at the following chart:
The 5 equity curves from above are based on a trading method with the following statistical values:
Winning Percentage is 20%, and the winners are 5 times bigger then the losers.
As we can see on the chart above, all equity curves are showing a profit in the long run. But we would have to go through different emotional periods while trading on the same probabilities. The trader trading the red line would get mad right in the beginning. He would start losing in the beginning, but do well later. The green trader would get even more frustrated. After trading for almost nothing for the first half, the equity goes down a lot before moving up nicely at end of the year.
As you can see, both would end the year with almost the same result. But the way they got there was completely different.
Once again, all curves above are based and calculated at random using the same parameters.
What does this mean for us?
This means we have to make sure we stay in the water long enough for the big wave to take us into the profit zone. We have no idea when this will happen, at the beginning of the year or at the end.
Here is what we have to do:
We need a solid money management technique. There is no way to get around losing periods, and we have to make sure we survive such times.
We have to understand how important it is to look at our results in the long run. Everything that happens in a shorter time period has no meaning.
We need a solid system we can follow. Otherwise we will have problems following the system in bad times (many, many traders don’t understand this point and they just jump from one method to the next, losing all the money they have).
We have to make sure we let the big winning trades run, and cash in as much as we can on such trades.
We have to stay “in the water.” We just don’t know if the next trade will be a losing trade, a winning trade, or one of the really “big fishes”.
Trading is not about what happens on a single trade. What really counts is if your trading is based on a solid method, and that you understand good money management. If so, the large numbers of tries will make sure you are profitable in the long run.
Andy Jordan is the editor for Traders Notebook which shows you Futures Trading Strategies in Spreads, Options, and Swing Trades. Learn step-by-step how to trade successfully.
Traders Notebook Complete
Learn how to manage this trade by getting daily detailed trading instructions, click here!
If you don’t want to learn how to backtest automatically right now but still want to profit from backtesting, you got to do it manually. That’s how I started too many years ago. I still remember sitting there with printed charts and writing down trade results on a separate sheet of paper.
Now there are some pitfalls you better...read more.
Marco Mayer is an Educator for Forex, Futures and a Systematic Trader, so if you have questions, he wants to hear from you! This email address is being protected from spambots. You need JavaScript enabled to view it.
To view previous published Chart Scan newsletters, please log in or click on "Join Us,"
shown above, to subscribe to our free "Members Only" section.
A WEALTH OF INFORMATION & EDUCATION:
Joe Ross-Trading Educators' popular free Chart Scan Newsletter has been published since 2004.
Note: Unless otherwise noted, all charts used in Chart Scan commentary were created
by using Genesis Financial Technologies' Trade Navigator (with permission).
Legal Notice and Copyright 2019 Disclaimer - Published by Trading Educators, Inc.
Chart Scan is a complimentary educational newsletter.
For every 10 issues of Chart Scan that I write, I like to include at least one historical spread trade.
If you’re not trading spreads, you are missing out on some really good trades. If you want to be a master trader, I believe that you need to learn how to trade everything—spreads, options on both stocks and futures, short-term, and long-term trades, and seasonal trades in stocks and futures, and learn to trade Forex as well, although for the major currencies, I prefer the futures markets.
You can create your own library of seasonal spreads as well as spreads in the outrights (stocks, futures, Forex) by looking back at what has happened in the past, especially looking for seasonality.For every 10 issues of Chart Scan that I write, I like to include at least one historical spread trade.
If you’re not trading spreads, you are missing out on some really good trades. If you want to be a master trader, I believe that you need to learn how to trade everything—spreads, options on both stocks and futures, short-term, and long-term trades, and seasonal trades in stocks and futures, and learn to trade Forex as well, although for the major currencies, I prefer the futures markets.
You can create your own library of seasonal spreads as well as spreads in the outrights (stocks, futures, Forex) by looking back at what has happened in the past, especially looking for seasonality.
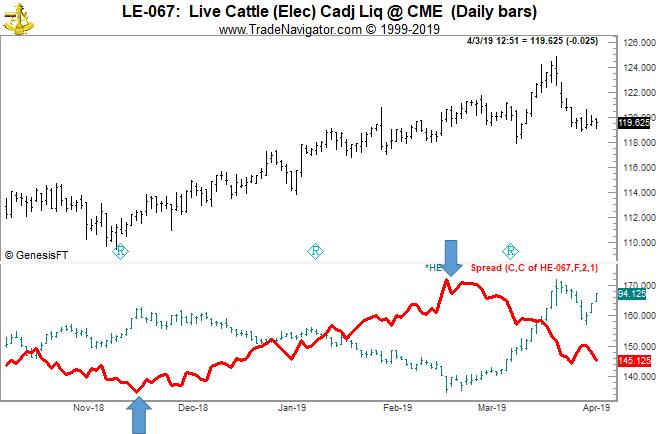
The chart above shows a spread long live cattle and short lean hogs. Looking back from the current date April 3, we see that sometime around mid-November, the spread moved up during the previous year. The spread rose overall in favor of long cattle, until about the 3rd week in February, at which time the spread changed direction in favor of long hogs.
By reversing the spread to be long lean hogs and short live cattle, money was made from the last week of February, until at least the last week of March.
The next step would be to look back to see if this happens in most years. Seasonal spreads in the meats have a lot to do with the birth cycle of cattle and hogs, so it’s quite possible that this spread is consistent during most years. If you find the spread works at least 80% of the time, then by all means make a note of it, and look for it again next year. By doing this, you will end up with a library of high (80%) percentage spreads that you can enter into year after year.
Do you ever wonder if you secretly want to fail? It's hard to believe, but some people do want to fail. They may not want to do better than their parents, and secretly, they set themselves up for failure. Others fear success. They associate...read more.
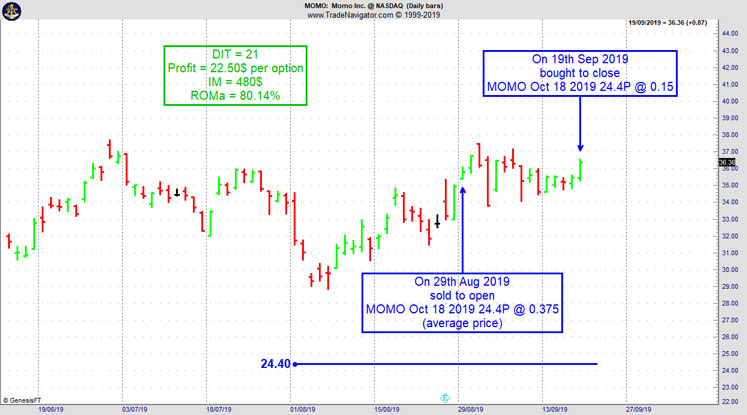
On 28th August 2019 we gave our Instant Income Guaranteed subscribers the following trade on Momo Inc. (MOMO). Price insurance could be sold as follows:
On 29th August 2019, we sold to open MOMO Oct 18 2019 24.4P @ 0.375 (average price), with 49 days until expiration and our short strike about 30% below price action, making the trade very safe.
On 19th September 2019, we bought to close MOMO Oct 18 2019 24.4P @ 0.15, after 21 days in the trade.
Profit: 22.50$ per option
Margin: 480$
Return on Margin annualized: 80.14%
Philippe
Receive daily trade recommendations - we do the research for you.
♦ SIGN UP TODAY! WEALTH BUILDING FOR YOUR FUTURE ♦
Trading Article: Spreading Against a Related Contract
In this instance, you spread by taking an opposite position in a related contract. You might spread corn against wheat. You might spread heating oil against unleaded gasoline. Quite often, operators who trade large size and are market makers hedge the S&P 500 by taking an opposite position in the Nasdaq or the Dow.
Andy Jordan is the editor for Traders Notebook which shows you Futures Trading Strategies in Spreads, Options, and Swing Trades. Learn step-by-step how to trade successfully.
Traders Notebook Complete
Learn how to manage this trade by getting daily detailed trading instructions, click here!
The Russell 2000 is simply too easy to trade right now!
The Ambush trading method is specialised in catching intraday market tops and bottoms in a variety of Futures markets. Including the Russell 2000 Mini Future (RTY/M2K) traded at the CME, where Ambush Traders keep on cashing in big time again over the last couple of months!
Ambush day trades on an end-of-day basis so there’s no need to even check the markets during the day.
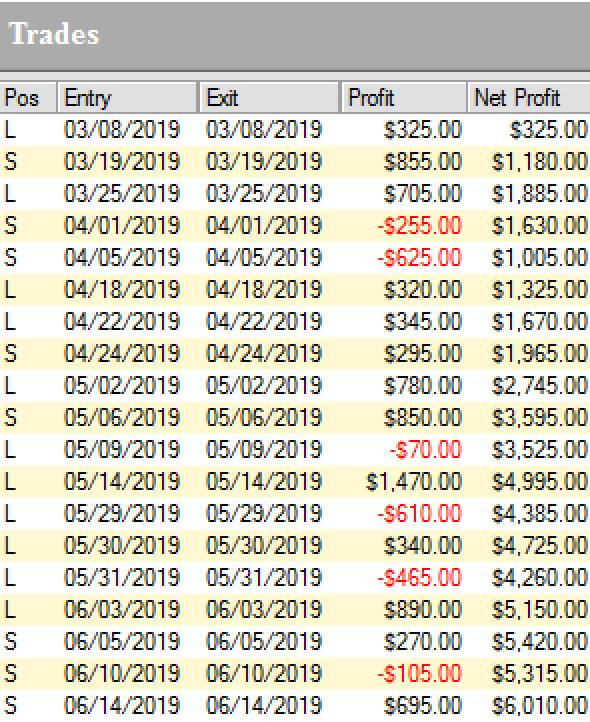
The Russell 2000 a very popular market out there among traders. It has two of the most important things private traders are looking for liquidity and volatility. I won’t even include a daily chart here as it does look quite boring. To keep it brief, the Russell is trading in a wide range for a long time now. Perfect conditions for Ambush and so this has paid out big time, here are all the recent trades:
Yes, that’s over $6000 within just three month and not even 20 trades! Which means Ambush traders made over $300 on average per trade doing nothing more than placing one entry order per day. I guess most active day traders made a lot less…but their brokers rich!
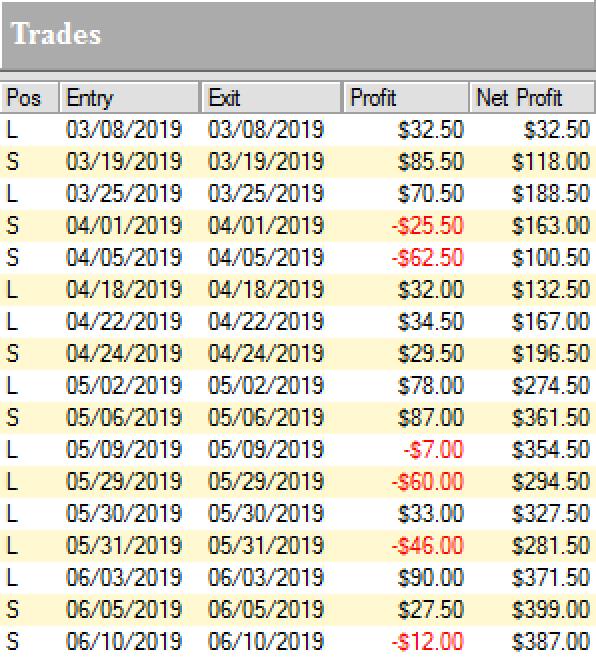
Now those are huge amounts if you have a small account and you might not want to make or lose hundreds or dollars per trade. Thanks to the new Micro Russell 2000 Mini Contracts (M2K) this is not an issue anymore. You can trade these with a small account now. Here are the results trading one M2K contract:
If that is not enough bang for the buck simply size it up and trade two contracts or three. It’s so great now you can position size as you like exactly matching your risk preferences!
In either case you have to ask yourself if you really can afford to miss out on these trades!
So whether you’re trading a $10k account or a $100k account, Ambush has the right markets for you to start following the signals.
Again, ask yourself if you really can afford to miss out on these trades or at least be aware of the signals? Now if you’ve been on the other sides of these trades trying to buy the breakouts you maybe should think about switching sides?
With Ambush Signals you can easily follow Ambush, a system specialized in catching intraday market tops and bottoms in the Futures markets!
The most popular and easiest way to follow Ambush is Ambush Signals. It does all the work for you, allows you to customise what markets you want to see and has a position sizing tool implemented to automatically adjust the positions to your risk preferences.
Each day around 6:30 pm NY Time the Signals are available for you on the Dashboard. You can then place your orders and literally walk away until the next market close! To find out more about the details of Ambush and how Ambush Signals works, have a look at the Ambush Signals Website.
Let’s be realistic. Following any System can be tough, especially in the beginning. It simply needs time to build the confidence needed to make it through inevitable drawdowns. So what if you are unlucky and don’t catch a good start right away?
I want you to succeed trading Ambush Signals, so here’s something for you that will strongly increase your odds of success and allow you to easily gain the confidence you’ll need to become a long-term profitable Ambush trader.
Did you come up with questions? Don't be shy, email Marco Mayer, he wants to hear from you! This email address is being protected from spambots. You need JavaScript enabled to view it.
To view previous published Chart Scan newsletters, please log in or click on "Join Us,"
shown above, to subscribe to our free "Members Only" section.
A WEALTH OF INFORMATION & EDUCATION:
Joe Ross-Trading Educators' popular free Chart Scan Newsletter has been published since 2004.
Note: Unless otherwise noted, all charts used in Chart Scan commentary were created
by using Genesis Financial Technologies' Trade Navigator (with permission).
Legal Notice and Copyright 2019 Disclaimer - Published by Trading Educators, Inc.
Chart Scan is a complimentary educational newsletter.
"Teach our students the truth in trading - teach them how to trade,"
and
"Give them a way to earn while they learn - realizing that it takes time to develop a successful trader."
Derivative transactions, including futures, are complex and carry a high degree of risk. They are intended for sophisticated investors and are not suitable for everyone.
There are numerous other factors related to the markets in general or to the implementation of any specific trading program which cannot be
fully accounted for in the preparation of hypothetical performance results, and all of which can adversely affect actual trading results.
For more information, see the Risk Disclosure Statement for Futures and Options.