Trades in Stock Options. Receive daily trade recommendations. Can you imagine discovering a way to trade that promises instant income? If you think such a method is impossible, think again. It is definitely achievable, and everything you need to know is available online for one low price that includes special three-part online webinars.
Ambush is a time-proven mean-reversion day trading System focused on a variety of Futures markets around the globe. With Ambush Signals you can now easily follow the Ambush System on a subscription basis for educational purposes.
If you didn't fail early in your trading business, then you have probably been around long enough to realize that many of the problems you encounter as a trader are those that derive from your own individuality. Such problems are common among traders and, in fact, common among all human beings. Seeking spiritual help from a power much greater than your own is the area I address in the "Spiritual Side of Trading".
Lately, I’ve been teaching a student in China via SKYPE. One of the questions that has come up and also via seminars and emails is, “Where do you put the Stop?” That has to be the most loaded question I ever receive, because there is no definitive answer. However, in getting as close as I possibly could, I wrote an e-Book called “Stopped Out,” in which I did my best to answer that question. In it I showed the weaknesses in some stop placement schemes and the strength in others.
I received a question in via email about the “Volatility Stop indicator.” Joe, have you ever heard of Welles Wilder’s Volatility Stop? Do you know how to use it? I would appreciate any comments you care to make about it!
I have used VS in the past, and it’s a very good way to trail a stop when a market is trending. It is virtually worthless in a sideways market, unless that market is swinging wildly, with huge swings from high to low.
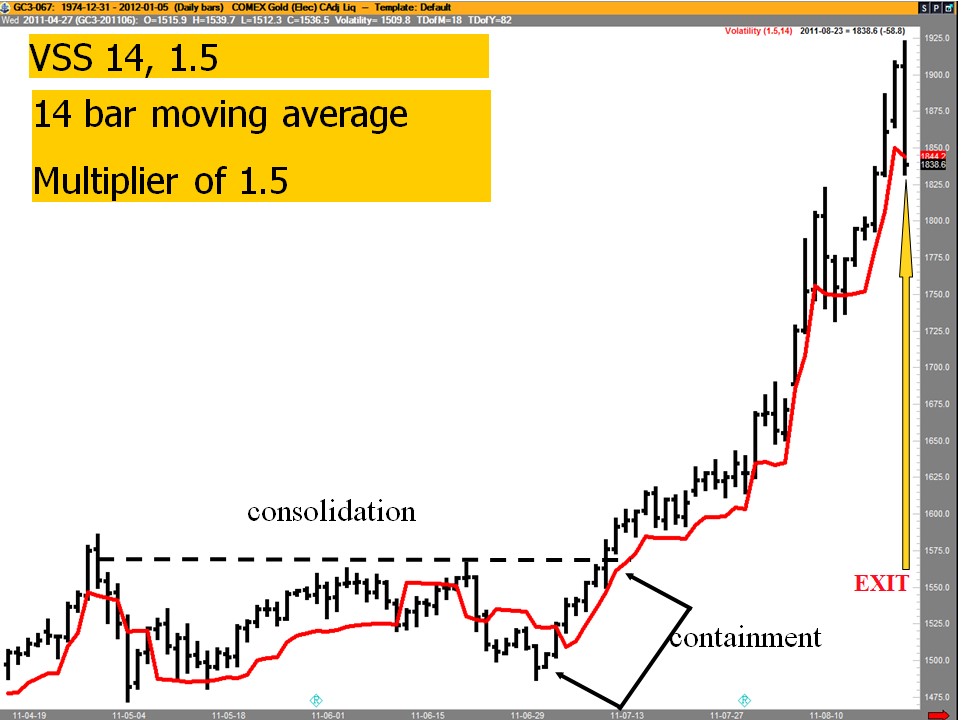
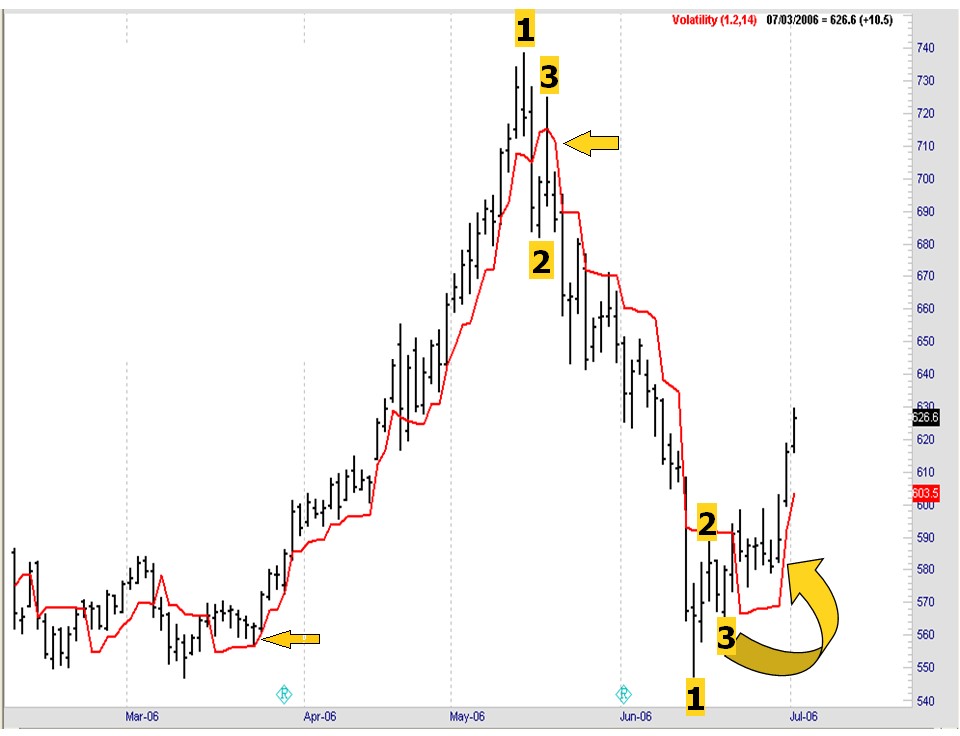
The trick I always used was what I call containment of the trend. As prices come out of congestion, typically with a 1-2-3 formation, possibly followed by a Ross hook, I begin looking for VS to curve around #3 point and begin tracking below the prices in an uptrend or above the prices in a downtrend.
We’ll look at that now.
VS has 3 possible parameters. A moving average, a multiplier, and an offset feature (not all software have the offset). You have to fool around with the parameter settings until you find a best fit situation. By changing the parameters, we can curve fit VS to give us containment.
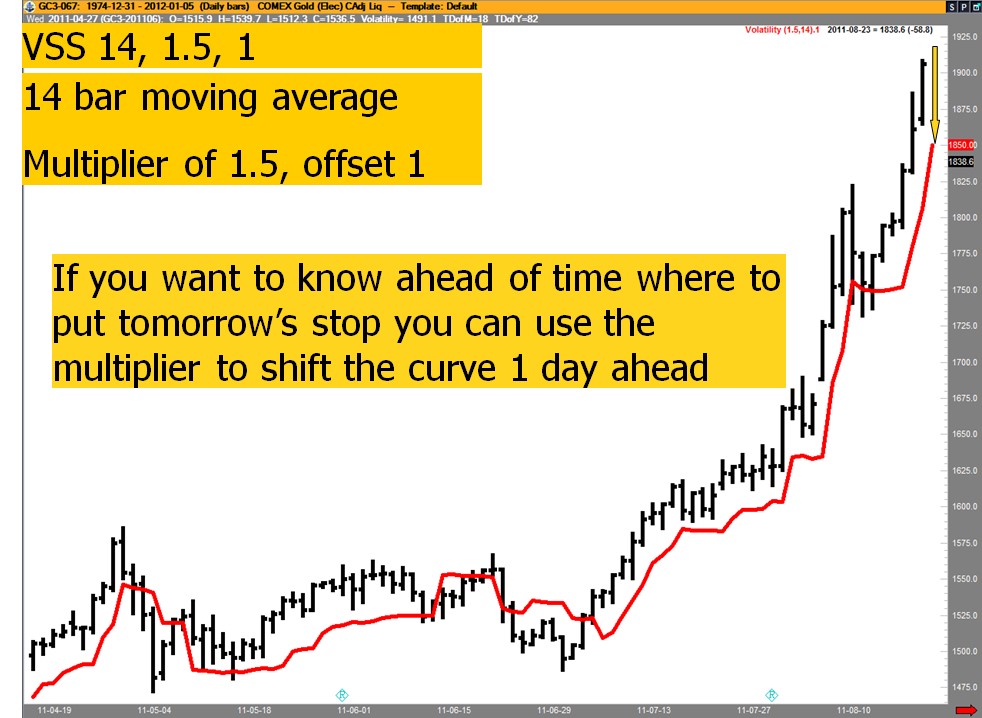
Once you are in the trade, you stay in until you get a close at or below the VS line. Interestingly, if you want to know where to put tomorrow ‘s stop, you can offset (displace) VS by one (or more) bars.
The next chart shows how by manipulating the settings, I was able to contain prices at 3 different turning points.
If you’re like most modern traders, you try to do it all. You study charts and historical data for trading opportunities. You struggle to devise a thorough, well-designed trading plan. You enter trades on your own electronic trading platform, and you monitor your trades to make midcourse corrections when necessary. Depending on your personality, available resources...read more.
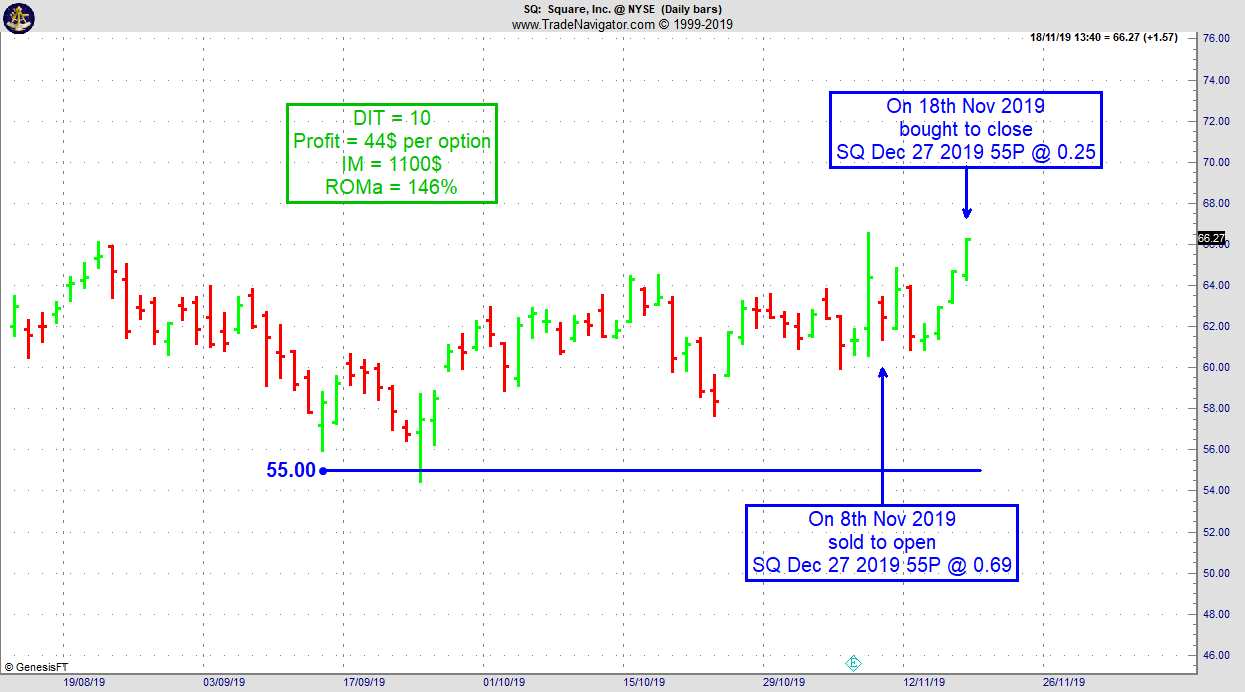
On 7th November 2019 we gave our Instant Income Guaranteed subscribers the following trade on Square Inc. (SQ). Price insurance could be sold as follows:
On 8th November 2019, we sold to open SQ Dec 27 2019 55P @ 0.69, with 49 days until expiration and our short strike about 15% below price action.
On 18th November 2019, we bought to close SQ Dec 27 2019 55P @ 0.25, after 10 days in the trade
To become a truly successful trader you must become a truly committed trader. How do you get yourself to be in control?
Statistics and society may predict, but you alone...read more.
Andy Jordan is the editor for Traders Notebook which shows you Futures Trading Strategies in Spreads, Options, and Swing Trades. Learn step-by-step how to trade successfully.
If you don’t want to learn how to backtest automatically right now but still want to profit from backtesting, you got to do it manually. That’s how I started too many years ago. I still remember sitting there with printed charts and writing down trade results on a separate sheet of paper.
Now there are some pitfalls you better...read more.
Marco Mayer is an Educator for Forex, Futures and a Systematic Trader, so if you have questions, he wants to hear from you! Contact Marco with questions!
To view previous published Chart Scan newsletters, please log in or click on "Join Us,"
shown above, to subscribe to our free "Members Only" section.
A WEALTH OF INFORMATION & EDUCATION:
Joe Ross-Trading Educators' popular free Chart Scan Newsletter has been published since 2004.
Note: Unless otherwise noted, all charts used in Chart Scan commentary were created
by using Genesis Financial Technologies' Trade Navigator (with permission).
Legal Notice and Copyright 2019 Disclaimer - Published by Trading Educators, Inc.
Chart Scan is a complimentary educational newsletter.
I am thankful for good health, and the ability to still trade, which I do almost every trading day. I’m thankful that my mind is still intact, and to be able to share what I’ve learned with others.
I’m thankful for our wonderful staff at TE, and for the many customers who have stuck with us over the years.
I’m thankful that the world is still mostly at peace and that I live in a country that offers much in the way of freedom. To be able to openly worship God is a great blessing for me, and others who feel the same way.
I have a roof over my head, food to eat, clothes to wear and a family to love.
I’m thankful for each one of you, and wish for every possible benefit to be yours,
I am in shock! Someone wrote in to ask about long-term trading. Do traders still trade that way? I thought just about everyone is trying to be a day trader these days. The following is the question posed to me:
Hey Joe! Do you have a simple way to follow a trend? Something that tells me when to get in and when to get out?
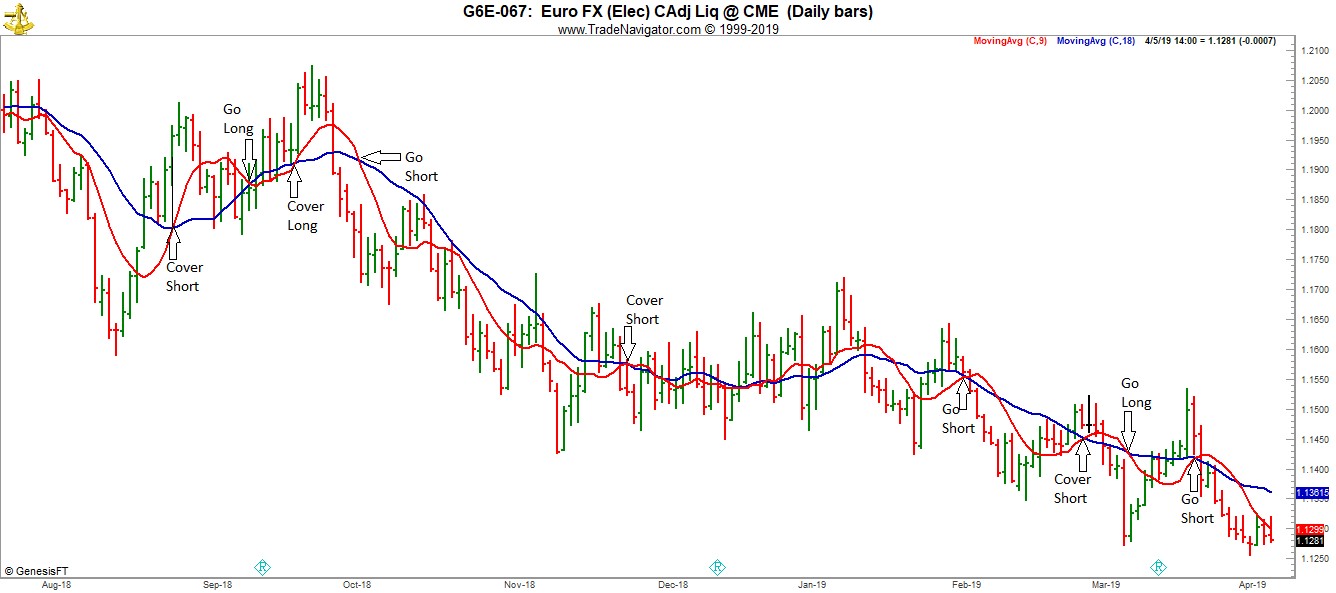
Take a look at the chart below. Then I’ll explain it. It is one of the first ways I learned to trade. With $125 per round turn commissions, I had to be able to stay in a trend just to get out of the commission hole I was in. You guys have no idea what it was like having to pay such high commissions.
Starting from left to right: You were already short with prices moving into the first arrow. So when the blue line crossed the red line, you covered your short position. Notice that blue at that point was not indicating any direction—it was flat. When blue again crossed red, you went long—blue had upward direction.
Blue crossed red, so you had to sell to cover your long, and go short. You were probably stopped out with a loss.
Blue crossed red, and you went short, for a real nice ride. Blue crossed red again and you covered your short. Blue and red began running together. Go trade something else.
Finally, they began to separate again (at the second downward red loop, which came after the breakout of the trading range), blue crossed red, go short. Blue crossed red cover short, and go long. Blue crossed red, buy back long, and go short.
The method says you cannot perform the same action twice in a row. You either get out, or get out and reverse. You have to play with it for a while, across different markets. It works, and I used it for a long time.
What is the blue line? It’s a simple 18 bar moving average. It is really the trend line. What is the red line? It’s a simple 9 bar moving average. It is the trigger line. Crossing it triggers some kind of action. Making the moving average exponential, might make the method even better. I never tried it, because my weekly chart service had them as simple moving averages.
Do you remember your first impressions of trading? Perhaps you were young and had a strong desire to achieve early success, but if you were like most people, you had unrealistic expectations about the financial resources and skill level that were needed to trade profitably. You probably figured that you could just open a typical online brokerage account and turn $1,500 into a fortune. You probably didn’t hold this misconception very long, though. Soon, you learned that you needed...read more.
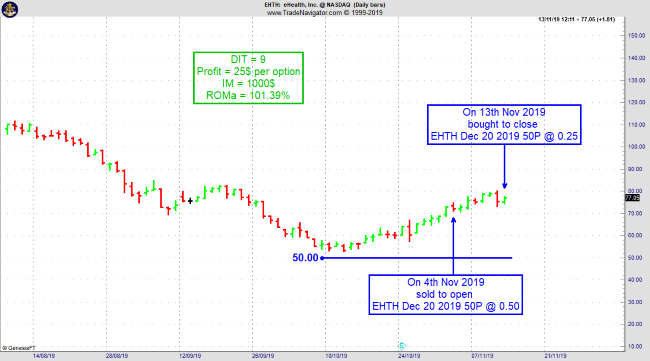
On 3rd November 2019 we gave our Instant Income Guaranteed subscribers the following trade on eHealth Inc. (EHTH). Price insurance could be sold as follows:
On 4th November 2019, we sold to open EHTH Dec 20 2019 50P @ 0.50, with 46 days until expiration and our short strike about 32% below price action.
On 13th November 2019, we bought to close EHTH Dec 20 2019 50P @ 0.25, after 9 days in the trade.
Need more information? We want to hear from you.
Email questions to This email address is being protected from spambots. You need JavaScript enabled to view it.
Trading Article: Is learning the trading business like learning any other business?
The importance of how you learn the business of trading cannot be minimized because of the factors that determine your success or failure. Learning the business of trading is...read more.
Andy Jordan is the editor for Traders Notebook which shows you Futures Trading Strategies in Spreads, Options, and Swing Trades. Learn step-by-step how to trade successfully.
If you don’t want to learn how to backtest automatically right now but still want to profit from backtesting, you got to do it manually. That’s how I started too many years ago. I still remember sitting there with printed charts and writing down trade results on a separate sheet of paper.
Now there are some pitfalls you better...read more.
Marco Mayer is an Educator for Forex, Futures and a Systematic Trader, so if you have questions, he wants to hear from you! This email address is being protected from spambots. You need JavaScript enabled to view it.
To view previous published Chart Scan newsletters, please log in or click on "Join Us,"
shown above, to subscribe to our free "Members Only" section.
A WEALTH OF INFORMATION & EDUCATION:
Joe Ross-Trading Educators' popular free Chart Scan Newsletter has been published since 2004.
Note: Unless otherwise noted, all charts used in Chart Scan commentary were created
by using Genesis Financial Technologies' Trade Navigator (with permission).
Legal Notice and Copyright 2019 Disclaimer - Published by Trading Educators, Inc.
Chart Scan is a complimentary educational newsletter.
Read Joe's latest Chart Scan with Commentary: Favorite Indicator
Use Coupon Code to Receive 35% OFF when you purchase Trading MORE Special Set-Ups MORE35
People often ask me about indicators, but recently, someone wrote in to ask, “What is your favorite indicator?”
As many of you know, I’m not big on using indicators. They can be useful for confirmation of what you see on a chart, and as many might know, they can be useful for predicting what other traders might do. For example, traders will react in a certain way when a 50 bar moving average crosses a 200 bar moving average, and vice-versa.
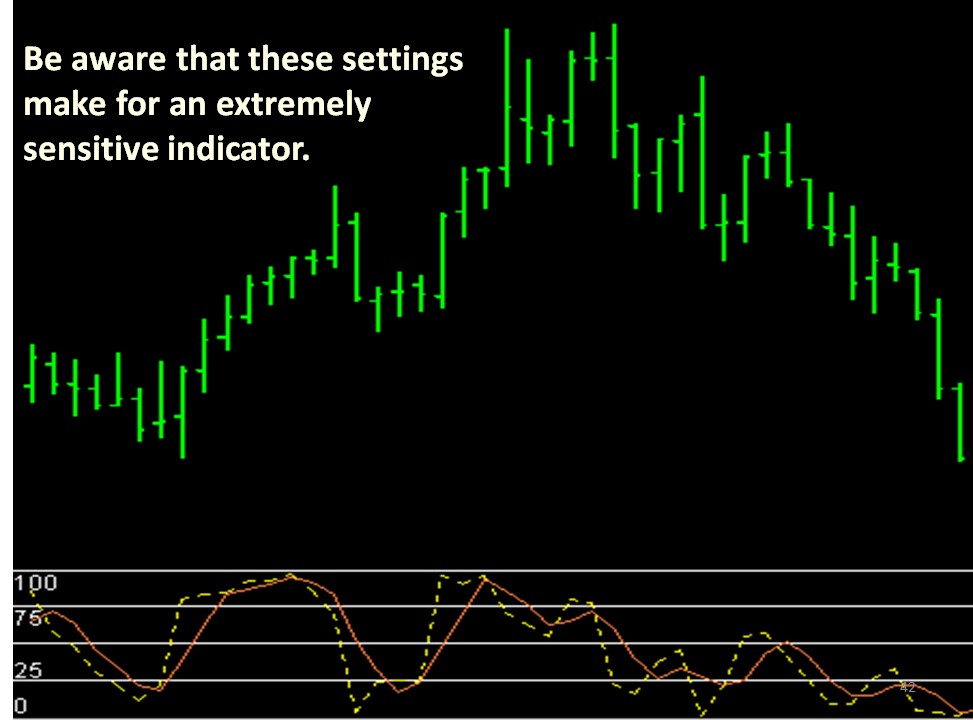
If I actually have a favorite indicator, it would have to be the 5,3,3 Stochastic. Let’s take a look.
The setting of ‘5’ is the number of bars (15 minutes, in this case) we are using for the calculation. The number ‘3’ is the smoothing factor for %K, and the other number ‘3’ is the setting we are using for %D. %K represents the moving average of the Stochastic values, and is the dashed yellow line on the next chart. %D is a ‘3 bar’ moving average of the %K, the solid orange line, also called the “Slow Stochastic.”
Be aware that these settings make for an extremely sensitive indicator. However, if we are going to use an indicator here, we want it to be very responsive to the price movements.
There are two valid signals available when working with Stochastics.
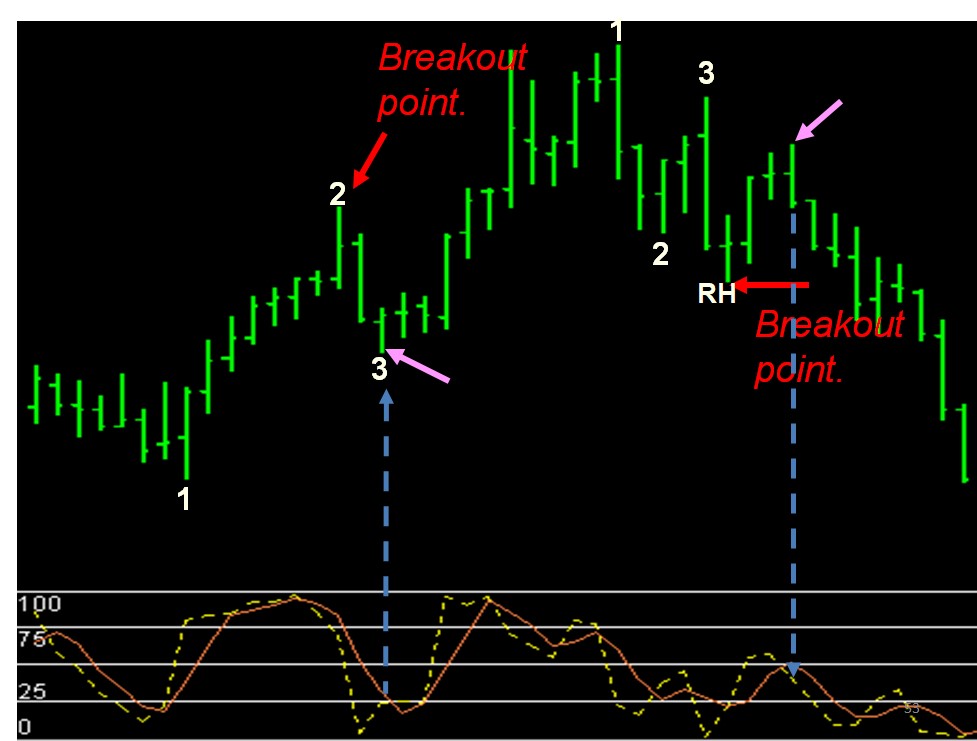
Buy and sell signals are based entirely on a crossing of the “D” plot by the “K” plot. If K is within one time interval of crossing “D,” we can make the trade.
What do I mean by “one time interval?” I am saying that if “K” will cross, is crossing, or has crossed “D” on the day, hour, or the minute, you can take the trade depending on the time frame you in which you are trading.
I also look at divergence at the time I want to enter a trade. Stochastic must be in coordination with prices. If prices are trending up, Stochastic must also be trending up. If prices are trending down, Stochastic must also be trending down.
Below, I’ve shown you two perfect trades using a Stochastic crossover. There were two other possible trades to enter long. The first was not entered because “K” had already crossed “D” by more than one time interval. Another possibility to go long had the same problem, but even worse, “K” had already crossed “D” the wrong way, so we also had divergence.
There was one other possibility to go short, but was not taken. That possibility had the problem that “K” had already crossed “D” by more than one time interval.
See if you can spot the possible trades that were not taken. One of them would have turned out to be a terrific trade. However, the other two, would have been terrible trades. In those cases, Stochastics kept me out of a couple of bad trades.
My use of Stochastics as a filter for trade entries is quite different from the way most people try to use this indicator. Most users of Stochastics try to find “overbought” and “oversold” situations by viewing Stochastics relative to a fixed scale that attempts to measure momentum. But as explained above, I don’t care where Stochastics are relative to a scale. I simply want to know where %D and %K are relative to each other.
It was a muggy day and I couldn’t seem to do anything right. I fumbled around all morning. He hadn’t slept the previous night. I was tired, and was tempted to just quit for the day, drink some ice-tea, and sit in a hammock by the pool. But I still had enough willpower to fight...read more.
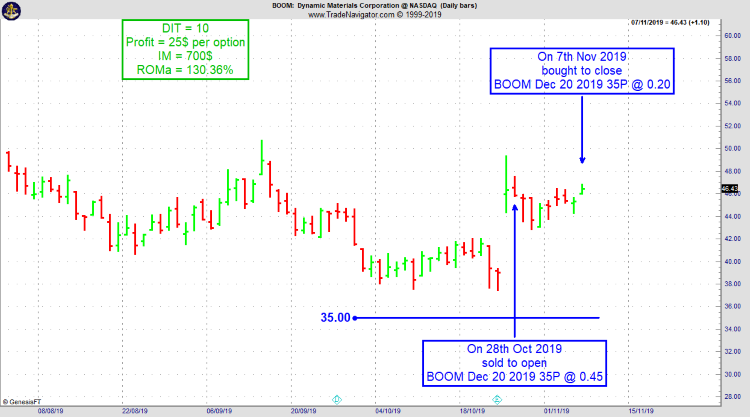
On 26th October 2019 we gave our Instant Income Guaranteed subscribers the following trade on Dynamic Materials Corporation (BOOM). Price insurance could be sold as follows:
On 28th October 2019, we sold to open BOOM Dec 20 2019 35P @ 0.45, with 52 days until expiration and our short strike about 24% below price action.
On 7th November 2019, we bought to close BOOM Dec 20 2019 35P @ 0.20, after 10 days in the trade
Need more information? We want to hear from you.
Email questions to This email address is being protected from spambots. You need JavaScript enabled to view it. 30% Savings using coupon code: iig30
Here is what I found on Wikipedia about Ed Seykota:
Edward Arthur Seykota (born August 7, 1946) is a commodities trader, who earned S.B. degrees in Electrical Engineering from MIT and Management from the MIT Sloan School of Management, both in 1969. In 1970, he pioneered Systems trading by using early...read more.
Andy Jordan is the editor for Traders Notebook which shows you Futures Trading Strategies in Spreads, Options, and Swing Trades. Learn step-by-step how to trade successfully.
If you don’t want to learn how to backtest automatically right now but still want to profit from backtesting, you got to do it manually. That’s how I started too many years ago. I still remember sitting there with printed charts and writing down trade results on a separate sheet of paper.
Now there are some pitfalls you better...read more.
Marco Mayer is an Educator for Forex, Futures and a Systematic Trader, so if you have questions, he wants to hear from you! This email address is being protected from spambots. You need JavaScript enabled to view it.
To view previous published Chart Scan newsletters, please log in or click on "Join Us,"
shown above, to subscribe to our free "Members Only" section.
A WEALTH OF INFORMATION & EDUCATION:
Joe Ross-Trading Educators' popular free Chart Scan Newsletter has been published since 2004.
Note: Unless otherwise noted, all charts used in Chart Scan commentary were created
by using Genesis Financial Technologies' Trade Navigator (with permission).
Legal Notice and Copyright 2019 Disclaimer - Published by Trading Educators, Inc.
Chart Scan is a complimentary educational newsletter.
Hey Joe! I’m submitting the following from an email I received.
“Traders and investors use the commodity channel index to help identify price reversals, extremes and trend strength.
“As with most indicators, the CCI should be used in conjunction with other aspects of technical analysis. CCI fits into the momentum category of oscillators. In addition to momentum, volume indicators and the chart patterns may also influence a technical assessment.
“CCI is often used for detecting divergences from price trends as an overbought/oversold indicator, and to draw patterns on it and trade according to those patterns.
In this respect, it is similar to Bollinger Bands, but is presented as an indicator rather than as overbought/oversold levels.”
I thought you said that CCI is a volatility indicator, so what do you say about the above quote?
LOL! Whoever wrote that quote doesn’t know his/her knee from his/her elbow. He/she admits that CCI is like Bollinger Bands (which should be capitalized), and Bollinger Bands are definitely based on volatility, not momentum.
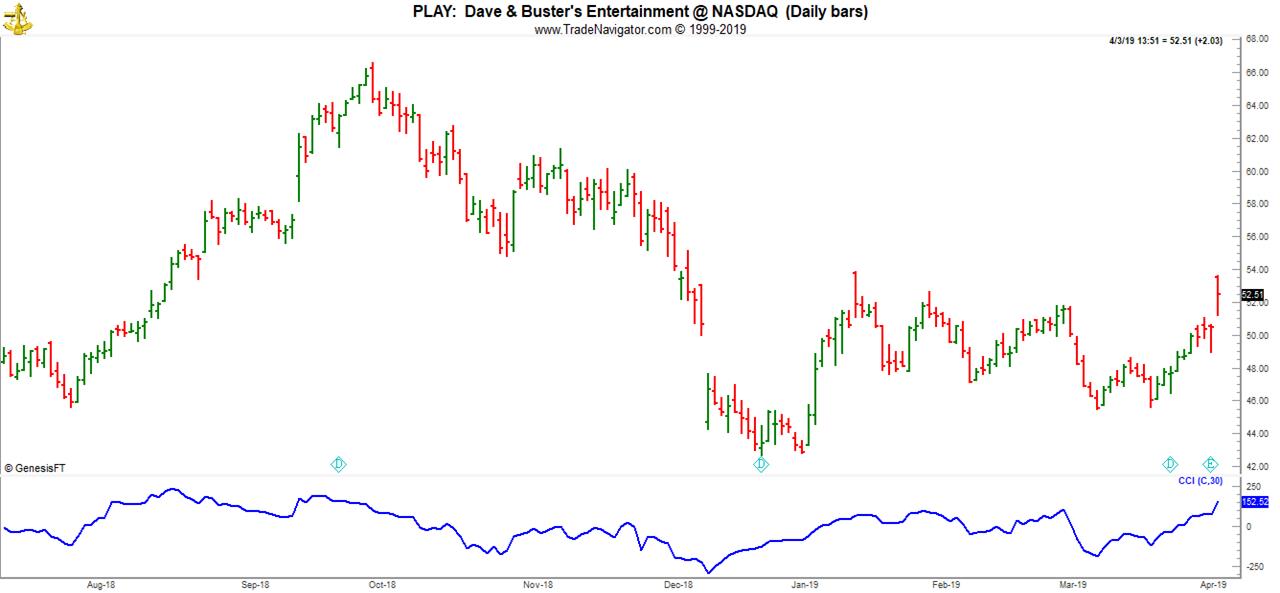
CCI (Commodity Channel Index) compares today’s typical price to the Mean Deviation of a moving average of typical prices. Typical price can be figured as high minus low (that’s volatility), or the average of high minus low plus close/3, or high minus low, plus close plus open/4. All of those computations reveal volatility, not momentum. In other words, how much did price move during the time interval being measured?
I believe the default setting for CCI is 21 bars. However, I have always used 30 bars as the best setting.
Momentum indicators have fixed upper and lower limits. Since there is no upper or lower limit to the reach of the bands, as there are with momentum indicators. How in the world can CCI be an overbought/oversold indicator? Which possible value would indicate overbought or oversold? CCI can move infinitely higher or infinitely lower.
When your money is on the line, you can't help but feel a little uneasy. What if you lose? It's hard not to put some of your ego on the line with your money, and when you lose, feel hurt. Winning traders, though, keep cool. They don't ride a roller coaster ride of emotions, feeling euphoric after a win and beaten after a...read more.
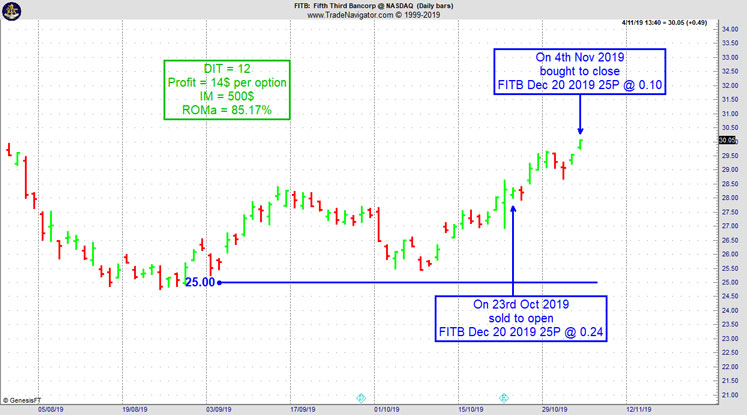
On 22nd October 2019 we gave our Instant Income Guaranteed subscribers the following trade on Fifth Third Bancorp (FITB). Price insurance could be sold as follows:
On 23rd October 2019, we sold to open FITB Dec 20 2019 25P @ 0.24, with 57 days until expiration and our short strike about 12% below price action.
On 4th November 2019, we bought to close FITB Dec 20 2019 25P @ 0.10, after 12 days in the trade.
Profit: 14$ per option
Margin: 500$
Return on Margin annualized: 85.17%
Philippe
Receive daily trade recommendations - we do the research for you.
♦ SIGN UP TODAY! WEALTH BUILDING FOR YOUR FUTURE ♦
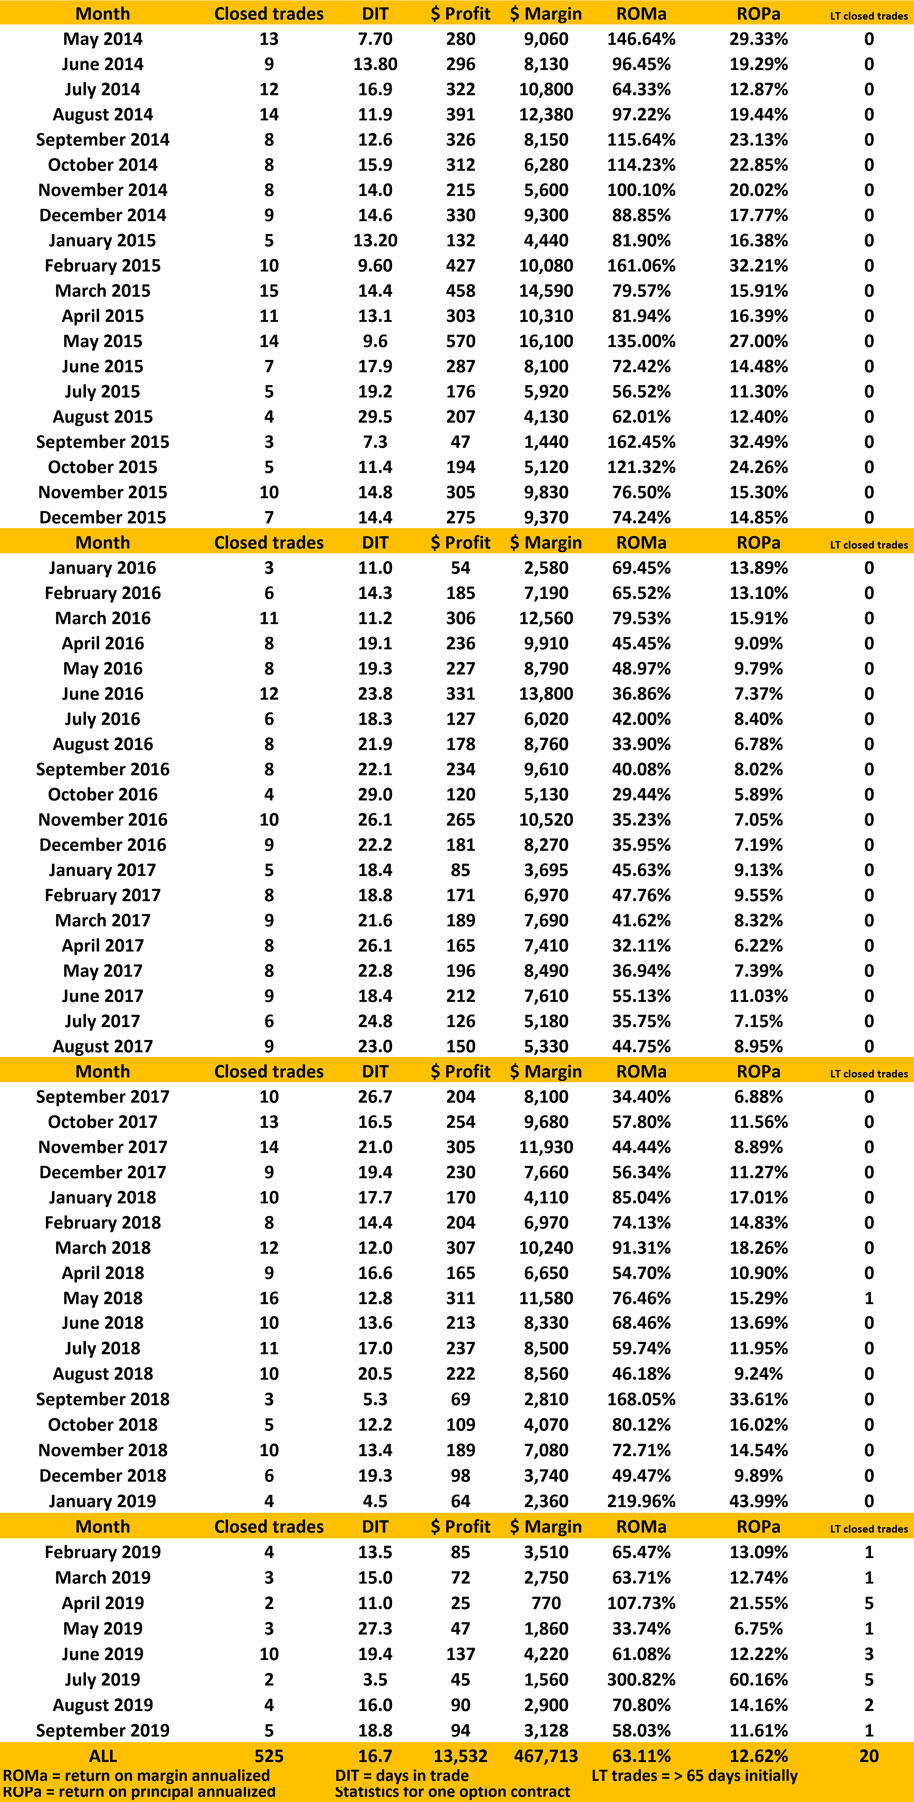
PERFORMANCE RECORD
SEPTEMBER 2019 TO MAY 2014
INSTANT INCOME GUARANTEED
Need more information? We want to hear from you.
Email questions to This email address is being protected from spambots. You need JavaScript enabled to view it. 30% Savings using coupon code: iig30
Trading Article: The Golden Rules of Martin S. Schwartz
I like Marty Schwartz and his trading book “Pit Bull” a lot. It is an honest book about a trader who had his ups and downs in the market as we all do. In his book he writes....read more.
Andy Jordan is the editor for Traders Notebook which shows you Futures Trading Strategies in Spreads, Options, and Swing Trades. Learn step-by-step how to trade successfully.
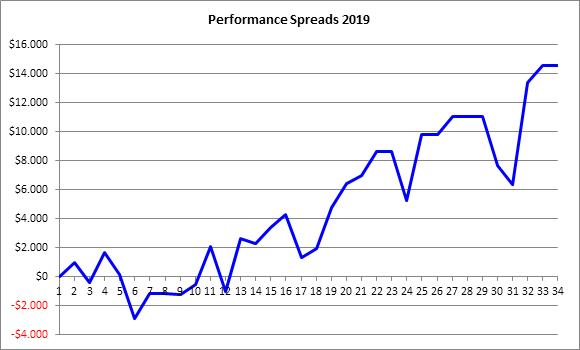
Let's look at the P&L chart of all spread trade recommendations in Traders Notebook since January 2019. I would like to discuss a few things a trader should always check to see if a trading method or a specific way of trading makes sense. As we can see on the (hypothetical) P&L chart from below, the profit reached almost $15k:
What does “$15k” mean?
What was the risk?
What about the draw-downs?
Were there enough trades to see the results are statistically significant?
Let’s go through it, step-by-step:
A result of about $15k is kind of meaningless, as long as we don’t know how much money we need so we can get to this result. This is usually the point, where a good marketing specialist will look up how much margin was used to cover the trades and then he will probably tell you the following: “You could have reached that result with an account size of about $15k, Andy. As you can see, this means a return of about 100%! Isn’t that awesome?” But wait a minute. After the trades are done, it is always easy to calculate the optimized values to present huge profits. But what would have happened if there were more losing trades in a row? Well, easy answer: You would have been out of business! So, let’s have a look at the chart by ourselves and forget about the marketing guy. As we can see, the largest draw-down happened around trade 31 of about $5k. Is there a way we can have a few of these draw-downs in a row? Yes, of course. To be on the save side, we better look at the largest draw-down and we multiply this value a couple of times so we can resist even larger draw-down periods. How often we multiply the draw-down is of course up to each trader, but I would use at least 3 to 4 times the largest draw-down ($15k - $20k). Therefore, an account size of about $30k to $40k or even better $50k make much more sense to reach these results. And if we use for example an account size of $50k for our calculation, our profit is down to about 30%, which is by the way still pretty good in the world of “real trading” and not “marketing trading”.
Of course, you can take the trades also with a smaller account, let’s say with only $25k, but then you should also reduce your profit expectation, just to be not too disappointed after one year of trading. Especially beginning traders get disappointed when they make “only” 20% or 30% a year because they have statements like “I made 1 million out of $10,000 in just one year” in mind. But I can tell you, using good risk and money management parameters, these statements are all bogus.
If you still think the results shown on the chart above are pretty good and you would like to join me with Traders Notebook, I want to make you a special offer today.
Pay for a 6-month subscription and get a 12-month subscription from us! That's right, 12-month subscription for only the 6-month subscription price!
Editor for Traders Notebook which shows you Futures Trading Strategies in Spreads, Options, and Swing Trades. Learn step-by-step how to trade successfully.
If you don’t want to learn how to backtest automatically right now but still want to profit from backtesting, you got to do it manually. That’s how I started too many years ago. I still remember sitting there with printed charts and writing down trade results on a separate sheet of paper.
Now there are some pitfalls you better...read more.
Marco Mayer is an Educator for Forex, Futures and a Systematic Trader, so if you have questions, he wants to hear from you! This email address is being protected from spambots. You need JavaScript enabled to view it.
To view previous published Chart Scan newsletters, please log in or click on "Join Us,"
shown above, to subscribe to our free "Members Only" section.
A WEALTH OF INFORMATION & EDUCATION:
Joe Ross-Trading Educators' popular free Chart Scan Newsletter has been published since 2004.
Note: Unless otherwise noted, all charts used in Chart Scan commentary were created
by using Genesis Financial Technologies' Trade Navigator (with permission).
Legal Notice and Copyright 2019 Disclaimer - Published by Trading Educators, Inc.
Chart Scan is a complimentary educational newsletter.
I would like to thank all the traders who found the value in our 800th Edition Newsletter special offers. Many new and returning traders reached out, sharing their trading stories which allowed me to keep encouraging each and every one of them. I want you to succeed as a trader and that is why I share my trading knowledge with you today. Now, let me share with you my next trading lesson, please read on. Happy trading, Master Trader - Joe Ross
In the past few years, I admit to liking to see my charts with colored bars: Red for a down bar and green for an up bar. However, when I really want to study a chart and do some chart reading, I switch to black bars on a white background. I want to avoid color bias.
I have many things against using candlestick charts, which I won’t go into here, but one of them is the fact that candles give color bias, even when they are black and white.
I want to make a fine point with regards to color. When you see a green bar or candle, your mind automatically thinks “up.” When you see a red bar or candle, your mind automatically thinks “down” (unless you happen to be in China, where red and green have the opposite meanings).
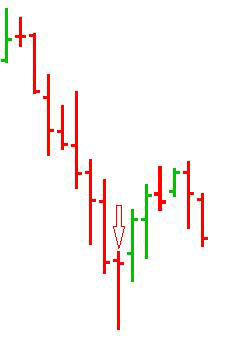
The graphic below will serve to show what I mean.
Prices had been coming down to the lowest low on the chart, which is correctly colored red…or is it? If you look closely at the bar you will see that momentum had actually changed. Prices opened near the close of the previous bar, and moved up the high. But at some time during the formation of that bar, momentum changed, and from the low of the bar up to the close, prices recovered, and actually closed close to where the bar opened.
This recovery by prices should have served as an alert that the next bar might very well be an up bar, which is actually what took place. In other words, the upward momentum from a supposedly down bar was continued on the very next bar. The color of the bar that made the low placed a mental bias in favor of further downward movement, whereas the relationship of the close to the low signaled a change to upward momentum.
Jim own a Hog farm. He produces 1,000 hogs per month to take to market, so he runs a fair-sized hog operation. Jim grows corn and soybeans for feed. He grinds his own beans into meal, and has silos for storage of both the corn and the beans.
In years where the crop of the best quality, Jim stores...read more.
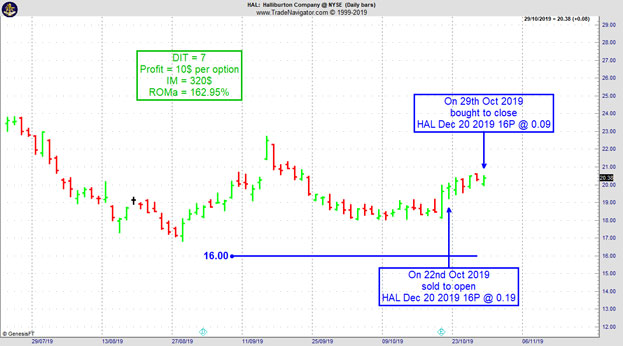
On 21st October 2019 we gave our Instant Income Guaranteed subscribers the following trade on Halliburton Company (HAL). Price insurance could be sold as follows:
On 22nd October 2019, we sold to open HAL Dec 20 2019 16P @ 0.19, with 58 days until expiration and our short strike about 18% below price action.
On 29th October 2019, we bought to close HAL Dec 20 2019 16P @ 0.09, after 7 days in the trade
Profit: 10$ per option
Margin: 320$
Return on Margin annualized: 162.95%
Philippe
Receive daily trade recommendations - we do the research for you.
♦ SIGN UP TODAY! WEALTH BUILDING FOR YOUR FUTURE ♦
PERFORMANCE RECORD
SEPTEMBER 2019 TO MAY 2014
INSTANT INCOME GUARANTEED
Need more information? We want to hear from you.
Email questions to This email address is being protected from spambots. You need JavaScript enabled to view it. 30% Savings using coupon code: iig30
During the next few weeks, I want to have a look into the “golden rules” of famous traders with the idea, to find something they all have in common.
I am starting with Paul Tudor Jones. Here, what I found in Wikipedia about him:
Paul Tudor Jones II (born September 28, 1954) is an American investor, hedge fund manager, and philanthropist. In 1980, he founded....read more.
Andy Jordan is the editor for Traders Notebook which shows you Futures Trading Strategies in Spreads, Options, and Swing Trades. Learn step-by-step how to trade successfully.
Traders Notebook Complete
Learn how to manage this trade by getting daily detailed trading instructions, click here!
6-Months FREE when you purchase a 6-Month Subscription!
Let's look at the P&L chart of all spread trade recommendations in Traders Notebook since January 2019. I would like to discuss a few things a trader should always check to see if a trading method or a specific way of trading makes sense. As we can see on the (hypothetical) P&L chart from below, the profit reached almost $15k:
What does “$15k” mean?
What was the risk?
What about the draw-downs?
Were there enough trades to see the results are statistically significant?
Let’s go through it, step-by-step:
A result of about $15k is kind of meaningless, as long as we don’t know how much money we need so we can get to this result. This is usually the point, where a good marketing specialist will look up how much margin was used to cover the trades and then he will probably tell you the following: “You could have reached that result with an account size of about $15k, Andy. As you can see, this means a return of about 100%! Isn’t that awesome?” But wait a minute. After the trades are done, it is always easy to calculate the optimized values to present huge profits. But what would have happened if there were more losing trades in a row? Well, easy answer: You would have been out of business! So, let’s have a look at the chart by ourselves and forget about the marketing guy. As we can see, the largest draw-down happened around trade 31 of about $5k. Is there a way we can have a few of these draw-downs in a row? Yes, of course. To be on the save side, we better look at the largest draw-down and we multiply this value a couple of times so we can resist even larger draw-down periods. How often we multiply the draw-down is of course up to each trader, but I would use at least 3 to 4 times the largest draw-down ($15k - $20k). Therefore, an account size of about $30k to $40k or even better $50k make much more sense to reach these results. And if we use for example an account size of $50k for our calculation, our profit is down to about 30%, which is by the way still pretty good in the world of “real trading” and not “marketing trading”.
Of course, you can take the trades also with a smaller account, let’s say with only $25k, but then you should also reduce your profit expectation, just to be not too disappointed after one year of trading. Especially beginning traders get disappointed when they make “only” 20% or 30% a year because they have statements like “I made 1 million out of $10,000 in just one year” in mind. But I can tell you, using good risk and money management parameters, these statements are all bogus.
If you still think the results shown on the chart above are pretty good and you would like to join me with Traders Notebook, I want to make you a special offer today.
Pay for a 6-month subscription and get a 12-month subscription from us! That's right, 12-month subscription for only the 6-month subscription price!
Editor for Traders Notebook which shows you Futures Trading Strategies in Spreads, Options, and Swing Trades. Learn step-by-step how to trade successfully.
If you don’t want to learn how to backtest automatically right now but still want to profit from backtesting, you got to do it manually. That’s how I started too many years ago. I still remember sitting there with printed charts and writing down trade results on a separate sheet of paper.
Now there are some pitfalls you better...read more.
Marco Mayer is an Educator for Forex, Futures and a Systematic Trader, so if you have questions, he wants to hear from you! This email address is being protected from spambots. You need JavaScript enabled to view it.
To view previous published Chart Scan newsletters, please log in or click on "Join Us,"
shown above, to subscribe to our free "Members Only" section.
A WEALTH OF INFORMATION & EDUCATION:
Joe Ross-Trading Educators' popular free Chart Scan Newsletter has been published since 2004.
Note: Unless otherwise noted, all charts used in Chart Scan commentary were created
by using Genesis Financial Technologies' Trade Navigator (with permission).
Legal Notice and Copyright 2019 Disclaimer - Published by Trading Educators, Inc.
Chart Scan is a complimentary educational newsletter.
"Teach our students the truth in trading - teach them how to trade,"
and
"Give them a way to earn while they learn - realizing that it takes time to develop a successful trader."
Derivative transactions, including futures, are complex and carry a high degree of risk. They are intended for sophisticated investors and are not suitable for everyone.
There are numerous other factors related to the markets in general or to the implementation of any specific trading program which cannot be
fully accounted for in the preparation of hypothetical performance results, and all of which can adversely affect actual trading results.
For more information, see the Risk Disclosure Statement for Futures and Options.