Trades in Stock Options. Receive daily trade recommendations. Can you imagine discovering a way to trade that promises instant income? If you think such a method is impossible, think again. It is definitely achievable, and everything you need to know is available online for one low price that includes special three-part online webinars.
Ambush is a time-proven mean-reversion day trading System focused on a variety of Futures markets around the globe. With Ambush Signals you can now easily follow the Ambush System on a subscription basis for educational purposes.
If you didn't fail early in your trading business, then you have probably been around long enough to realize that many of the problems you encounter as a trader are those that derive from your own individuality. Such problems are common among traders and, in fact, common among all human beings. Seeking spiritual help from a power much greater than your own is the area I address in the "Spiritual Side of Trading".
Hey Joe! Implied Volatility(IV) still makes me confused.
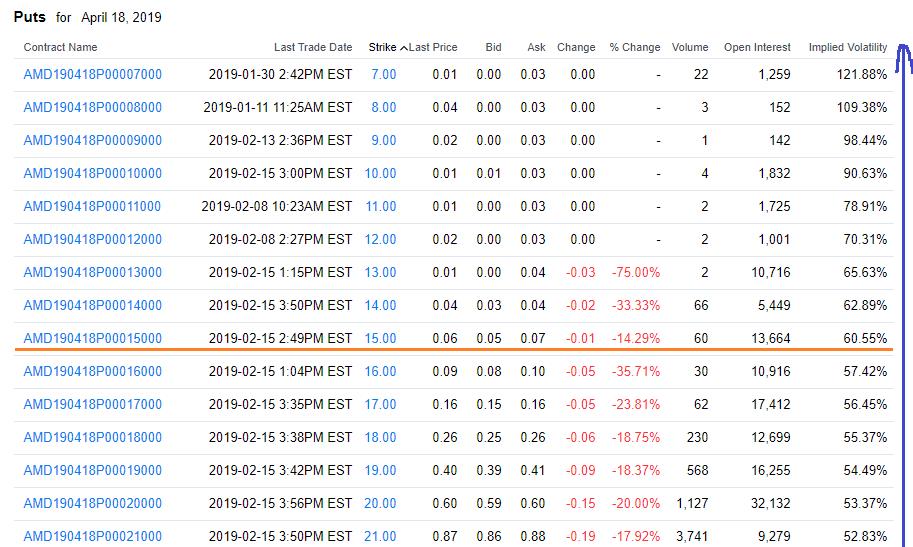
There is an example, AMD April 18 contract, 15 put option. The value of Implied Volatility(IV) is 60.55%.
I would like to know what 60.55% really is, whose 60.55%, how to compute IV?
Implied Volatility is what you get when you run historical volatility through an option model, applying the parameters of time to expiration; interest rates; dividends; and distance from actual price to the strike price.
If you learn how to make an option model, or study one of the existing models, you will understand what IV is.
Historical volatility is also a bit complicated. Normally, it is the distance between the high and the low of the time period being used. But then, how do you account for gaps? Is volatility the distance from yesterday’s low to today’s high? Is it from yesterday’s close to today’s open? Is it some other combination of high, low, open, close?
There is no agreement on this, but an average of historical volatility is what is input to an option model, spun around with the other factors I named above, in order to come up with Implied Volatility.
Please realize that HV and IV are not rocket science. Your guess is as good as anyone’s.
Marvin has been following a company stock for the past year. It's a great company with solid management, high sales growth, and consistently high earnings. It is in a booming industry sector and a favorite of the media. After a year's...read more.
On 6th June 2019 we gave our Instant Income Guaranteed subscribers the following trade on Stitch Fix Inc. (SFIX). Price insurance could be sold as follows:
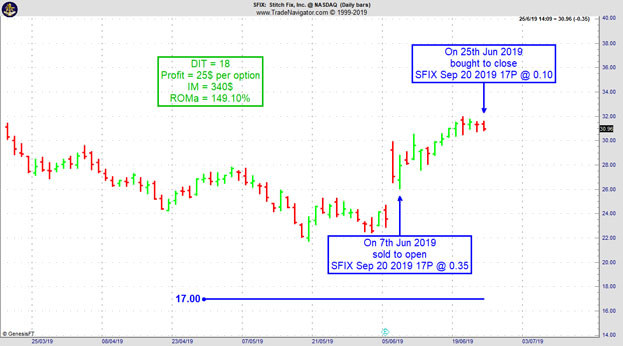
On 7th June 2019, we sold to open SFIX Sep 20 2019 17P @ 0.35, with 42 days until expiration and our short strike about 37% below price action, making the trade very safe.
On 25th June 2019, we bought to close SFIX Sep 20 2019 17P @ 0.10, after 18 days in the trade.
Profit: 25$ per option
Margin: 340$
Return on Margin annualized: 149.10%
Philippe
Receive daily trade recommendations - we do the research for you.
♦ SIGN UP TODAY! WEALTH BUILDING FOR YOUR FUTURE ♦
Recently I heard another tale of woe involving the failure to admit being wrong. This man followed a familiar path.
As a day trader in the E-mini S&P 500, he first contacted me…read more.
Andy Jordan is the editor for Traders Notebook which shows you Futures Trading Strategies in Spreads, Options, and Swing Trades. Learn step-by-step how to trade successfully.
Traders Notebook Complete
Learn how to manage this trade by getting daily detailed trading instructions, click here!
The Russell 2000 is simply too easy to trade right now!
The Ambush trading method is specialised in catching intraday market tops and bottoms in a variety of Futures markets. Including the Russell 2000 Mini Future (RTY/M2K) traded at the CME, where Ambush Traders keep on cashing in big time again over the last couple of months!
Ambush day trades on an end-of-day basis so there’s no need to even check the markets during the day.
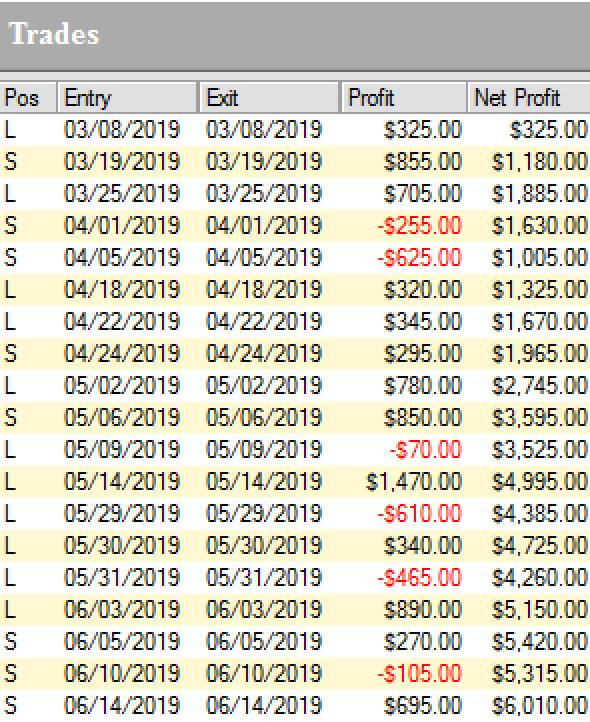
The Russell 2000 a very popular market out there among traders. It has two of the most important things private traders are looking for liquidity and volatility. I won’t even include a daily chart here as it does look quite boring. To keep it brief, the Russell is trading in a wide range for a long time now. Perfect conditions for Ambush and so this has paid out big time, here are all the recent trades:
Yes, that’s over $6000 within just three month and not even 20 trades! Which means Ambush traders made over $300 on average per trade doing nothing more than placing one entry order per day. I guess most active day traders made a lot less…but their brokers rich!
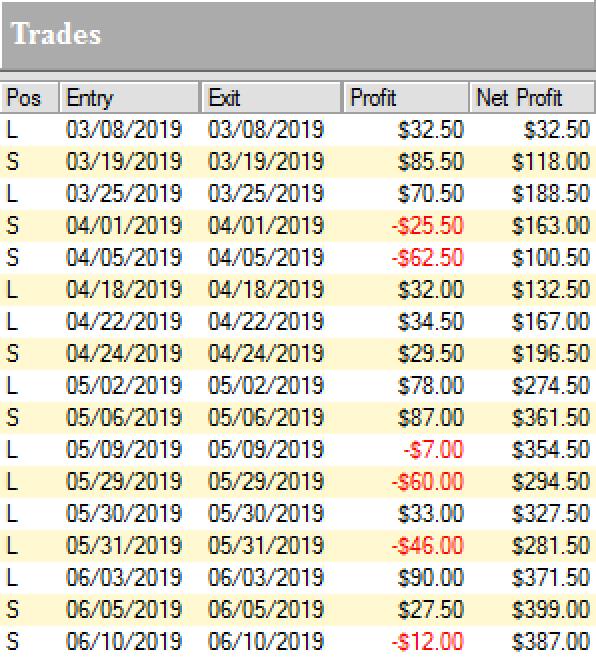
Now those are huge amounts if you have a small account and you might not want to make or lose hundreds or dollars per trade. Thanks to the new Micro Russell 2000 Mini Contracts (M2K) this is not an issue anymore. You can trade these with a small account now. Here are the results trading one M2K contract:
If that is not enough bang for the buck simply size it up and trade two contracts or three. It’s so great now you can position size as you like exactly matching your risk preferences!
In either case you have to ask yourself if you really can afford to miss out on these trades!
So whether you’re trading a $10k account or a $100k account, Ambush has the right markets for you to start following the signals.
Again, ask yourself if you really can afford to miss out on these trades or at least be aware of the signals? Now if you’ve been on the other sides of these trades trying to buy the breakouts you maybe should think about switching sides?
With Ambush Signals you can easily follow Ambush, a system specialized in catching intraday market tops and bottoms in the Futures markets!
The most popular and easiest way to follow Ambush is Ambush Signals. It does all the work for you, allows you to customise what markets you want to see and has a position sizing tool implemented to automatically adjust the positions to your risk preferences.
Each day around 6:30 pm NY Time the Signals are available for you on the Dashboard. You can then place your orders and literally walk away until the next market close! To find out more about the details of Ambush and how Ambush Signals works, have a look at the Ambush Signals Website.
Let’s be realistic. Following any System can be tough, especially in the beginning. It simply needs time to build the confidence needed to make it through inevitable drawdowns. So what if you are unlucky and don’t catch a good start right away?
I want you to succeed trading Ambush Signals, so here’s something for you that will strongly increase your odds of success and allow you to easily gain the confidence you’ll need to become a long-term profitable Ambush trader.
Did you come up with questions? Don't be shy, email Marco Mayer, he wants to hear from you! This email address is being protected from spambots. You need JavaScript enabled to view it.
To view previous published Chart Scan newsletters, please log in or click on "Join Us,"
shown above, to subscribe to our free "Members Only" section.
A WEALTH OF INFORMATION & EDUCATION:
Joe Ross-Trading Educators' popular free Chart Scan Newsletter has been published since 2004.
Note: Unless otherwise noted, all charts used in Chart Scan commentary were created
by using Genesis Financial Technologies' Trade Navigator (with permission).
Legal Notice and Copyright 2019 Disclaimer - Published by Trading Educators, Inc.
Chart Scan is a complimentary educational newsletter.
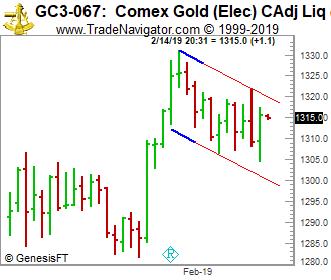
People keep asking me about gold and where I think it is headed. Some good old-fashioned chart analysis might be appropriate at this time.
The descending flag shows as a continuation pattern. The flag is built by two straight downward parallel lines which is shaped like a rectangle. It is oriented in the direction of that trend which it consolidates. Contrary to a bearish channel, this pattern is quite short term and shows the fact that buyers will need a break.
The creation of this pattern will occur in an upward trend. Often, this break will occur halfway through the movement.
The object calculation will be compared to the previous trend. A calculation of the height of the overall upward trend before the formation of the descending flag and then extends the low on the last lowest point of the pattern.
A graphical representation of the pattern follows:
Look at some statistics about the descending flag:
Descending Flag statistics
In 87% of cases, there is an upward exit.
In 90% of cases, it shows a continuation pattern.
In 62% of cases, the target of the pattern will be reached .
76% of cases, it occurs when the price is at the highest third of its annual range.
In 10% of cases, a pullback occurs on the support.
The more the previous movement precedes the formation of the descending flag it is powerful, the more the bullish breakout will be strong.
The flags performance is not as important when it is oriented in the direction of the trend.
A descending flag with narrowed lines performs more than a flag with outspread lines and is more powerful if there is no false breakout. Based on statistics, I would have to say the bias should be to the upside for gold.
Don't follow the crowd! You've been warned over and over, but few are that independent minded. Breaking away is harder than it looks. We are all familiar with the rebel, the person who...read more.
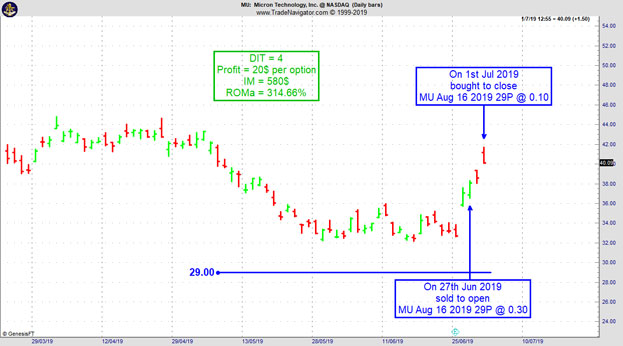
On 26th June 2019 we gave our Instant Income Guaranteed subscribers the following trade on Micron Technology Inc. (MU). Price insurance could be sold as follows:
On 27th June 2019, we sold to open MU Aug 16 2019 29P @ 0.30, with 49 days until expiration and our short strike about 22% below price action, making the trade very safe
On 1st July 2019, we bought to close MU Aug 16 2019 29P @ 0.10, after 4 days in the trade, for quick premium compounding
Profit: 20$ per option
Margin: 580$
Return on Margin annualized: 314.66%
Philippe
Receive daily trade recommendations - we do the research for you.
♦ SIGN UP TODAY! WEALTH BUILDING FOR YOUR FUTURE ♦
Winning traders cannot afford to be influenced by their emotions. The nature of trading demands an objective, logical approach. If you experience…read more.
Andy Jordan is the editor for Traders Notebook which shows you Futures Trading Strategies in Spreads, Options, and Swing Trades. Learn step-by-step how to trade successfully.
Traders Notebook Complete
Learn how to manage this trade by getting daily detailed trading instructions, click here!
The Russell 2000 is simply too easy to trade right now!
The Ambush trading method is specialised in catching intraday market tops and bottoms in a variety of Futures markets. Including the Russell 2000 Mini Future (RTY/M2K) traded at the CME, where Ambush Traders keep on cashing in big time again over the last couple of months!
Ambush day trades on an end-of-day basis so there’s no need to even check the markets during the day.
The Russell 2000 a very popular market out there among traders. It has two of the most important things private traders are looking for liquidity and volatility. I won’t even include a daily chart here as it does look quite boring. To keep it brief, the Russell is trading in a wide range for a long time now. Perfect conditions for Ambush and so this has paid out big time, here are all the recent trades:
Yes, that’s over $6000 within just three month and not even 20 trades! Which means Ambush traders made over $300 on average per trade doing nothing more than placing one entry order per day. I guess most active day traders made a lot less…but their brokers rich!
Now those are huge amounts if you have a small account and you might not want to make or lose hundreds or dollars per trade. Thanks to the new Micro Russell 2000 Mini Contracts (M2K) this is not an issue anymore. You can trade these with a small account now. Here are the results trading one M2K contract:
If that is not enough bang for the buck simply size it up and trade two contracts or three. It’s so great now you can position size as you like exactly matching your risk preferences!
In either case you have to ask yourself if you really can afford to miss out on these trades!
So whether you’re trading a $10k account or a $100k account, Ambush has the right markets for you to start following the signals.
Again, ask yourself if you really can afford to miss out on these trades or at least be aware of the signals? Now if you’ve been on the other sides of these trades trying to buy the breakouts you maybe should think about switching sides?
With Ambush Signals you can easily follow Ambush, a system specialized in catching intraday market tops and bottoms in the Futures markets!
The most popular and easiest way to follow Ambush is Ambush Signals. It does all the work for you, allows you to customise what markets you want to see and has a position sizing tool implemented to automatically adjust the positions to your risk preferences.
Each day around 6:30 pm NY Time the Signals are available for you on the Dashboard. You can then place your orders and literally walk away until the next market close! To find out more about the details of Ambush and how Ambush Signals works, have a look at the Ambush Signals Website.
Let’s be realistic. Following any System can be tough, especially in the beginning. It simply needs time to build the confidence needed to make it through inevitable drawdowns. So what if you are unlucky and don’t catch a good start right away?
I want you to succeed trading Ambush Signals, so here’s something for you that will strongly increase your odds of success and allow you to easily gain the confidence you’ll need to become a long-term profitable Ambush trader.
Did you come up with questions? Don't be shy, email Marco Mayer, he wants to hear from you! This email address is being protected from spambots. You need JavaScript enabled to view it.
To view previous published Chart Scan newsletters, please log in or click on "Join Us,"
shown above, to subscribe to our free "Members Only" section.
A WEALTH OF INFORMATION & EDUCATION:
Joe Ross-Trading Educators' popular free Chart Scan Newsletter has been published since 2004.
Note: Unless otherwise noted, all charts used in Chart Scan commentary were created
by using Genesis Financial Technologies' Trade Navigator (with permission).
Legal Notice and Copyright 2019 Disclaimer - Published by Trading Educators, Inc.
Chart Scan is a complimentary educational newsletter.
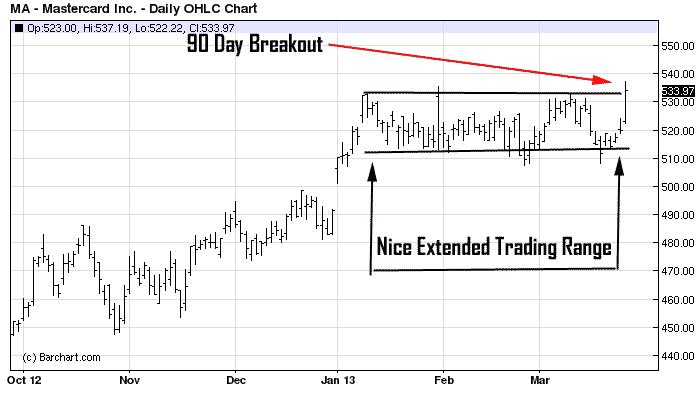
Hey Joe! What do you do if there has been no breakout of a trading range after 29 bars?
The most likely time by bar-count for a breakout from a trading range occurs on bars 21-29, but a breakout hasn’t taken place, the next thing I look for is a breakout by time. I look for the trading range to last 45-90 bars.
Once bar 29 is past, I also look for clues, like 1-2-3 formations followed by Ross Hooks, all within the confines of the trading range—but beginning with bar 30.
This will work on bars of any time frame.
Take a look at this daily chart of Master Card. We see a 90-bar breakout of the daily chart. In this case there was no clear-cut clue as to which way prices would break out.
Jake has just made three losing trades in a row? He decides he is in a slump and is now worried that he can't get out of it. But is he really in a slump? Perhaps he's just panicking for no good reason. He may just have a pessimistic attitude, but...read more.
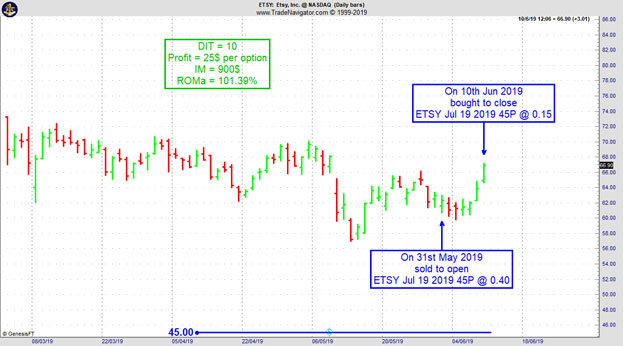
On 27th May 2019 we gave our Instant Income Guaranteed subscribers the following trade on Etsy Inc. (ETSY). Price insurance could be sold as follows:
On 31st May 2019, we sold to open ETSY Jul 19 2019 45P @ 0.40, with 48 days until expiration and our short strike about 30% below price action, making the trade very safe.
On 10th June 2019, we bought to close ETSY Jul 19 2019 45P @ 0.15, after 10 days in the trade, for quick premium compounding.
Profit: 25$ per option
Margin: 900$
Return on Margin annualized: 101.39%
Philippe
Receive daily trade recommendations - we do the research for you.
♦ SIGN UP TODAY! WEALTH BUILDING FOR YOUR FUTURE ♦
Taking an honest evaluation of your own strengths and weaknesses is crucial to becoming a consistently profitable trader. If you can't identify those habits…read more.
Andy Jordan is the editor for Traders Notebook which shows you Futures Trading Strategies in Spreads, Options, and Swing Trades. Learn step-by-step how to trade successfully.
Traders Notebook Complete
Learn how to manage this trade by getting daily detailed trading instructions, click here!
The Russell 2000 is simply too easy to trade right now!
The Ambush trading method is specialised in catching intraday market tops and bottoms in a variety of Futures markets. Including the Russell 2000 Mini Future (RTY/M2K) traded at the CME, where Ambush Traders keep on cashing in big time again over the last couple of months!
Ambush day trades on an end-of-day basis so there’s no need to even check the markets during the day.
The Russell 2000 a very popular market out there among traders. It has two of the most important things private traders are looking for liquidity and volatility. I won’t even include a daily chart here as it does look quite boring. To keep it brief, the Russell is trading in a wide range for a long time now. Perfect conditions for Ambush and so this has paid out big time, here are all the recent trades:
Yes, that’s over $6000 within just three month and not even 20 trades! Which means Ambush traders made over $300 on average per trade doing nothing more than placing one entry order per day. I guess most active day traders made a lot less…but their brokers rich!
Now those are huge amounts if you have a small account and you might not want to make or lose hundreds or dollars per trade. Thanks to the new Micro Russell 2000 Mini Contracts (M2K) this is not an issue anymore. You can trade these with a small account now. Here are the results trading one M2K contract:
If that is not enough bang for the buck simply size it up and trade two contracts or three. It’s so great now you can position size as you like exactly matching your risk preferences!
In either case you have to ask yourself if you really can afford to miss out on these trades!
So whether you’re trading a $10k account or a $100k account, Ambush has the right markets for you to start following the signals.
Again, ask yourself if you really can afford to miss out on these trades or at least be aware of the signals? Now if you’ve been on the other sides of these trades trying to buy the breakouts you maybe should think about switching sides?
With Ambush Signals you can easily follow Ambush, a system specialized in catching intraday market tops and bottoms in the Futures markets!
The most popular and easiest way to follow Ambush is Ambush Signals. It does all the work for you, allows you to customise what markets you want to see and has a position sizing tool implemented to automatically adjust the positions to your risk preferences.
Each day around 6:30 pm NY Time the Signals are available for you on the Dashboard. You can then place your orders and literally walk away until the next market close! To find out more about the details of Ambush and how Ambush Signals works, have a look at the Ambush Signals Website.
Let’s be realistic. Following any System can be tough, especially in the beginning. It simply needs time to build the confidence needed to make it through inevitable drawdowns. So what if you are unlucky and don’t catch a good start right away?
I want you to succeed trading Ambush Signals, so here’s something for you that will strongly increase your odds of success and allow you to easily gain the confidence you’ll need to become a long-term profitable Ambush trader.
Did you come up with questions? Don't be shy, email Marco Mayer, he wants to hear from you! This email address is being protected from spambots. You need JavaScript enabled to view it.
To view previous published Chart Scan newsletters, please log in or click on "Join Us,"
shown above, to subscribe to our free "Members Only" section.
A WEALTH OF INFORMATION & EDUCATION:
Joe Ross-Trading Educators' popular free Chart Scan Newsletter has been published since 2004.
Note: Unless otherwise noted, all charts used in Chart Scan commentary were created
by using Genesis Financial Technologies' Trade Navigator (with permission).
Legal Notice and Copyright 2019 Disclaimer - Published by Trading Educators, Inc.
Chart Scan is a complimentary educational newsletter.
Chart Scan with Commentary: Weak Hands-Strong Hands
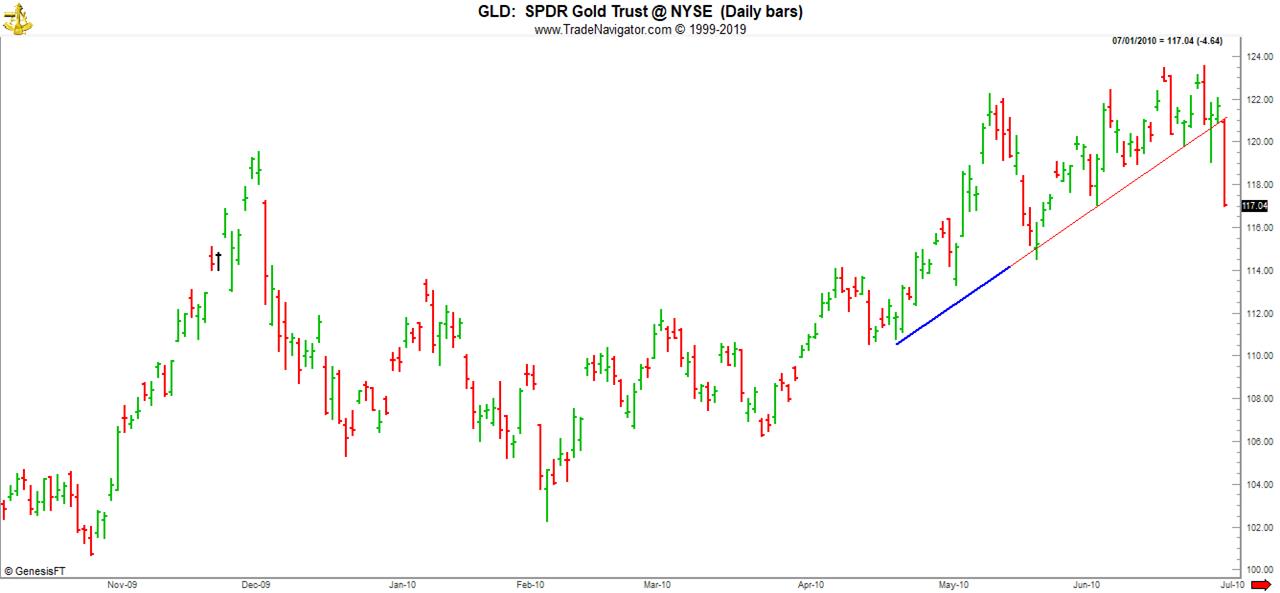
Below is a chart I put in this issue of Chart Scan to answer a question that often comes up in our forum. How do I know when prices are making a top?
I’m going to use a chart from the time that I answered the question.
As we view the chart of the GLD exchange traded fund, we see nothing that resembles a Head and Shoulders top, which often is formed as part of market top.
So, what are some of the ways we could have suspected a market top in the making?
The breaking of the upward trendline is one way.
Another way is that we see what is basically a double high, and each time the high was made, prices reversed direction the following day. Personally, I think the combination of the two is extremely strong. The broken trendline itself is sufficient warning for anyone to have tightened up their stops if they were long, and to refrain from entering if they were not already in the gold market.
There is also another way, and that way is to understand something about the way the bullion banks operate. For many years, the bullion banks have been able to run the gold and silver markets up and down, literally at will. There are 4 giant bullion banks and 4 other fairly large-sized bullion banks. Together they are 8 banks who often act in collusion with one another. It is the action of the bullion banks that make precious metals trading so volatile. Precious metals rarely move up without major corrections.
In essence, these banks have a license to steal. Despite pressure from traders and precious metals interests, the CFTC does nothing to stop these thieves from robbing everyone else. Their actions are well-known. Dozens, if not hundreds, of complaints have been filed with the CFTC, but the CFTC chooses to look the other way.
If you are going to trade in precious metals, you need to be a day trader, where the actions of the bullion banks won't bother you all that much, or you need to understand the way the bullion banks operate.
By selling or buying “paper gold,” they are able to move the price of real gold up and down. If they want prices to drop, they sell short more paper gold than there is actual gold available to deliver. The day is coming when traders/investors are going to want delivery of the gold represented by the paper contracts. Sadly, the gold will not be there. At that time the price of real gold will go through the roof, but not until the market manipulators have taken delivery of whatever gold there is backing the shares in the GLD Exchange Traded Fund. Everyone one else will be left holding a lot of worthless paper.
Making profits as a trader is often a matter of trading in the proper state of mind. Trading expert Dr. Van K. Tharp, author of several best-selling books on trading psychology and head of the Van Tharp Institute, describes three states of mind...read more.
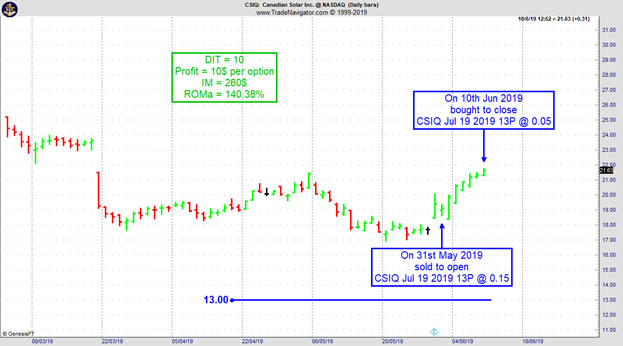
On 30th May 2019 we gave our Instant Income Guaranteed subscribers the following trade on Canadian Solar Inc. (CSIQ). Price insurance could be sold as follows:
On 31st May 2019, we sold to open CSIQ Jul 19 2019 13P @ 0.15, with 49 days until expiration and our short strike about 33% below price action, making the trade very safe.
On 10th June 2019, we bought to close CSIQ Jul 19 2019 13P @ 0.05, after 10 days in the trade, for quick premium compounding.
Profit: 10$ per option
Margin: 260$
Return on Margin annualized: 140.38%
Philippe
Receive daily trade recommendations - we do the research for you.
♦ SIGN UP TODAY! WEALTH BUILDING FOR YOUR FUTURE ♦
Winners take credit for their successes and full responsibility for their losses. Losers blame others for their losses and take full credit for their successes. A "shoulda-coulda-woulda" mentality does more than characterize the losing trader, it…read more.
Andy Jordan is the editor for Traders Notebook which shows you Futures Trading Strategies in Spreads, Options, and Swing Trades. Learn step-by-step how to trade successfully.
Traders Notebook Complete
Learn how to manage this trade by getting daily detailed trading instructions, click here!
The Russell 2000 is simply too easy to trade right now!
The Ambush trading method is specialised in catching intraday market tops and bottoms in a variety of Futures markets. Including the Russell 2000 Mini Future (RTY/M2K) traded at the CME, where Ambush Traders keep on cashing in big time again over the last couple of months!
Ambush day trades on an end-of-day basis so there’s no need to even check the markets during the day.
The Russell 2000 a very popular market out there among traders. It has two of the most important things private traders are looking for liquidity and volatility. I won’t even include a daily chart here as it does look quite boring. To keep it brief, the Russell is trading in a wide range for a long time now. Perfect conditions for Ambush and so this has paid out big time, here are all the recent trades:
Yes, that’s over $6000 within just three month and not even 20 trades! Which means Ambush traders made over $300 on average per trade doing nothing more than placing one entry order per day. I guess most active day traders made a lot less…but their brokers rich!
Now those are huge amounts if you have a small account and you might not want to make or lose hundreds or dollars per trade. Thanks to the new Micro Russell 2000 Mini Contracts (M2K) this is not an issue anymore. You can trade these with a small account now. Here are the results trading one M2K contract:
If that is not enough bang for the buck simply size it up and trade two contracts or three. It’s so great now you can position size as you like exactly matching your risk preferences!
In either case you have to ask yourself if you really can afford to miss out on these trades!
So whether you’re trading a $10k account or a $100k account, Ambush has the right markets for you to start following the signals.
Again, ask yourself if you really can afford to miss out on these trades or at least be aware of the signals? Now if you’ve been on the other sides of these trades trying to buy the breakouts you maybe should think about switching sides?
With Ambush Signals you can easily follow Ambush, a system specialized in catching intraday market tops and bottoms in the Futures markets!
The most popular and easiest way to follow Ambush is Ambush Signals. It does all the work for you, allows you to customise what markets you want to see and has a position sizing tool implemented to automatically adjust the positions to your risk preferences.
Each day around 6:30 pm NY Time the Signals are available for you on the Dashboard. You can then place your orders and literally walk away until the next market close! To find out more about the details of Ambush and how Ambush Signals works, have a look at the Ambush Signals Website.
Let’s be realistic. Following any System can be tough, especially in the beginning. It simply needs time to build the confidence needed to make it through inevitable drawdowns. So what if you are unlucky and don’t catch a good start right away?
I want you to succeed trading Ambush Signals, so here’s something for you that will strongly increase your odds of success and allow you to easily gain the confidence you’ll need to become a long-term profitable Ambush trader.
Did you come up with questions? Don't be shy, email Marco Mayer, he wants to hear from you! This email address is being protected from spambots. You need JavaScript enabled to view it.
To view previous published Chart Scan newsletters, please log in or click on "Join Us,"
shown above, to subscribe to our free "Members Only" section.
A WEALTH OF INFORMATION & EDUCATION:
Joe Ross-Trading Educators' popular free Chart Scan Newsletter has been published since 2004.
Note: Unless otherwise noted, all charts used in Chart Scan commentary were created
by using Genesis Financial Technologies' Trade Navigator (with permission).
Legal Notice and Copyright 2019 Disclaimer - Published by Trading Educators, Inc.
Chart Scan is a complimentary educational newsletter.
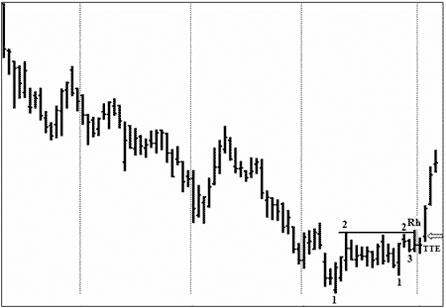
The chart below presents a couple of interesting concepts. Prices have obviously been in consolidation. Prices formed an initial 1-2 low, but never completed the #3 point.
When prices are in consolidation, there are often full or partial 1-2-3 formations in both directions — 1-2-3 highs and 1-2-3 lows. These formations are part of the Law of Charts.
At one point, prices dipped down and violated the low of a very tight cluster of prices forming a second #1 point, which can be justified as a #1 point only by the fact that it was followed by a #2 and a #3 point.
Why do I use the term "cluster?" It's because either the Open or Close, or both, of every bar following the first #2 point fell within the price range of that #2 point. That long bar labeled "2" is called a Measuring Bar.
Ultimately, the second #2 point was violated, thus forming a Ross Hook.
At our seminars, in private tutoring, and in our online courses, we teach that when prices are in consolidation, it usually requires both a 1-2-3 formation, followed by a Ross Hook (tie breaker) to convince us that at last prices are ready to break out of consolidation.
Since trend takes precedence over consolidation, and because a 1-2-3 formation followed by a Ross Hook confirms a trend, we are then correct in attempting a Traders Trick Entry (TTE).
That Ross Hook was the not only the first time through the original #2 point, it was also the tie breaker that indicated prices may very well break out.
There were then two possible entries: enter early, using the TTE, or wait for the second time through the original #2 point. Either way resulted in a very nice trade.
It would be wonderful if there were a foolproof and valid instruction manual for how to trade the markets profitably, a cookbook of sorts where you merely follow the steps and you are successful. For decades, traders have ...read more.
Experience and trading from a plan can help you to make trades in a carefree, relaxed, and…read more.
Andy Jordan is the editor for Traders Notebook which shows you Futures Trading Strategies in Spreads, Options, and Swing Trades. Learn step-by-step how to trade successfully.
Traders Notebook Complete
Learn how to manage this trade by getting daily detailed trading instructions, click here!
The Russell 2000 is simply too easy to trade right now!
The Ambush trading method is specialised in catching intraday market tops and bottoms in a variety of Futures markets. Including the Russell 2000 Mini Future (RTY/M2K) traded at the CME, where Ambush Traders keep on cashing in big time again over the last couple of months!
Ambush day trades on an end-of-day basis so there’s no need to even check the markets during the day.
The Russell 2000 a very popular market out there among traders. It has two of the most important things private traders are looking for liquidity and volatility. I won’t even include a daily chart here as it does look quite boring. To keep it brief, the Russell is trading in a wide range for a long time now. Perfect conditions for Ambush and so this has paid out big time, here are all the recent trades:
Yes, that’s over $6000 within just three month and not even 20 trades! Which means Ambush traders made over $300 on average per trade doing nothing more than placing one entry order per day. I guess most active day traders made a lot less…but their brokers rich!
Now those are huge amounts if you have a small account and you might not want to make or lose hundreds or dollars per trade. Thanks to the new Micro Russell 2000 Mini Contracts (M2K) this is not an issue anymore. You can trade these with a small account now. Here are the results trading one M2K contract:
If that is not enough bang for the buck simply size it up and trade two contracts or three. It’s so great now you can position size as you like exactly matching your risk preferences!
In either case you have to ask yourself if you really can afford to miss out on these trades!
So whether you’re trading a $10k account or a $100k account, Ambush has the right markets for you to start following the signals.
Again, ask yourself if you really can afford to miss out on these trades or at least be aware of the signals? Now if you’ve been on the other sides of these trades trying to buy the breakouts you maybe should think about switching sides?
With Ambush Signals you can easily follow Ambush, a system specialized in catching intraday market tops and bottoms in the Futures markets!
The most popular and easiest way to follow Ambush is Ambush Signals. It does all the work for you, allows you to customise what markets you want to see and has a position sizing tool implemented to automatically adjust the positions to your risk preferences.
Each day around 6:30 pm NY Time the Signals are available for you on the Dashboard. You can then place your orders and literally walk away until the next market close! To find out more about the details of Ambush and how Ambush Signals works, have a look at the Ambush Signals Website.
Let’s be realistic. Following any System can be tough, especially in the beginning. It simply needs time to build the confidence needed to make it through inevitable drawdowns. So what if you are unlucky and don’t catch a good start right away?
I want you to succeed trading Ambush Signals, so here’s something for you that will strongly increase your odds of success and allow you to easily gain the confidence you’ll need to become a long-term profitable Ambush trader.
Did you come up with questions? Don't be shy, email Marco Mayer, he wants to hear from you! This email address is being protected from spambots. You need JavaScript enabled to view it.
To view previous published Chart Scan newsletters, please log in or click on "Join Us,"
shown above, to subscribe to our free "Members Only" section.
A WEALTH OF INFORMATION & EDUCATION:
Joe Ross-Trading Educators' popular free Chart Scan Newsletter has been published since 2004.
Note: Unless otherwise noted, all charts used in Chart Scan commentary were created
by using Genesis Financial Technologies' Trade Navigator (with permission).
Legal Notice and Copyright 2019 Disclaimer - Published by Trading Educators, Inc.
Chart Scan is a complimentary educational newsletter.
"Teach our students the truth in trading - teach them how to trade,"
and
"Give them a way to earn while they learn - realizing that it takes time to develop a successful trader."
Derivative transactions, including futures, are complex and carry a high degree of risk. They are intended for sophisticated investors and are not suitable for everyone.
There are numerous other factors related to the markets in general or to the implementation of any specific trading program which cannot be
fully accounted for in the preparation of hypothetical performance results, and all of which can adversely affect actual trading results.
For more information, see the Risk Disclosure Statement for Futures and Options.