Joe Ross
Edition 809 - January 3, 2020
Edition 809 - January 3, 2020

Happy New Year, everyone! Joe Ross will have a special message in next week's newsletter. Be sure to tune in!

Master Trader Joe Ross
Author, Trader, Trading Mentor, and Founder of Trading Educators, Inc.
Developer of Instant Income Guaranteed
Chart Scan with Commentary: Options and Moving Averages Part 2
Last week we looked at entering and exiting trades based on where prices are relative to a 50 bar moving average. In this issue of Chart Scan, we are going to examine entering or exiting trades based on a Moving Average Crossover.
There are a variety of proponents for this kind of trade and they vary as to the number of bars to use in each MA to be used. Some insist on exponential Mas, and some are content with a simple MA. Personally, I don’t see that it matters at all, so long as you are consistent in the way you trade the crossover.
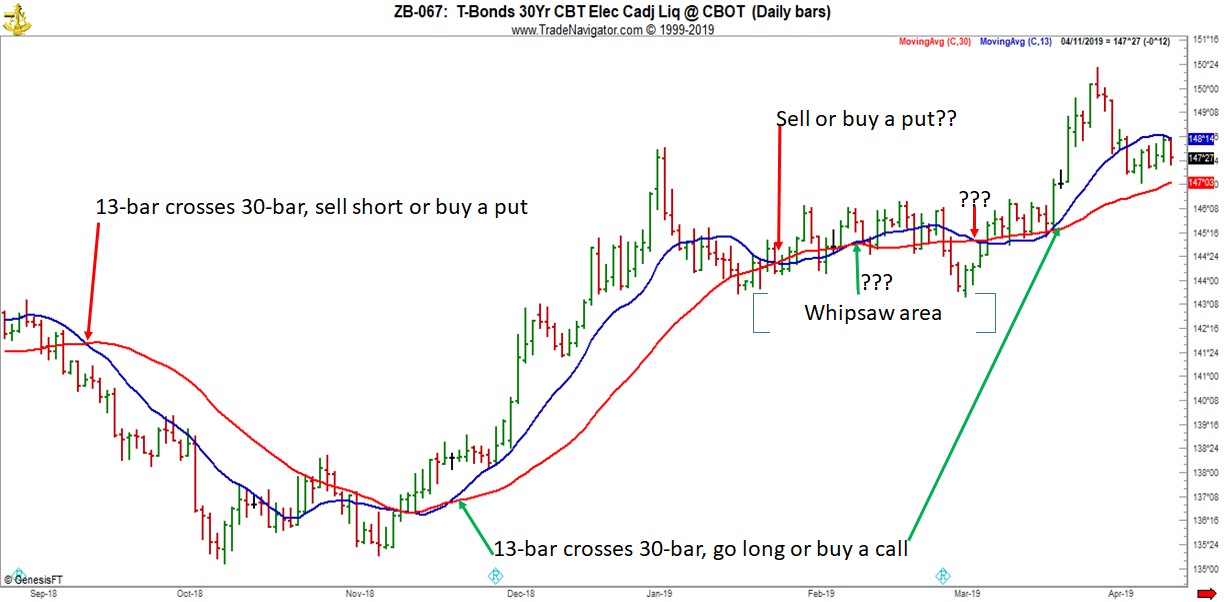
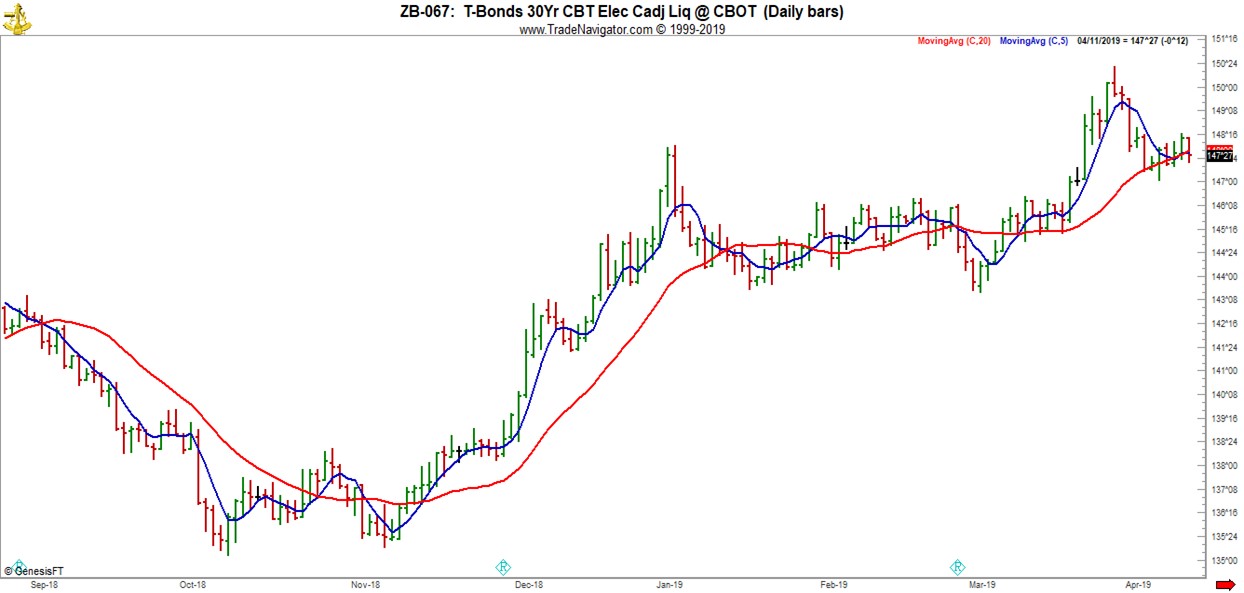
One magic combination I received calls for a 20-bar EMA, along with a 5-bar EMA. Another, uses a combination of 13-bars and 30-bars. The idea is to buy or sell when the lesser MA crosses the greater MA.
The example I will use is seen below using a 13-30 crossover. It’s the same bond chart I used in Part 1, so you can have something to compare. Notice that with this technique the trader must have considerable finesse in choosing entries and exits. As you can see, when prices are moving sideways in a trading range, moving average crossovers can chop you into little pieces. This method definitely must be accompanied with more rules and astute observation than a simple crossing of a single MA.
I’ll let you play with a chart using a 5-20 crossover.
In the next issue of Chart Scan, I’ll show you a bit about the way I trade options in the stock market.
© by Joe Ross. Re-transmission or reproduction of any part of this material is strictly prohibited without the prior written consent of Trading Educators, Inc.

Master Trader Joe Ross
Author, Trader, Trading Mentor, and Founder of Trading Educators, Inc.
Developer of Instant Income Guaranteed
Trading Article: Look at the Facts
Have you ever made a small losing trade and thought, "It's alright. I'll win on the next one." The next trade comes along, and you lose. And then the next one is a loser...read more.
© by Joe Ross. Re-transmission or reproduction of any part of this material is strictly prohibited without the prior written consent of Trading Educators, Inc.

Philippe Guartier: Administration and
New Developments of Instant Income Guaranteed
Trading Idea: Instant Income Guaranteed
DQ Trade
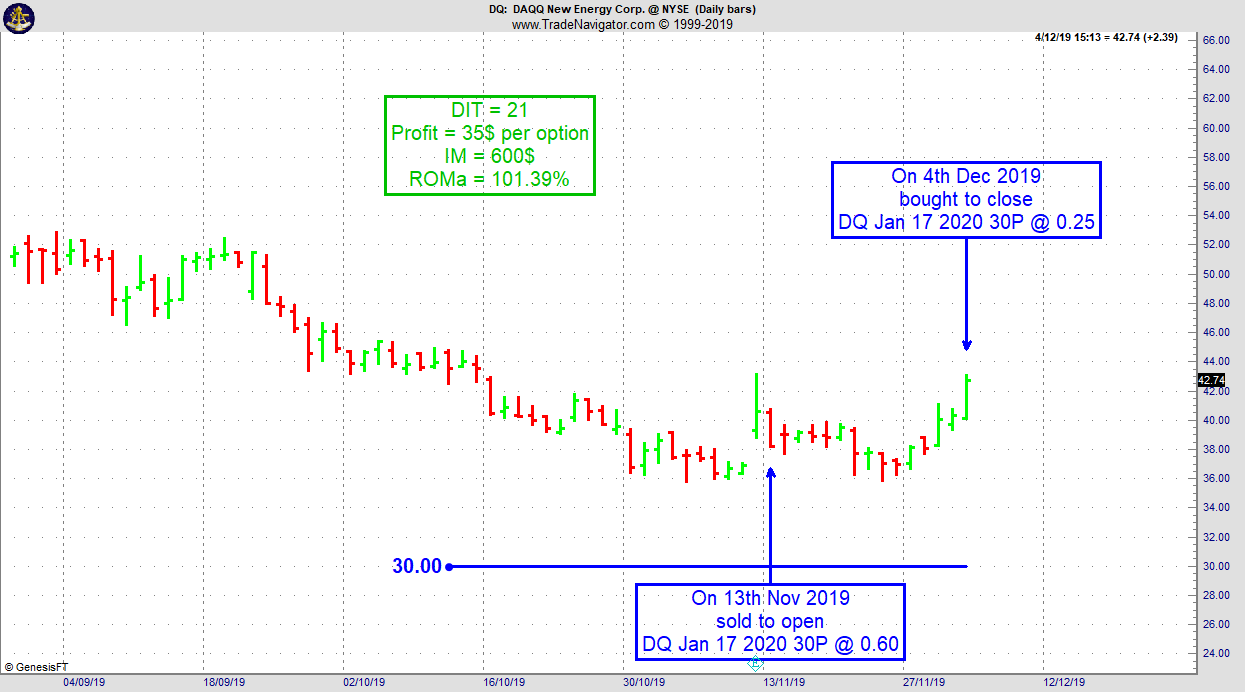
- On 13th November 2019, we sold to open DQ Jan 17 2020 30P @ 0.60, with 64 days until expiration and our short strike about 26% below price action.
- On 4th December 2019, we bought to close DQ Jan 17 2020 30P @ 0.25, after 21 days in the trade
Philippe
Learn More!
Instant Income Guaranteed
Receive daily trade recommendations - we do the research for you.
♦ SIGN UP TODAY! WEALTH BUILDING FOR YOUR FUTURE ♦
Need more information? We want to hear from you.
Contact us with questions!
© by Joe Ross and Philippe Gautier. Re-transmission or reproduction of any part of this material is strictly prohibited without the prior written consent of Trading Educators, Inc.

Professional Trader Andy Jordan
Educator for Spreads, Options, Swing, Day Trading, and
Editor of Traders Notebook Complete
Trading Article: Record your Trading
You must be disciplined in following the plan of your trade religiously. Once you have closed your position, you should record...read more.
Andy Jordan is the editor for Traders Notebook which shows you Futures Trading Strategies in Spreads, Options, and Swing Trades. Learn step-by-step how to trade successfully.
© by Andy Jordan. Re-transmission or reproduction of any part of this material is strictly prohibited without the prior written consent of Trading Educators, Inc.

Professional Trader Marco Mayer
Educator for Forex, Futures and Systematic Trader
Creator of Ambush Trading Method, Ambush Signals, and Head of AlgoStrats.com
Marco Mayer's Ambush Signals: Ambush closes 2019 making new all-time-highs!
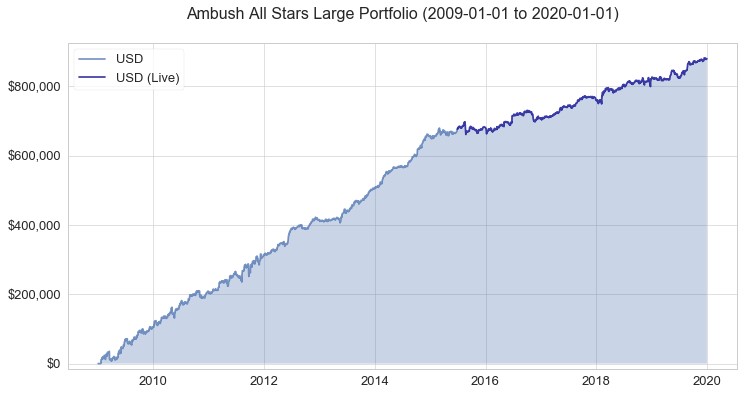
Ambush Traders had another great year with this Ambush performance finishing the year 2019 at new all-time highs! That's a really nice way to start into a new year giving ambush traders the confidence they need to look forward to the new year.
And I have to say, it is really amazing to witness this year after year for over a decade now. And every year I get the same kind of questions which are all versions of "will Ambush keep on performing well in the next year?!". And obviously I don't know for sure, because like everyone else I also can't look into the future.
But I can make some guesses and one of them is that unless a lot of markets start to behave very irregular and go all crazy, odds are that the very robust idea that makes Ambush work will continue to do so also in 2020.
Here's the long-term performance of the Ambush All-Stars large Portfolio featuring 10 markets from stocks over currencies to commodities:
Ready for you to get started with Ambush in 2020 is the new version of Ambush Signals, now featuring three different subscription models. You can find out more about Ambush and Ambush-Signals on https://ambush-signals.com and sign up for the upcoming Free Trial already!
Also, Ambush System itself is still for sale at a bargain price for a system that keeps on performing for so many years now: Have a look.
Happy New Year and Happy Trading in 2020!
Marco
Marco Mayer is an Educator for Forex, Futures and a Systematic Trader, so if you have questions, he wants to hear from you! Contact Marco with questions!
LEARN ABOUT AMBUSH TRADING METHOD
© by Marco Mayer. Re-transmission or reproduction of any part of this material is strictly prohibited without the prior written consent of Trading Educators, Inc.
WE APPRECIATE YOUR TRUST IN US
THANK YOU FOR YOUR BUSINESS!
Check out our Blog!
To view previous published Chart Scan newsletters, please log in or click on "Join Us,"
shown above, to subscribe to our free "Members Only" section.
A WEALTH OF INFORMATION & EDUCATION:
Joe Ross-Trading Educators' popular free Chart Scan Newsletter has been published since 2004.
Note: Unless otherwise noted, all charts used in Chart Scan commentary were created
by using Genesis Financial Technologies' Trade Navigator (with permission).
Legal Notice and Copyright 2019 Disclaimer - Published by Trading Educators, Inc.
Chart Scan is a complimentary educational newsletter.
© by Trading Educators, Inc. Re-transmission or reproduction of any part of this material is strictly prohibited without prior written consent.
Edition 808 - December 27, 2019
Edition 808 - December 27, 2019

Trading Educators hopes you enjoyed celebrating Christmas with your family and friends.
As we move into a new decade, be sure your trading plan is up to date for a profitable New Year!

Master Trader Joe Ross
Author, Trader, Trading Mentor, and Founder of Trading Educators, Inc.
Developer of Instant Income Guaranteed
Chart Scan with Commentary: Options and Moving Averages Part 1
I’ve noticed lately that more and more trading websites have been promoting the use of options for profit as compared with trading straight futures or stocks. One of my email addresses is literally being bombarded with offers to teach traders how to trade options and how to employ a variety of option strategies.
Often these emails give you a basic strategy for a directional trade, and then ultimately try to recruit you into using the leverage of options to show you that although the basic strategy results in profits, the magic strategy they are selling will result in considerably greater profits if you perform the strategy using options.
A typical strategy being offered is through the use of a moving average, usually a 50 bar Exponential Moving Average (EMA), although a Simple Moving Average will usually be just as good.
The idea behind this kind of trading, is that there is some sort of magic about a 50 bar moving average that makes it viable in any time frame. There is nothing magic about a 50 bar MA, other than that enough people believe in it that it has become a self-fulfilling prophecy. Here’s what such a strategy looks like, and if followed carefully and with good common sense, can be profitable with futures or stocks.
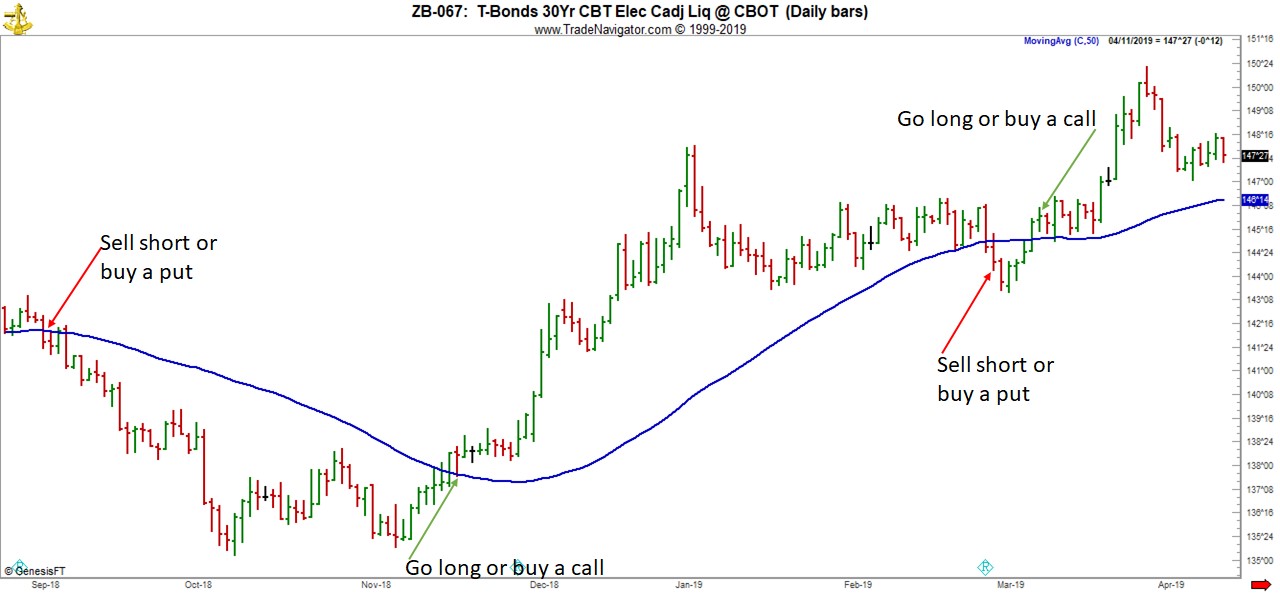
Obviously, this strategy worked quite well for a directional trade in the bond market. It probably works even better with stocks because stock traders react heavily to the 50 MA. Notice that the second sell short trade would not have done well on a 10-minute chart, but, depending on your trade management it could have been successful on a weekly or monthly chart. In either case, the suggested entry is a close above or below the 50 MA, with a protective stop either above or below the 50 MA, depending upon the direction of the trade.
© by Joe Ross. Re-transmission or reproduction of any part of this material is strictly prohibited without the prior written consent of Trading Educators, Inc.

Master Trader Joe Ross
Author, Trader, Trading Mentor, and Founder of Trading Educators, Inc.
Developer of Instant Income Guaranteed
Trading Article: Fighting Back
It's not the number of times you fail that matters. It is all about getting back up after you've been knocked down. Ask any successful person and you'll find that he or she has experienced a mountain of failure. Trading is a challenging profession. Few make it, and of those who do, many eventually...read more.
© by Joe Ross. Re-transmission or reproduction of any part of this material is strictly prohibited without the prior written consent of Trading Educators, Inc.

Philippe Guartier: Administration and
New Developments of Instant Income Guaranteed
Trading Idea: Instant Income Guaranteed
BZUN Trade
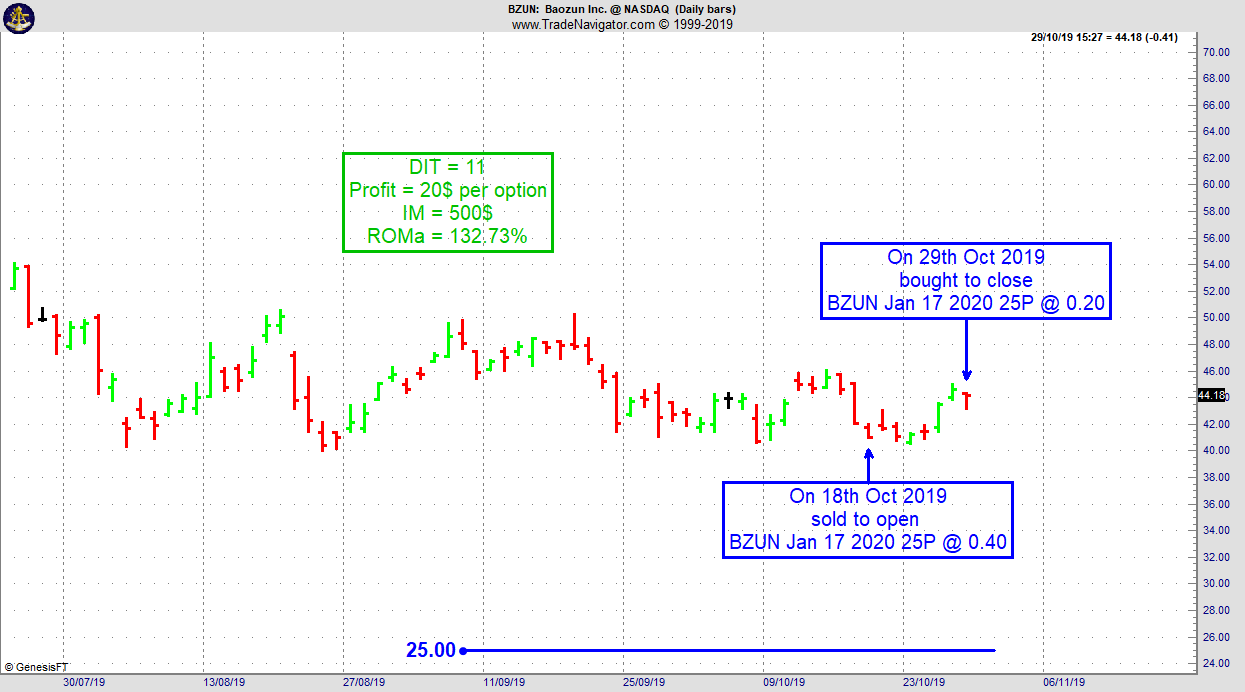
- On 18th October 2019, on a GTC order, we sold to open BZUN Jan 17 2020 25P @ 0.40, with 96 days until expiration and our short strike about 43% below price action, making the trade very safe.
- On 29th October 2019, we bought to close BZUN Jan 17 2020 25P @ 0.20, after 11 days in the trade.
Philippe
Learn More!
Instant Income Guaranteed
Receive daily trade recommendations - we do the research for you.
♦ SIGN UP TODAY! WEALTH BUILDING FOR YOUR FUTURE ♦
Need more information? We want to hear from you.
Contact us with questions!
© by Joe Ross and Philippe Gautier. Re-transmission or reproduction of any part of this material is strictly prohibited without the prior written consent of Trading Educators, Inc.

Professional Trader Andy Jordan
Educator for Spreads, Options, Swing, Day Trading, and
Editor of Traders Notebook Complete
Trading Article: Repeating the Same Mistakes
Anyone is allowed to make one mistake. When the mistake is repeated, watch out! The third repetition of the same mistake constitutes self-destructive...read more.
Andy Jordan is the editor for Traders Notebook which shows you Futures Trading Strategies in Spreads, Options, and Swing Trades. Learn step-by-step how to trade successfully.
© by Andy Jordan. Re-transmission or reproduction of any part of this material is strictly prohibited without the prior written consent of Trading Educators, Inc.

Professional Trader Marco Mayer
Educator for Forex, Futures and Systematic Trader
Creator of Ambush Trading Method, Ambush Signals, and Head of AlgoStrats.com
Marco Mayer's Ambush Signals: 2019 In Review
I can't believe that 2019 is already over, it feels like it just started! For me, it was a great year with a lot of opportunities, interesting developments and a very good trading year. Just right before the year ended I launched the new ambush-signals.com offering now three different subscription models and a complete overhaul of the website and product. A personal discovery for me has been that besides a huge passion for trading, another part of me is an engineer who loves to come up with great solutions, optimize things and build products.
So I thought what I want is just being a full-time trader, but what I found out this year is that I also need to give the engineer in me room to act out. Otherwise, I end up screwing up the trading part too by trying to perfect my trading and make things too complicated. I guess in the retrospective that's what went wrong with AlgoStratsFX which was a very sophisticated trading system. Instead what kept on actually working and performing very well was the astonishingly simple and hence robust Ambush System. Let's say I learned something from that experience and this year basically went further in that direction.
That's how I ended up with almost 50% profits and very little (about 7%) drawdown this year:
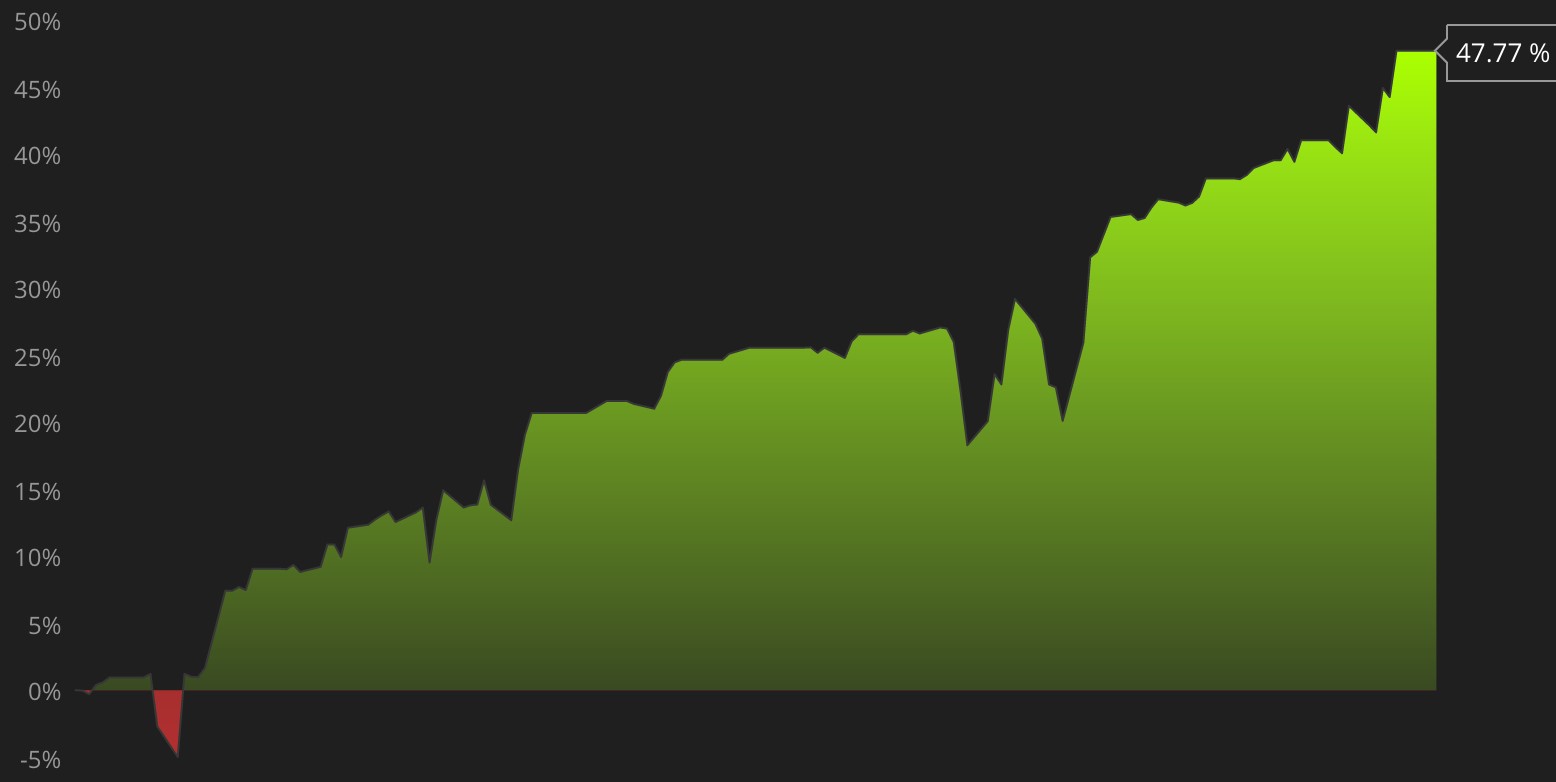
How did I do it? By trading in a very simple, very boring and slightly hazardous way. But I guess that's enough for now, I'll tell you more about it in 2020!
I wish all of you a Happy New Year and all the best for your trading!
Happy Trading!
Marco
Marco Mayer is an Educator for Forex, Futures and a Systematic Trader, so if you have questions, he wants to hear from you! Contact Marco with questions!
Check out Ambush Signals
LEARN ABOUT AMBUSH TRADING METHOD
© by Marco Mayer. Re-transmission or reproduction of any part of this material is strictly prohibited without the prior written consent of Trading Educators, Inc.
WE APPRECIATE YOUR TRUST IN US
THANK YOU FOR YOUR BUSINESS!
Check out our Blog!
To view previous published Chart Scan newsletters, please log in or click on "Join Us,"
shown above, to subscribe to our free "Members Only" section.
A WEALTH OF INFORMATION & EDUCATION:
Joe Ross-Trading Educators' popular free Chart Scan Newsletter has been published since 2004.
Note: Unless otherwise noted, all charts used in Chart Scan commentary were created
by using Genesis Financial Technologies' Trade Navigator (with permission).
Legal Notice and Copyright 2019 Disclaimer - Published by Trading Educators, Inc.
Chart Scan is a complimentary educational newsletter.
© by Trading Educators, Inc. Re-transmission or reproduction of any part of this material is strictly prohibited without prior written consent.
Edition 807 - December 20, 2019
Edition 807 - December 20, 2019


Master Trader Joe Ross
Author, Trader, Trading Mentor, and Founder of Trading Educators, Inc.
Developer of Instant Income Guaranteed
Chart Scan with Commentary: ATR
Hey Joe, you said to the effect that, “ATR is good for many important things a trader needs to know.” You said, “ATR has the ability to solve many problems that traders encounter. With ATR:
- We know our risk so we know where to place the stop.
- Because ATR is based on volatility, we know what our objective should be.
- ATR is able to fit the time frame into our comfort level.
- ATR shows us which markets to trade.
- ATR shows us the time of day to trade. What is the ATR when the volume is the best?
- ATR shows us how many contracts to trade.
Is there anything else you can use it for?”
Yes, there is. I can think of a couple more uses at the moment, and it’s best used in the stock market with stocks in the same sector. First let’s define what ATR is:
The Average True Range (ATR) is a technical analysis indicator that measures real volatility (not Implied Volatility) by decomposing the entire range of an asset price for that period. Simply put, a stock experiencing a high level of volatility has a higher ATR, and a low volatility stock has a lower ATR. The ATR may be used by traders to enter and exit trades, and it is a useful tool to add to a trading system. It was created to allow traders to more accurately measure the daily volatility of an asset by using simple calculations. The indicator does not indicate the price direction; rather it is used primarily to measure volatility.
A great way to use ATR is to compare stocks in a sector in order to trade together. You might buy a call for the more volatile stock and buy a put for the less volatile stock, in conjunction with their individual price direction.
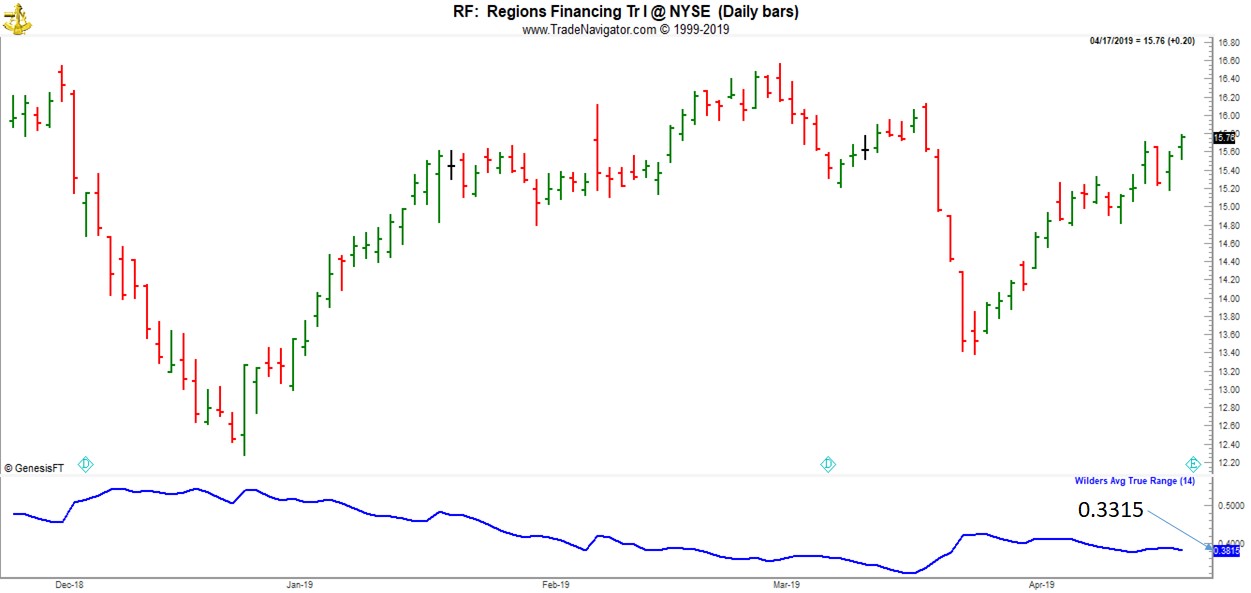
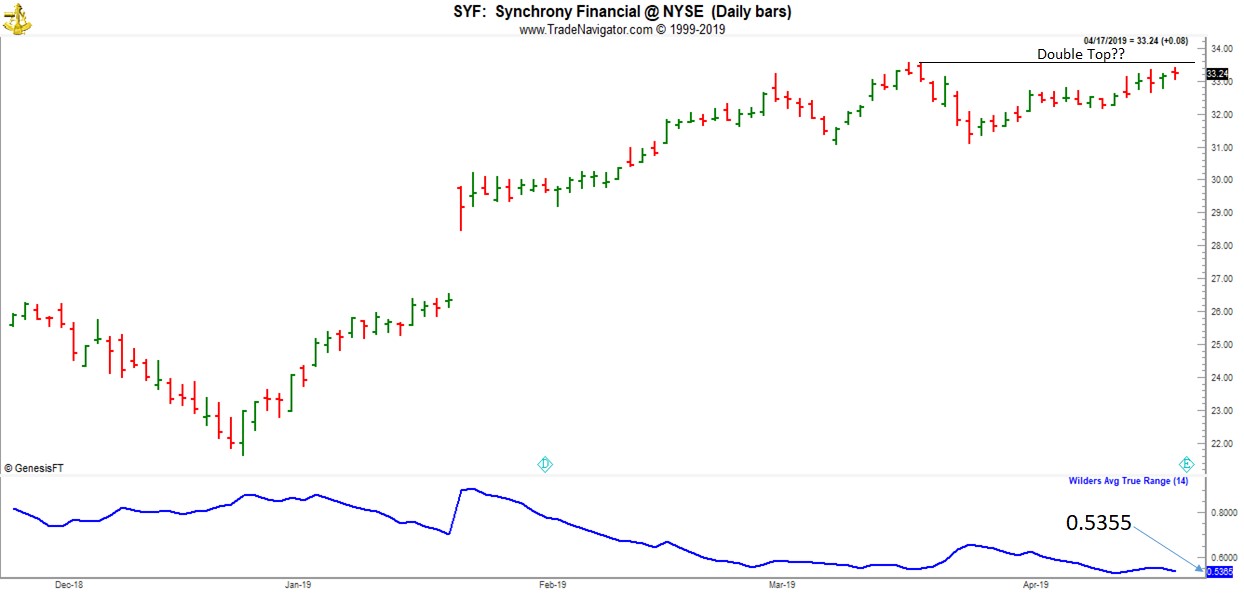
The charts above show two stocks trading in the financial sector. Both stocks have been moving up, but Synchrony Financial is considerably more volatile than Regions Financing. Think about how you might take advantage of that volatility. Options for Synchrony Financials are going to have higher option premium than options for Regions Financing.
If you wanted to use options to short Synchrony, instead of trading based on price, think about trading based on volatility—high volatility vs low volatility. Think about selling high volatility and buying low volatility. In that case, if you thought that prices are about to top out for Synchrony, you might sell a call on Synchrony and buy a put for Regions, creating a synthetic short position.
Or, you might sell the high volatility of Synchrony and use the money to help pay for a position in Regions, for example, sell a put on Synchrony and use the premium to buy a call on Regions.
© by Joe Ross. Re-transmission or reproduction of any part of this material is strictly prohibited without the prior written consent of Trading Educators, Inc.

Master Trader Joe Ross
Author, Trader, Trading Mentor, and Founder of Trading Educators, Inc.
Developer of Instant Income Guaranteed
Trading Article: Discipline and Temptation
Looking at your screen can be much like looking at a slot machine, and stopping yourself from dropping a dollar in the slot and pulling the handle. You must restrain yourself from making an impulsive trade, but there's a very human tendency to seek out excitement and receive a quick reward. You must fight temptation and maintain...read more.
© by Joe Ross. Re-transmission or reproduction of any part of this material is strictly prohibited without the prior written consent of Trading Educators, Inc.

Philippe Guartier: Administration and
New Developments of Instant Income Guaranteed
Trading Idea: Instant Income Guaranteed
PAAS Trade
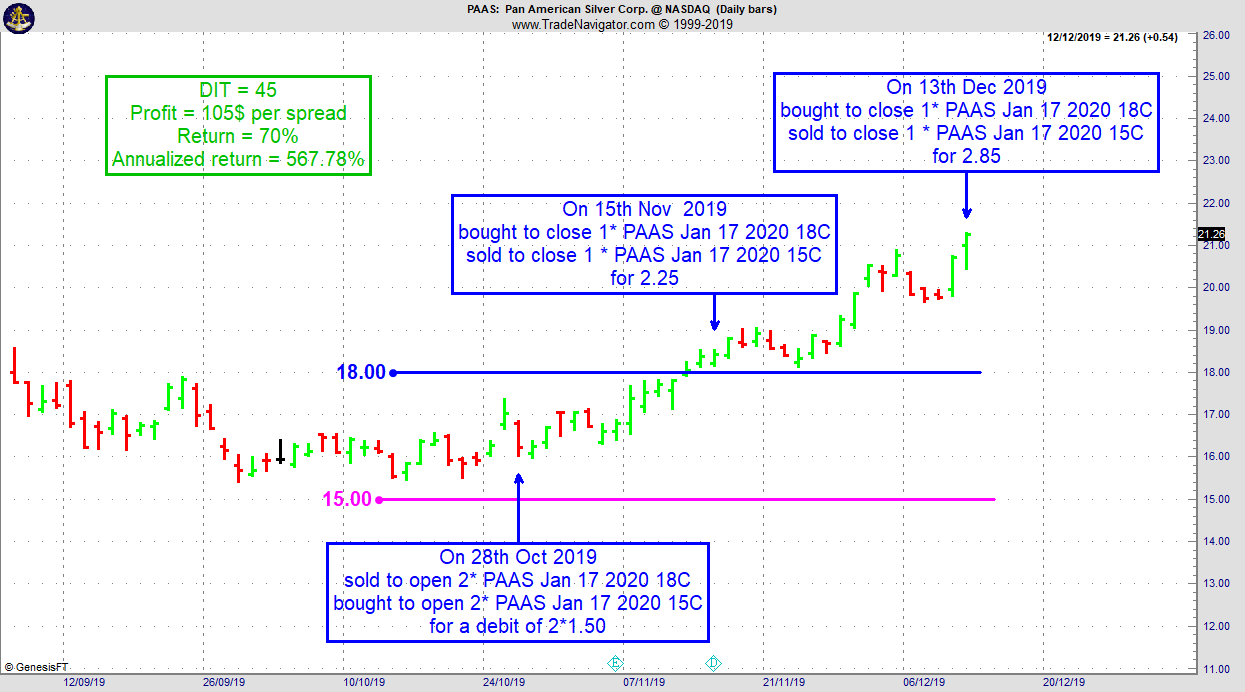
- On 28th October 2019, we sold to open PAAS Jan 17 2020 2019 18C and bought to open PAAS Jan 17 2020 15C for a debit of 1.50 (or 3.00 for 2 positions).
- On 15th November 2019, we bought to close PAAS Jan 17 2020 18C and sold to close PAAS Jan 17 2020 15C for 2.25.
- On 13th December 2019, we bought to close PAAS Jan 17 2020 18C and sold to close PAAS Jan 17 2020 15C for 2.85.
Philippe
Learn More!
Instant Income Guaranteed
Receive daily trade recommendations - we do the research for you.
♦ SIGN UP TODAY! WEALTH BUILDING FOR YOUR FUTURE ♦
Need more information? We want to hear from you.
Contact us with questions!
© by Joe Ross and Philippe Gautier. Re-transmission or reproduction of any part of this material is strictly prohibited without the prior written consent of Trading Educators, Inc.

Professional Trader Andy Jordan
Educator for Spreads, Options, Swing, Day Trading, and
Editor of Traders Notebook Complete
Trading Article: Who are you?
A thorough understanding of who you are and what makes you tick is essential in trading. How and what you think, what you believe, and how you...read more.
Andy Jordan is the editor for Traders Notebook which shows you Futures Trading Strategies in Spreads, Options, and Swing Trades. Learn step-by-step how to trade successfully.
© by Andy Jordan. Re-transmission or reproduction of any part of this material is strictly prohibited without the prior written consent of Trading Educators, Inc.

Professional Trader Marco Mayer
Educator for Forex, Futures and Systematic Trader
Creator of Ambush Trading Method, Ambush Signals, and Head of AlgoStrats.com
Marco Mayer's Ambush Signals
I wanted to give you all a a quick update on Ambush Signals. It's been a great service for many years now that a lot of you already enjoy, as it makes following the Ambush System so simple and easy.
But I decided it was time to make Ambush Signals even better for you. So we re-designed many parts of the website, made the Dashboard simpler and most importantly added support for spot Forex markets and now offer three different subscription models:
- Ambush Signals Pro is the Ambush Signals you already know, it includes all Futures markets and now of course also the new spot Forex markets.
- Ambush Signals Forex is a new subscription for those of you who're only interested in trading spot Forex, not the Futures markets. And it's just 1/2 the price of the Pro subscription!
- Ambush Signals Mini is somewhere in between, made for those of you who're trading only the smaller Future contracts like the Micro Index Futures. It also includes all of the spot Forex markets!
With the new subscriptions it's now possible to follow Ambush even with a small account!
For a full overview of the new subscriptions have a look at the new Ambush Signals website ambush-signals.com.
Happy Trading!
Marco
Marco Mayer is an Educator for Forex, Futures and a Systematic Trader, so if you have questions, he wants to hear from you! Contact Marco with questions!
Check out Ambush Signals
LEARN ABOUT AMBUSH TRADING METHOD
© by Marco Mayer. Re-transmission or reproduction of any part of this material is strictly prohibited without the prior written consent of Trading Educators, Inc.
WE APPRECIATE YOUR TRUST IN US
THANK YOU FOR YOUR BUSINESS!
Check out our Blog!
To view previous published Chart Scan newsletters, please log in or click on "Join Us,"
shown above, to subscribe to our free "Members Only" section.
A WEALTH OF INFORMATION & EDUCATION:
Joe Ross-Trading Educators' popular free Chart Scan Newsletter has been published since 2004.
Note: Unless otherwise noted, all charts used in Chart Scan commentary were created
by using Genesis Financial Technologies' Trade Navigator (with permission).
Legal Notice and Copyright 2019 Disclaimer - Published by Trading Educators, Inc.
Chart Scan is a complimentary educational newsletter.
© by Trading Educators, Inc. Re-transmission or reproduction of any part of this material is strictly prohibited without prior written consent.
Edition 806 - December 13, 2019
Edition 806 - December 13, 2019


Master Trader Joe Ross
Author, Trader, Trading Mentor, and Founder of Trading Educators, Inc.
Developer of Instant Income Guaranteed
Chart Scan with Commentary: Double Bottoms
Sometimes I receive questions that make me chuckle. Here’s one that came in recently?
Hey Joe! Do you believe in double bottoms?
What’s not to believe. They occur fairly often. Its’ what you do with them that’s important.
A Double Bottom pattern is a technical analysis charting pattern that describes a change in trend and a momentum reversal from prior leading price action. It describes the drop of a stock or index, a rebound, another move to the same or similar level as the original drop, and finally another rebound. The double bottom looks like the letter "W". The twice-touched low is considered a support level.
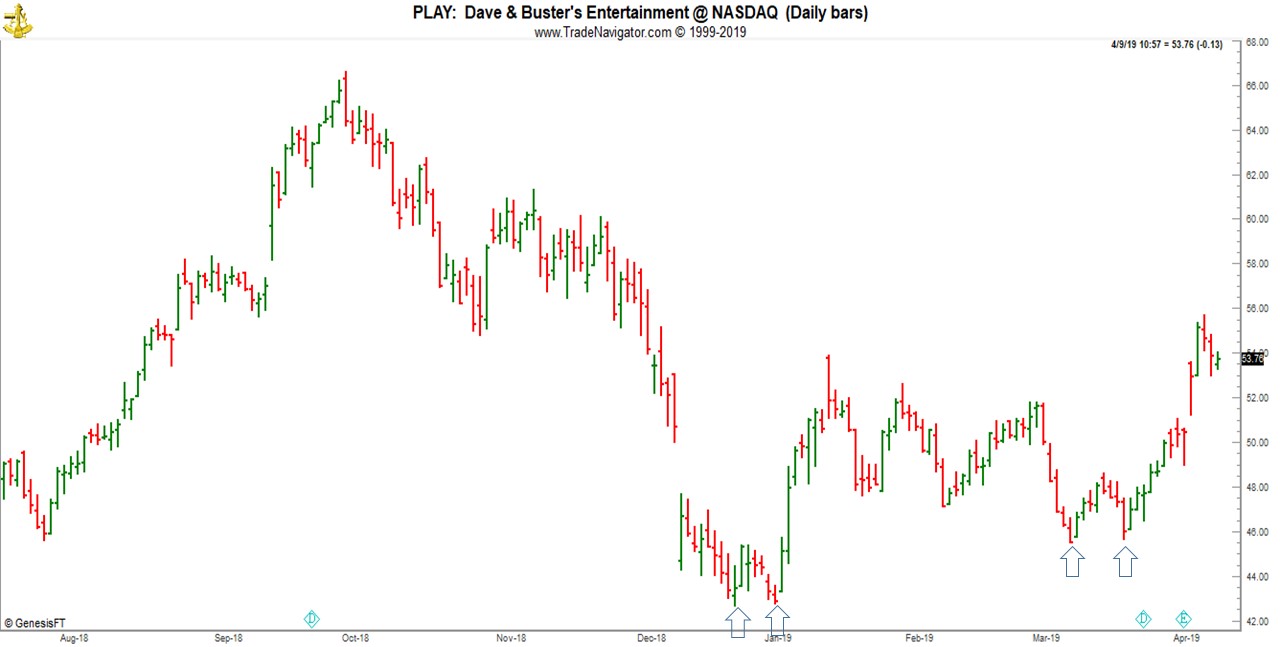
Double bottoms are essentially 1-2-3 lows. You can see them as support and go long, or you can enter with a traders trick ahead of the #2 point.
This is totally unlike any other trading concept we have ever encountered. Most traders, if they have something that works, do everything possible to keep it a secret. Dive further into Traders Trick Advanced Concepts - Recorded Webinar.
© by Joe Ross. Re-transmission or reproduction of any part of this material is strictly prohibited without the prior written consent of Trading Educators, Inc.

Master Trader Joe Ross
Author, Trader, Trading Mentor, and Founder of Trading Educators, Inc.
Developer of Instant Income Guaranteed
Trading Article: The News
What are the latest headlines? Do they impact the markets? Well, it depends. On Monday, October 17, 2005, here were some of the headlines that may have impacted you. GM reached a tentative agreement with the union. What's the impact? It seemed to satisfy long term investors. Company profits are bound to improve with lower...read more.
© by Joe Ross. Re-transmission or reproduction of any part of this material is strictly prohibited without the prior written consent of Trading Educators, Inc.

Philippe Guartier: Administration and
New Developments of Instant Income Guaranteed
Trading Idea: Instant Income Guaranteed
MOMO Trade
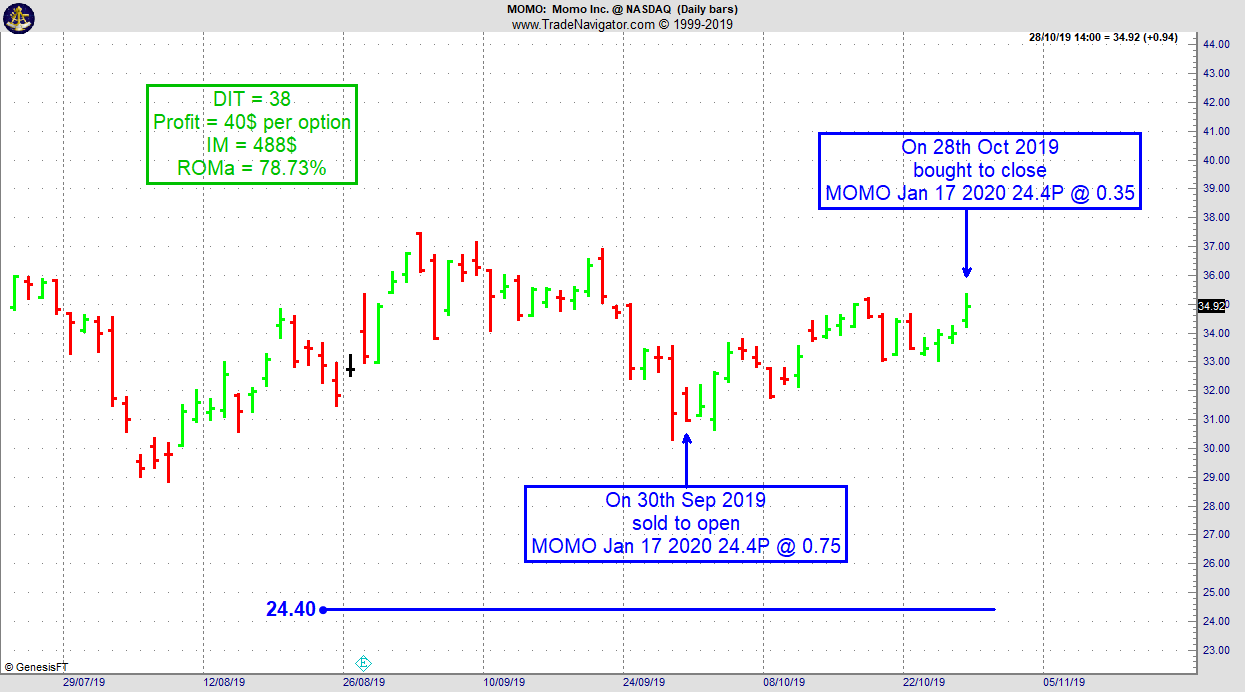
- On 30th September 2019, on a GTC order, we sold to open MOMO Jan 17 2020 24.4P @ 0.75, with 117 days until expiration and our short strike about 33% below price action, making the trade very safe.
- On 28th October 2019, we bought to close MOMO Jan 17 2020 24.4P @ 0.35, after 38 days in the trade.
Philippe
Learn More!
Instant Income Guaranteed
Receive daily trade recommendations - we do the research for you.
♦ SIGN UP TODAY! WEALTH BUILDING FOR YOUR FUTURE ♦
Need more information? We want to hear from you.
Contact us with questions!
© by Joe Ross and Philippe Gautier. Re-transmission or reproduction of any part of this material is strictly prohibited without the prior written consent of Trading Educators, Inc.

Professional Trader Andy Jordan
Educator for Spreads, Options, Swing, Day Trading, and
Editor of Traders Notebook Complete
Trading Article: Trading is a Business
Learning the business of trading is basically no different from learning any other business. The important thing is that you realize...read more.
Andy Jordan is the editor for Traders Notebook which shows you Futures Trading Strategies in Spreads, Options, and Swing Trades. Learn step-by-step how to trade successfully.
© by Andy Jordan. Re-transmission or reproduction of any part of this material is strictly prohibited without the prior written consent of Trading Educators, Inc.

Professional Trader Marco Mayer
Educator for Forex, Futures and Systematic Trader
Creator of Ambush Trading Method, Ambush Signals, and Head of AlgoStrats.com
Trading Article: Manual Backtesting Pitfalls
If you don’t want to learn how to backtest automatically right now but still want to profit from backtesting, you got to do it manually. That’s how I started too many years ago. I still remember sitting there with printed charts and writing down trade results on a separate sheet of paper.
Now there are some pitfalls you better...read more.
Marco Mayer is an Educator for Forex, Futures and a Systematic Trader, so if you have questions, he wants to hear from you! Contact Marco with questions!
Check out Ambush Signals
LEARN ABOUT AMBUSH TRADING METHOD
© by Marco Mayer. Re-transmission or reproduction of any part of this material is strictly prohibited without the prior written consent of Trading Educators, Inc.
WE APPRECIATE YOUR TRUST IN US
THANK YOU FOR YOUR BUSINESS!
Check out our Blog!
To view previous published Chart Scan newsletters, please log in or click on "Join Us,"
shown above, to subscribe to our free "Members Only" section.
A WEALTH OF INFORMATION & EDUCATION:
Joe Ross-Trading Educators' popular free Chart Scan Newsletter has been published since 2004.
Note: Unless otherwise noted, all charts used in Chart Scan commentary were created
by using Genesis Financial Technologies' Trade Navigator (with permission).
Legal Notice and Copyright 2019 Disclaimer - Published by Trading Educators, Inc.
Chart Scan is a complimentary educational newsletter.
© by Trading Educators, Inc. Re-transmission or reproduction of any part of this material is strictly prohibited without prior written consent.
Edition 805 - December 6, 2019
Edition 805 - December 6, 2019

What? You missed our Trading Educators Black Friday and Trader Tuesday deals?! It's not too late, contact us!

Master Trader Joe Ross
Author, Trader, Trading Mentor, and Founder of Trading Educators, Inc.
Developer of Instant Income Guaranteed
Chart Scan with Commentary: Volatility Stop
Lately, I’ve been teaching a student in China via SKYPE. One of the questions that has come up and also via seminars and emails is, “Where do you put the Stop?” That has to be the most loaded question I ever receive, because there is no definitive answer. However, in getting as close as I possibly could, I wrote an e-Book called “Stopped Out,” in which I did my best to answer that question. In it I showed the weaknesses in some stop placement schemes and the strength in others.
I received a question in via email about the “Volatility Stop indicator.” Joe, have you ever heard of Welles Wilder’s Volatility Stop? Do you know how to use it? I would appreciate any comments you care to make about it!
I have used VS in the past, and it’s a very good way to trail a stop when a market is trending. It is virtually worthless in a sideways market, unless that market is swinging wildly, with huge swings from high to low.
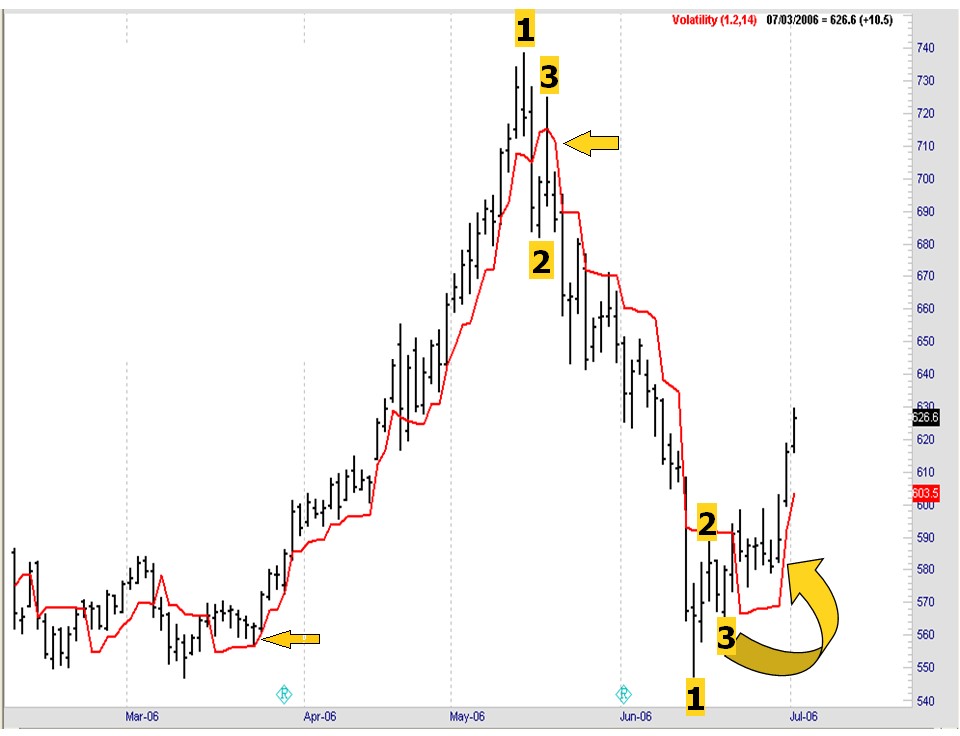
The trick I always used was what I call containment of the trend. As prices come out of congestion, typically with a 1-2-3 formation, possibly followed by a Ross hook, I begin looking for VS to curve around #3 point and begin tracking below the prices in an uptrend or above the prices in a downtrend.
We’ll look at that now.
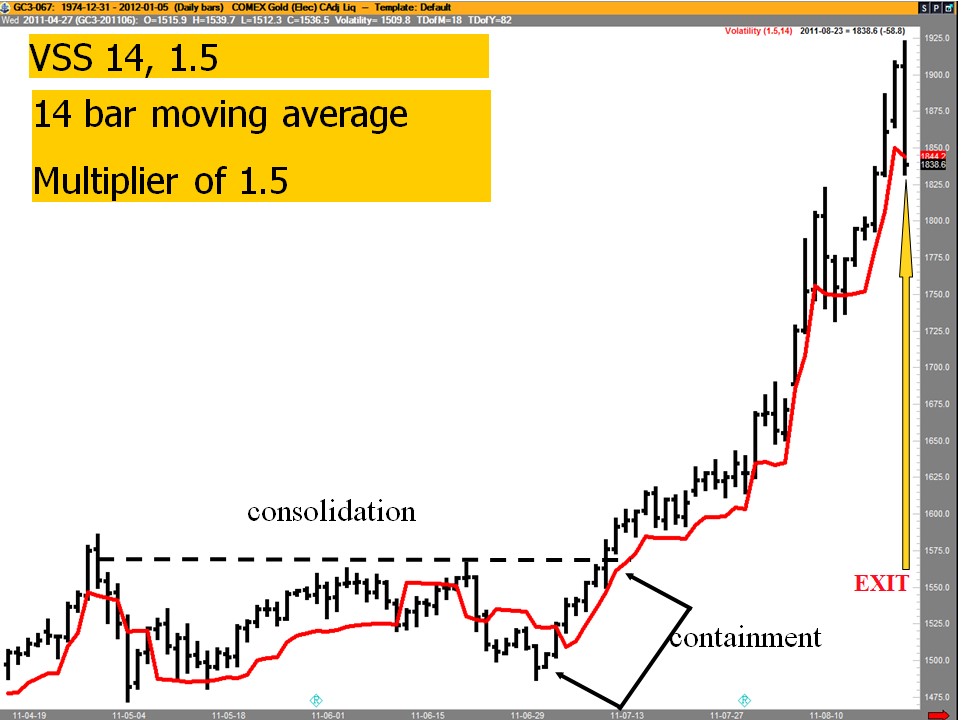
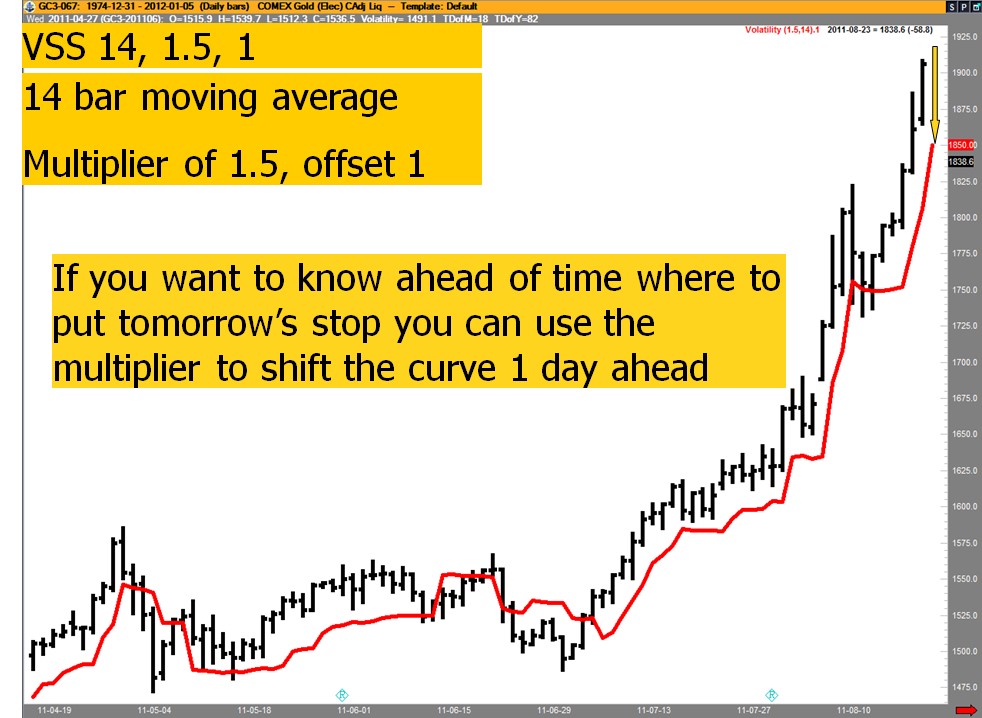
VS has 3 possible parameters. A moving average, a multiplier, and an offset feature (not all software have the offset). You have to fool around with the parameter settings until you find a best fit situation. By changing the parameters, we can curve fit VS to give us containment.
Once you are in the trade, you stay in until you get a close at or below the VS line. Interestingly, if you want to know where to put tomorrow ‘s stop, you can offset (displace) VS by one (or more) bars.
The next chart shows how by manipulating the settings, I was able to contain prices at 3 different turning points.
Complete details of how to set up and use the VS indicator are contained in the eBook stopped out, available on our website.
© by Joe Ross. Re-transmission or reproduction of any part of this material is strictly prohibited without the prior written consent of Trading Educators, Inc.

Master Trader Joe Ross
Author, Trader, Trading Mentor, and Founder of Trading Educators, Inc.
Developer of Instant Income Guaranteed
Trading Article: Getting Help
If you’re like most modern traders, you try to do it all. You study charts and historical data for trading opportunities. You struggle to devise a thorough, well-designed trading plan. You enter trades on your own electronic trading platform, and you monitor your trades to make midcourse corrections when necessary. Depending on your personality, available resources...read more.
© by Joe Ross. Re-transmission or reproduction of any part of this material is strictly prohibited without the prior written consent of Trading Educators, Inc.

Philippe Guartier: Administration and
New Developments of Instant Income Guaranteed
Trading Idea: Instant Income Guaranteed
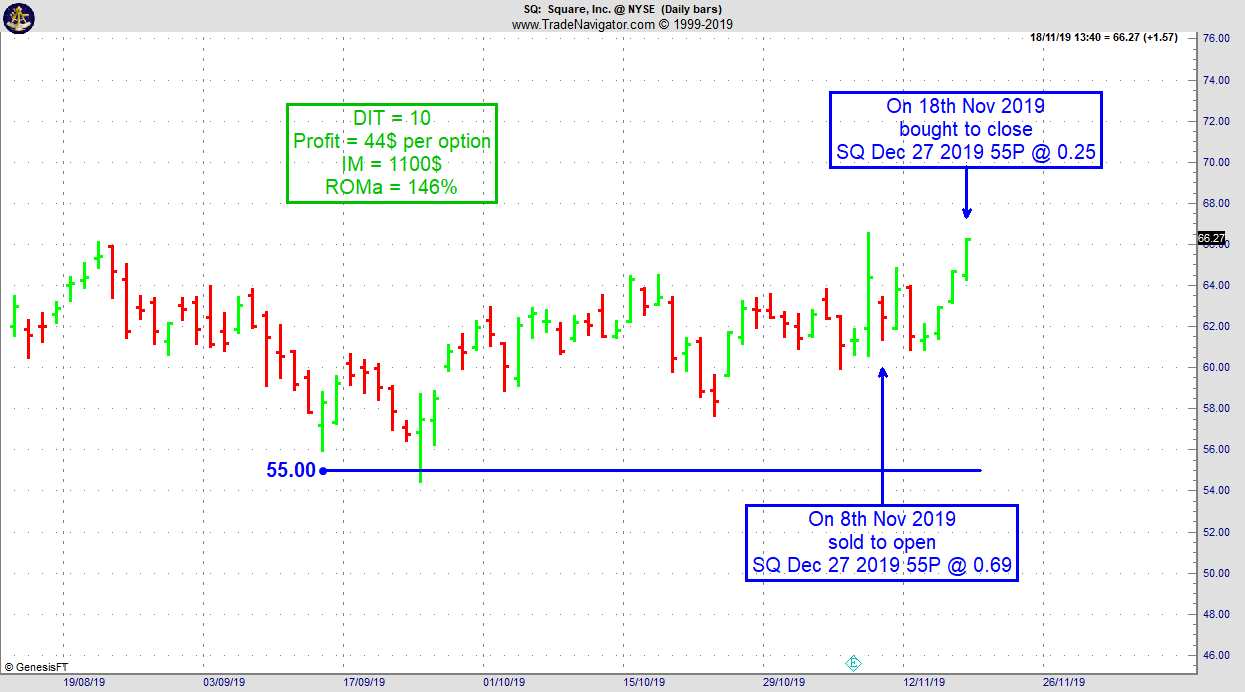
SQ Trade
- On 8th November 2019, we sold to open SQ Dec 27 2019 55P @ 0.69, with 49 days until expiration and our short strike about 15% below price action.
- On 18th November 2019, we bought to close SQ Dec 27 2019 55P @ 0.25, after 10 days in the trade
Philippe
Learn More!
Instant Income Guaranteed
Receive daily trade recommendations - we do the research for you.
♦ SIGN UP TODAY! WEALTH BUILDING FOR YOUR FUTURE ♦
Need more information? We want to hear from you.
Contact us with questions!
© by Joe Ross and Philippe Gautier. Re-transmission or reproduction of any part of this material is strictly prohibited without the prior written consent of Trading Educators, Inc.

Professional Trader Andy Jordan
Educator for Spreads, Options, Swing, Day Trading, and
Editor of Traders Notebook Complete
Trading Article: Self Control
To become a truly successful trader you must become a truly committed trader. How do you get yourself to be in control?
Statistics and society may predict, but you alone...read more.
Andy Jordan is the editor for Traders Notebook which shows you Futures Trading Strategies in Spreads, Options, and Swing Trades. Learn step-by-step how to trade successfully.
© by Andy Jordan. Re-transmission or reproduction of any part of this material is strictly prohibited without the prior written consent of Trading Educators, Inc.

Professional Trader Marco Mayer
Educator for Forex, Futures and Systematic Trader
Creator of Ambush Trading Method, Ambush Signals, and Head of AlgoStrats.com
Trading Article: Manual Backtesting Pitfalls
If you don’t want to learn how to backtest automatically right now but still want to profit from backtesting, you got to do it manually. That’s how I started too many years ago. I still remember sitting there with printed charts and writing down trade results on a separate sheet of paper.
Now there are some pitfalls you better...read more.
Marco Mayer is an Educator for Forex, Futures and a Systematic Trader, so if you have questions, he wants to hear from you! Contact Marco with questions!
Check out Ambush Signals
LEARN ABOUT AMBUSH TRADING METHOD
© by Marco Mayer. Re-transmission or reproduction of any part of this material is strictly prohibited without the prior written consent of Trading Educators, Inc.
WE APPRECIATE YOUR TRUST IN US
THANK YOU FOR YOUR BUSINESS!
Check out our Blog!
To view previous published Chart Scan newsletters, please log in or click on "Join Us,"
shown above, to subscribe to our free "Members Only" section.
A WEALTH OF INFORMATION & EDUCATION:
Joe Ross-Trading Educators' popular free Chart Scan Newsletter has been published since 2004.
Note: Unless otherwise noted, all charts used in Chart Scan commentary were created
by using Genesis Financial Technologies' Trade Navigator (with permission).
Legal Notice and Copyright 2019 Disclaimer - Published by Trading Educators, Inc.
Chart Scan is a complimentary educational newsletter.
© by Trading Educators, Inc. Re-transmission or reproduction of any part of this material is strictly prohibited without prior written consent.
Edition 804 - November 29, 2019
Edition 804 - November 29, 2019

A MESSAGE FROM MASTER TRADER JOE ROSS:
I am thankful for good health, and the ability to still trade, which I do almost every trading day. I’m thankful that my mind is still intact, and to be able to share what I’ve learned with others.
I’m thankful for our wonderful staff at TE, and for the many customers who have stuck with us over the years.
I’m thankful that the world is still mostly at peace and that I live in a country that offers much in the way of freedom. To be able to openly worship God is a great blessing for me, and others who feel the same way.
I have a roof over my head, food to eat, clothes to wear and a family to love.
I’m thankful for each one of you, and wish for every possible benefit to be yours,
Happy Thanksgiving,
JR
BLACK FRIDAY DEALS!

USE COUPON CODE - BLACKFRIDAY30:
RECEIVE 30% OFF!
Private Mentoring with Joe Ross - Learn More!
Instant Income Guaranteed
Stealth
USE COUPON CODE - BLACKFRIDAY50:
RECEIVE 50% OFF ANNUAL SUBSCRIPTION!
Andy Jordan's Traders Notebook - Learn More!

Master Trader Joe Ross
Author, Trader, Trading Mentor, and Founder of Trading Educators, Inc.
Developer of Instant Income Guaranteed
Chart Scan with Commentary: Long-Term Trading
I am in shock! Someone wrote in to ask about long-term trading. Do traders still trade that way? I thought just about everyone is trying to be a day trader these days. The following is the question posed to me:
Hey Joe! Do you have a simple way to follow a trend? Something that tells me when to get in and when to get out?
Take a look at the chart below. Then I’ll explain it. It is one of the first ways I learned to trade. With $125 per round turn commissions, I had to be able to stay in a trend just to get out of the commission hole I was in. You guys have no idea what it was like having to pay such high commissions.
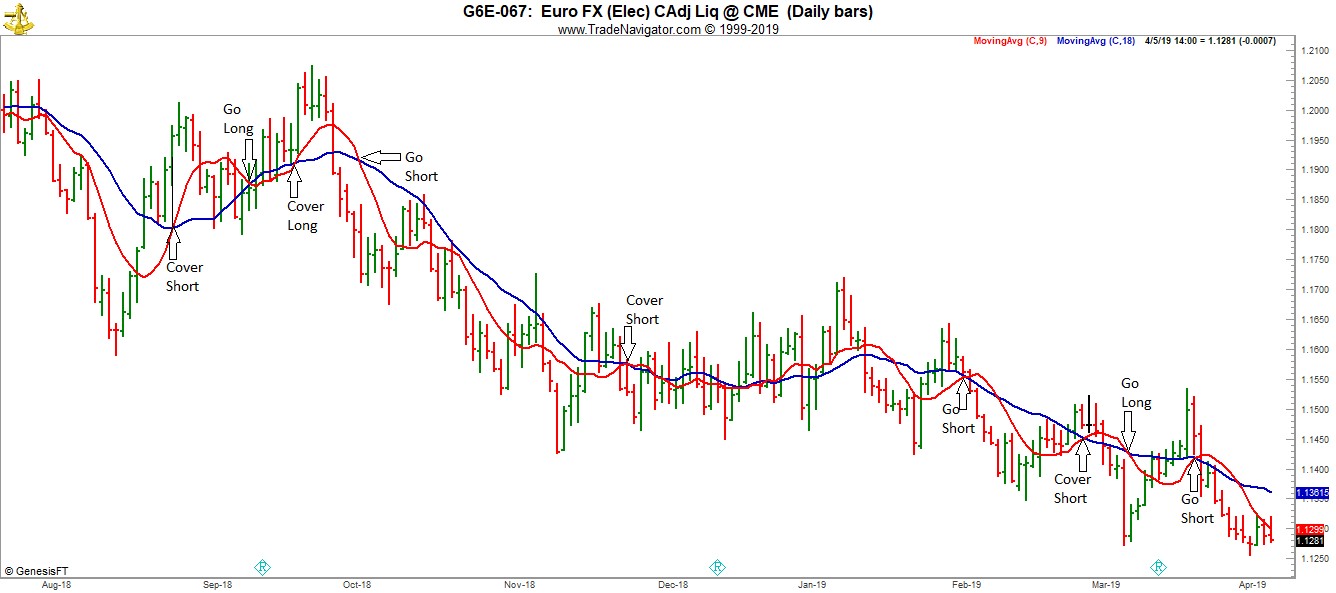
Starting from left to right: You were already short with prices moving into the first arrow. So when the blue line crossed the red line, you covered your short position. Notice that blue at that point was not indicating any direction—it was flat. When blue again crossed red, you went long—blue had upward direction.
Blue crossed red, so you had to sell to cover your long, and go short. You were probably stopped out with a loss.
Blue crossed red, and you went short, for a real nice ride. Blue crossed red again and you covered your short. Blue and red began running together. Go trade something else.
Finally, they began to separate again (at the second downward red loop, which came after the breakout of the trading range), blue crossed red, go short. Blue crossed red cover short, and go long. Blue crossed red, buy back long, and go short.
The method says you cannot perform the same action twice in a row. You either get out, or get out and reverse. You have to play with it for a while, across different markets. It works, and I used it for a long time.
What is the blue line? It’s a simple 18 bar moving average. It is really the trend line. What is the red line? It’s a simple 9 bar moving average. It is the trigger line. Crossing it triggers some kind of action. Making the moving average exponential, might make the method even better. I never tried it, because my weekly chart service had them as simple moving averages.
© by Joe Ross. Re-transmission or reproduction of any part of this material is strictly prohibited without the prior written consent of Trading Educators, Inc.

Master Trader Joe Ross
Author, Trader, Trading Mentor, and Founder of Trading Educators, Inc.
Developer of Instant Income Guaranteed
Trading Article: Hindsight
Do you remember your first impressions of trading? Perhaps you were young and had a strong desire to achieve early success, but if you were like most people, you had unrealistic expectations about the financial resources and skill level that were needed to trade profitably. You probably figured that you could just open a typical online brokerage account and turn $1,500 into a fortune. You probably didn’t hold this misconception very long, though. Soon, you learned that you needed...read more.
© by Joe Ross. Re-transmission or reproduction of any part of this material is strictly prohibited without the prior written consent of Trading Educators, Inc.

Philippe Guartier: Administration and
New Developments of Instant Income Guaranteed
Trading Idea: Instant Income Guaranteed
EHTH Trade
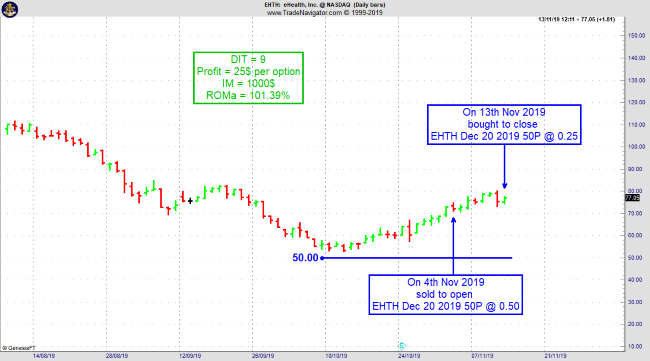
- On 4th November 2019, we sold to open EHTH Dec 20 2019 50P @ 0.50, with 46 days until expiration and our short strike about 32% below price action.
- On 13th November 2019, we bought to close EHTH Dec 20 2019 50P @ 0.25, after 9 days in the trade.
Philippe
Click Here to Learn More!
Instant Income Guaranteed
Receive daily trade recommendations - we do the research for you.
♦ SIGN UP TODAY! WEALTH BUILDING FOR YOUR FUTURE ♦
Learn More!
Instant Income Guaranteed
Need more information? We want to hear from you.
Email questions to This email address is being protected from spambots. You need JavaScript enabled to view it.
© by Joe Ross and Philippe Gautier. Re-transmission or reproduction of any part of this material is strictly prohibited without the prior written consent of Trading Educators, Inc.

Professional Trader Andy Jordan
Educator for Spreads, Options, Swing, Day Trading, and
Editor of Traders Notebook Complete
Trading Article: Is learning the trading business like learning any other business?
The importance of how you learn the business of trading cannot be minimized because of the factors that determine your success or failure. Learning the business of trading is...read more.
Andy Jordan is the editor for Traders Notebook which shows you Futures Trading Strategies in Spreads, Options, and Swing Trades. Learn step-by-step how to trade successfully.
© by Andy Jordan. Re-transmission or reproduction of any part of this material is strictly prohibited without the prior written consent of Trading Educators, Inc.

Professional Trader Marco Mayer
Educator for Forex, Futures and Systematic Trader
Creator of Ambush Trading Method, Ambush Signals, and Head of AlgoStrats.com
Trading Article: Manual Backtesting Pitfalls
If you don’t want to learn how to backtest automatically right now but still want to profit from backtesting, you got to do it manually. That’s how I started too many years ago. I still remember sitting there with printed charts and writing down trade results on a separate sheet of paper.
Now there are some pitfalls you better...read more.
Marco Mayer is an Educator for Forex, Futures and a Systematic Trader, so if you have questions, he wants to hear from you! This email address is being protected from spambots. You need JavaScript enabled to view it.
Check out Ambush Signals
LEARN ABOUT AMBUSH TRADING METHOD
© by Marco Mayer. Re-transmission or reproduction of any part of this material is strictly prohibited without the prior written consent of Trading Educators, Inc.
WE APPRECIATE YOUR TRUST IN US
THANK YOU FOR YOUR BUSINESS!
Check out our Blog!
To view previous published Chart Scan newsletters, please log in or click on "Join Us,"
shown above, to subscribe to our free "Members Only" section.
A WEALTH OF INFORMATION & EDUCATION:
Joe Ross-Trading Educators' popular free Chart Scan Newsletter has been published since 2004.
Note: Unless otherwise noted, all charts used in Chart Scan commentary were created
by using Genesis Financial Technologies' Trade Navigator (with permission).
Legal Notice and Copyright 2019 Disclaimer - Published by Trading Educators, Inc.
Chart Scan is a complimentary educational newsletter.
© by Trading Educators, Inc. Re-transmission or reproduction of any part of this material is strictly prohibited without prior written consent.
Edition 803 - November 22, 2019
Edition 803 - November 22, 2019

Joe Ross shares his knowledge as a trader!
Read Joe's latest Chart Scan with Commentary: Favorite Indicator
Use Coupon Code to Receive 35% OFF when you purchase Trading MORE Special Set-Ups
MORE35
CLICK HERE TO BUY AND START LEARNING FROM JOE TODAY!

Master Trader Joe Ross
Author, Trader, Trading Mentor, and Founder of Trading Educators, Inc.
Developer of Instant Income Guaranteed
Chart Scan with Commentary: Favorite Indicator
People often ask me about indicators, but recently, someone wrote in to ask, “What is your favorite indicator?”
As many of you know, I’m not big on using indicators. They can be useful for confirmation of what you see on a chart, and as many might know, they can be useful for predicting what other traders might do. For example, traders will react in a certain way when a 50 bar moving average crosses a 200 bar moving average, and vice-versa.
If I actually have a favorite indicator, it would have to be the 5,3,3 Stochastic. Let’s take a look.
The setting of ‘5’ is the number of bars (15 minutes, in this case) we are using for the calculation. The number ‘3’ is the smoothing factor for %K, and the other number ‘3’ is the setting we are using for %D. %K represents the moving average of the Stochastic values, and is the dashed yellow line on the next chart. %D is a ‘3 bar’ moving average of the %K, the solid orange line, also called the “Slow Stochastic.”
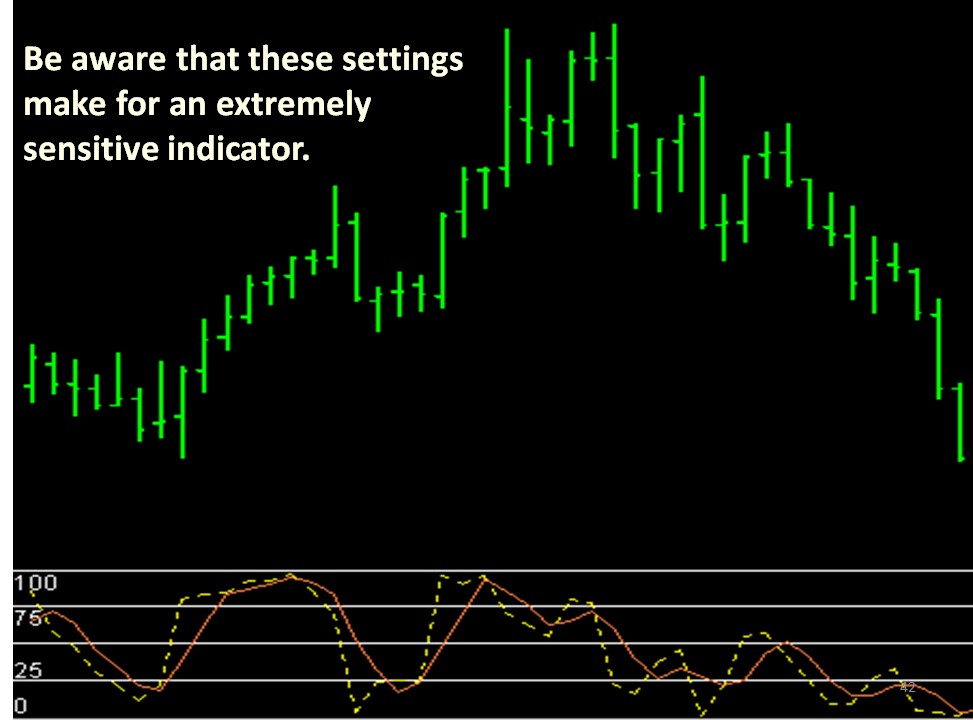
Be aware that these settings make for an extremely sensitive indicator. However, if we are going to use an indicator here, we want it to be very responsive to the price movements.
There are two valid signals available when working with Stochastics.
- Buy and sell signals are based entirely on a crossing of the “D” plot by the “K” plot. If K is within one time interval of crossing “D,” we can make the trade.
What do I mean by “one time interval?” I am saying that if “K” will cross, is crossing, or has crossed “D” on the day, hour, or the minute, you can take the trade depending on the time frame you in which you are trading.
- I also look at divergence at the time I want to enter a trade. Stochastic must be in coordination with prices. If prices are trending up, Stochastic must also be trending up. If prices are trending down, Stochastic must also be trending down.
Below, I’ve shown you two perfect trades using a Stochastic crossover. There were two other possible trades to enter long. The first was not entered because “K” had already crossed “D” by more than one time interval. Another possibility to go long had the same problem, but even worse, “K” had already crossed “D” the wrong way, so we also had divergence.
There was one other possibility to go short, but was not taken. That possibility had the problem that “K” had already crossed “D” by more than one time interval.
See if you can spot the possible trades that were not taken. One of them would have turned out to be a terrific trade. However, the other two, would have been terrible trades. In those cases, Stochastics kept me out of a couple of bad trades.
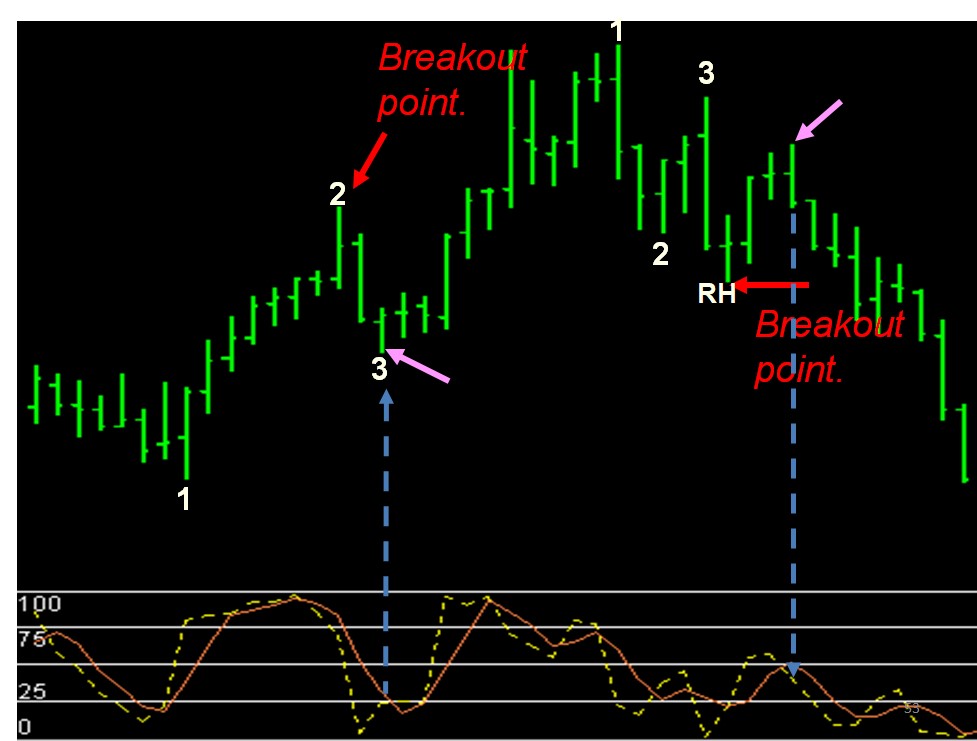
My use of Stochastics as a filter for trade entries is quite different from the way most people try to use this indicator. Most users of Stochastics try to find “overbought” and “oversold” situations by viewing Stochastics relative to a fixed scale that attempts to measure momentum. But as explained above, I don’t care where Stochastics are relative to a scale. I simply want to know where %D and %K are relative to each other.
The technique and others are explained in my Recorded Webinar “Trading MORE Special Set-Ups”.
Joe Ross shares his knowledge as a trader!
Use Coupon Code to Receive 35% OFF when you purchase Trading MORE Special Set-Ups
MORE35
CLICK HERE TO BUY AND START LEARNING FROM JOE TODAY!
© by Joe Ross. Re-transmission or reproduction of any part of this material is strictly prohibited without the prior written consent of Trading Educators, Inc.

Master Trader Joe Ross
Author, Trader, Trading Mentor, and Founder of Trading Educators, Inc.
Developer of Instant Income Guaranteed
Trading Article: Protection
It was a muggy day and I couldn’t seem to do anything right. I fumbled around all morning. He hadn’t slept the previous night. I was tired, and was tempted to just quit for the day, drink some ice-tea, and sit in a hammock by the pool. But I still had enough willpower to fight...read more.
© by Joe Ross. Re-transmission or reproduction of any part of this material is strictly prohibited without the prior written consent of Trading Educators, Inc.

Philippe Guartier: Administration and
New Developments of Instant Income Guaranteed
Trading Idea: Instant Income Guaranteed
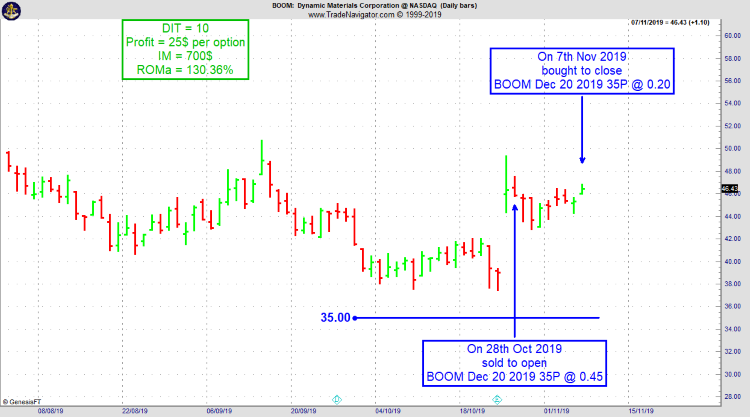
BOOM Trade
- On 28th October 2019, we sold to open BOOM Dec 20 2019 35P @ 0.45, with 52 days until expiration and our short strike about 24% below price action.
- On 7th November 2019, we bought to close BOOM Dec 20 2019 35P @ 0.20, after 10 days in the trade
Philippe
Click Here to Learn More!
Instant Income Guaranteed
30% Savings using coupon code: iig30
Receive daily trade recommendations - we do the research for you.
♦ SIGN UP TODAY! WEALTH BUILDING FOR YOUR FUTURE ♦
Learn More!
Instant Income Guaranteed
Need more information? We want to hear from you.
Email questions to This email address is being protected from spambots. You need JavaScript enabled to view it.
30% Savings using coupon code: iig30
© by Joe Ross and Philippe Gautier. Re-transmission or reproduction of any part of this material is strictly prohibited without the prior written consent of Trading Educators, Inc.
BECOME A PART OF OUR TRADING TEAM
JOIN TODAY
INSTANT INCOME GUARANTEED

Professional Trader Andy Jordan
Educator for Spreads, Options, Swing, Day Trading, and
Editor of Traders Notebook Complete
Trading Article: Ed Seykota Golden Trading Rules
Here is what I found on Wikipedia about Ed Seykota:
Edward Arthur Seykota (born August 7, 1946) is a commodities trader, who earned S.B. degrees in Electrical Engineering from MIT and Management from the MIT Sloan School of Management, both in 1969. In 1970, he pioneered Systems trading by using early...read more.
Andy Jordan is the editor for Traders Notebook which shows you Futures Trading Strategies in Spreads, Options, and Swing Trades. Learn step-by-step how to trade successfully.
© by Andy Jordan. Re-transmission or reproduction of any part of this material is strictly prohibited without the prior written consent of Trading Educators, Inc.

Professional Trader Marco Mayer
Educator for Forex, Futures and Systematic Trader
Creator of Ambush Trading Method, Ambush Signals, and Head of AlgoStrats.com
Trading Article: Manual Backtesting Pitfalls
If you don’t want to learn how to backtest automatically right now but still want to profit from backtesting, you got to do it manually. That’s how I started too many years ago. I still remember sitting there with printed charts and writing down trade results on a separate sheet of paper.
Now there are some pitfalls you better...read more.
Marco Mayer is an Educator for Forex, Futures and a Systematic Trader, so if you have questions, he wants to hear from you! This email address is being protected from spambots. You need JavaScript enabled to view it.
Check out Ambush Signals
LEARN ABOUT AMBUSH TRADING METHOD
© by Marco Mayer. Re-transmission or reproduction of any part of this material is strictly prohibited without the prior written consent of Trading Educators, Inc.
WE APPRECIATE YOUR TRUST IN US
THANK YOU FOR YOUR BUSINESS!
Check out our Blog!
To view previous published Chart Scan newsletters, please log in or click on "Join Us,"
shown above, to subscribe to our free "Members Only" section.
A WEALTH OF INFORMATION & EDUCATION:
Joe Ross-Trading Educators' popular free Chart Scan Newsletter has been published since 2004.
Note: Unless otherwise noted, all charts used in Chart Scan commentary were created
by using Genesis Financial Technologies' Trade Navigator (with permission).
Legal Notice and Copyright 2019 Disclaimer - Published by Trading Educators, Inc.
Chart Scan is a complimentary educational newsletter.
© by Trading Educators, Inc. Re-transmission or reproduction of any part of this material is strictly prohibited without prior written consent.
Edition 802 - November 15, 2019
Edition 802 - November 15, 2019


Master Trader Joe Ross
Author, Trader, Trading Mentor, and Founder of Trading Educators, Inc.
Developer of Instant Income Guaranteed
Chart Scan with Commentary: CCI
Hey Joe! I’m submitting the following from an email I received.
“Traders and investors use the commodity channel index to help identify price reversals, extremes and trend strength.
“As with most indicators, the CCI should be used in conjunction with other aspects of technical analysis. CCI fits into the momentum category of oscillators. In addition to momentum, volume indicators and the chart patterns may also influence a technical assessment.
“CCI is often used for detecting divergences from price trends as an overbought/oversold indicator, and to draw patterns on it and trade according to those patterns.
In this respect, it is similar to Bollinger Bands, but is presented as an indicator rather than as overbought/oversold levels.”
I thought you said that CCI is a volatility indicator, so what do you say about the above quote?
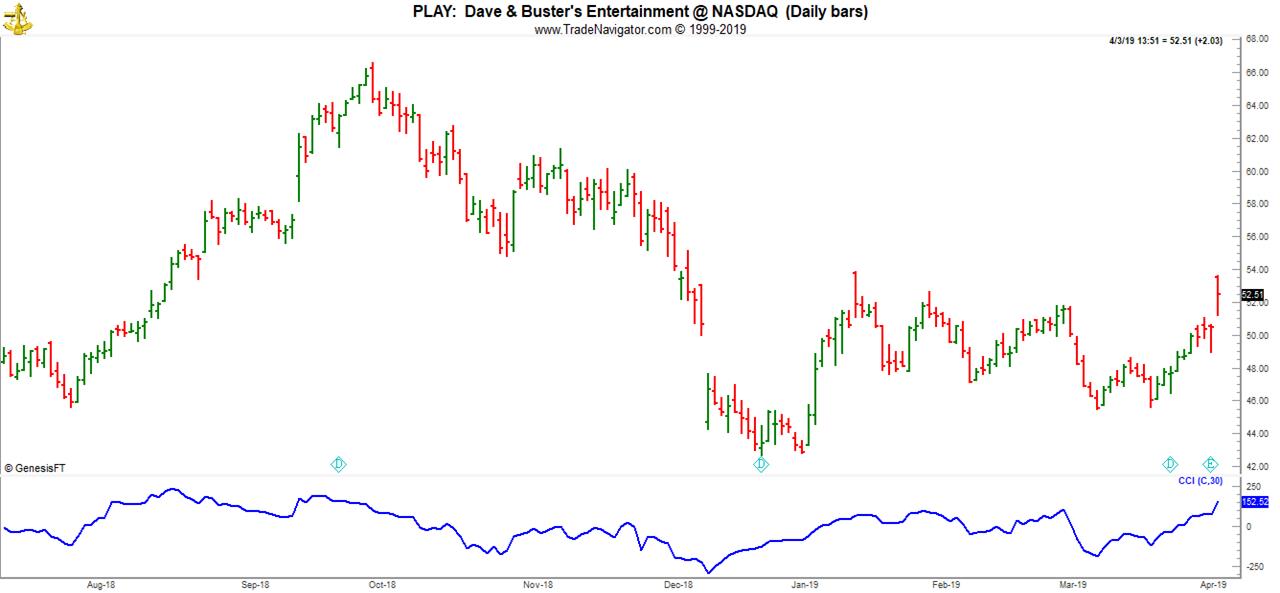
LOL! Whoever wrote that quote doesn’t know his/her knee from his/her elbow. He/she admits that CCI is like Bollinger Bands (which should be capitalized), and Bollinger Bands are definitely based on volatility, not momentum.
CCI (Commodity Channel Index) compares today’s typical price to the Mean Deviation of a moving average of typical prices. Typical price can be figured as high minus low (that’s volatility), or the average of high minus low plus close/3, or high minus low, plus close plus open/4. All of those computations reveal volatility, not momentum. In other words, how much did price move during the time interval being measured?
I believe the default setting for CCI is 21 bars. However, I have always used 30 bars as the best setting.
Momentum indicators have fixed upper and lower limits. Since there is no upper or lower limit to the reach of the bands, as there are with momentum indicators. How in the world can CCI be an overbought/oversold indicator? Which possible value would indicate overbought or oversold? CCI can move infinitely higher or infinitely lower.
© by Joe Ross. Re-transmission or reproduction of any part of this material is strictly prohibited without the prior written consent of Trading Educators, Inc.

Master Trader Joe Ross
Author, Trader, Trading Mentor, and Founder of Trading Educators, Inc.
Developer of Instant Income Guaranteed
Trading Article: Be Objective
When your money is on the line, you can't help but feel a little uneasy. What if you lose? It's hard not to put some of your ego on the line with your money, and when you lose, feel hurt. Winning traders, though, keep cool. They don't ride a roller coaster ride of emotions, feeling euphoric after a win and beaten after a...read more.
© by Joe Ross. Re-transmission or reproduction of any part of this material is strictly prohibited without the prior written consent of Trading Educators, Inc.

Philippe Guartier: Administration and
New Developments of Instant Income Guaranteed
Trading Idea: Instant Income Guaranteed
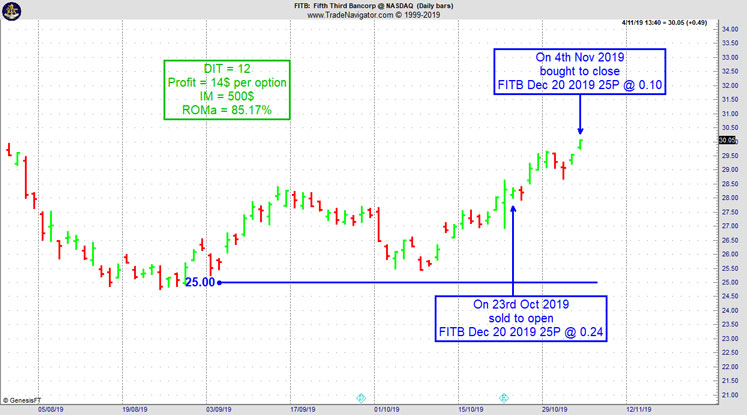
FITB Trade
- On 23rd October 2019, we sold to open FITB Dec 20 2019 25P @ 0.24, with 57 days until expiration and our short strike about 12% below price action.
- On 4th November 2019, we bought to close FITB Dec 20 2019 25P @ 0.10, after 12 days in the trade.
Philippe
Receive daily trade recommendations - we do the research for you.
♦ SIGN UP TODAY! WEALTH BUILDING FOR YOUR FUTURE ♦
Learn More!
Instant Income Guaranteed
30% Savings using coupon code: iig30
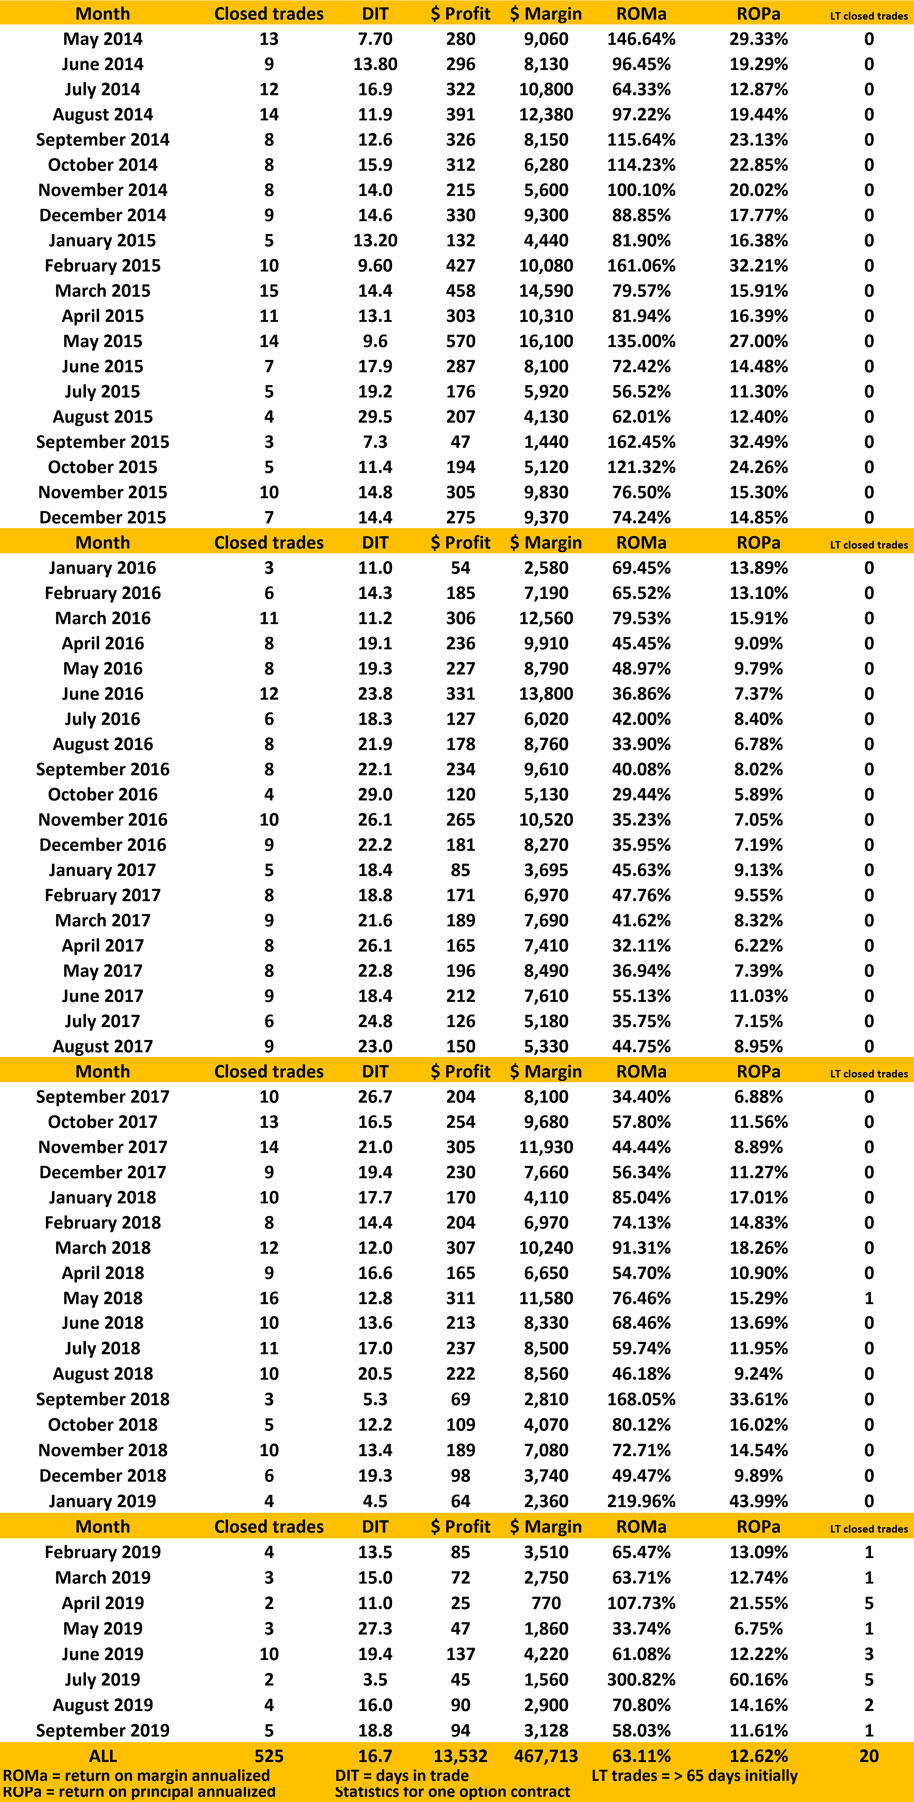
PERFORMANCE RECORD
SEPTEMBER 2019 TO MAY 2014
INSTANT INCOME GUARANTEED
Need more information? We want to hear from you.
Email questions to This email address is being protected from spambots. You need JavaScript enabled to view it.
30% Savings using coupon code: iig30

© by Joe Ross and Philippe Gautier. Re-transmission or reproduction of any part of this material is strictly prohibited without the prior written consent of Trading Educators, Inc.
BECOME A PART OF OUR TRADING TEAM
JOIN TODAY
INSTANT INCOME GUARANTEED

Professional Trader Andy Jordan
Educator for Spreads, Options, Swing, Day Trading, and
Editor of Traders Notebook Complete
Trading Article: The Golden Rules of Martin S. Schwartz
I like Marty Schwartz and his trading book “Pit Bull” a lot. It is an honest book about a trader who had his ups and downs in the market as we all do. In his book he writes....read more.
Andy Jordan is the editor for Traders Notebook which shows you Futures Trading Strategies in Spreads, Options, and Swing Trades. Learn step-by-step how to trade successfully.
© by Andy Jordan. Re-transmission or reproduction of any part of this material is strictly prohibited without the prior written consent of Trading Educators, Inc.

Professional Trader Andy Jordan
Educator for Spreads, Options, Swing, Day Trading, and
Editor of Traders Notebook Complete
Traders Notebook: How to Read a P&L Chart
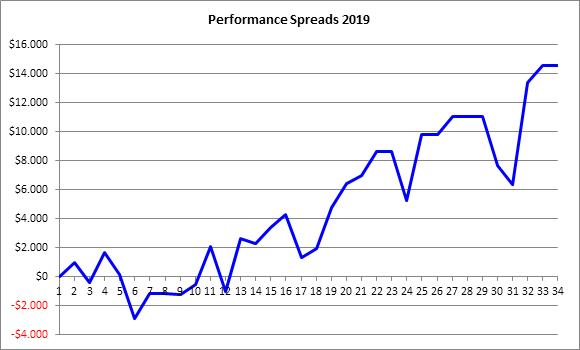
Let's look at the P&L chart of all spread trade recommendations in Traders Notebook since January 2019. I would like to discuss a few things a trader should always check to see if a trading method or a specific way of trading makes sense. As we can see on the (hypothetical) P&L chart from below, the profit reached almost $15k:
- What does “$15k” mean?
- What was the risk?
- What about the draw-downs?
- Were there enough trades to see the results are statistically significant?
Let’s go through it, step-by-step:
A result of about $15k is kind of meaningless, as long as we don’t know how much money we need so we can get to this result. This is usually the point, where a good marketing specialist will look up how much margin was used to cover the trades and then he will probably tell you the following: “You could have reached that result with an account size of about $15k, Andy. As you can see, this means a return of about 100%! Isn’t that awesome?” But wait a minute. After the trades are done, it is always easy to calculate the optimized values to present huge profits. But what would have happened if there were more losing trades in a row? Well, easy answer: You would have been out of business! So, let’s have a look at the chart by ourselves and forget about the marketing guy. As we can see, the largest draw-down happened around trade 31 of about $5k. Is there a way we can have a few of these draw-downs in a row? Yes, of course. To be on the save side, we better look at the largest draw-down and we multiply this value a couple of times so we can resist even larger draw-down periods. How often we multiply the draw-down is of course up to each trader, but I would use at least 3 to 4 times the largest draw-down ($15k - $20k). Therefore, an account size of about $30k to $40k or even better $50k make much more sense to reach these results. And if we use for example an account size of $50k for our calculation, our profit is down to about 30%, which is by the way still pretty good in the world of “real trading” and not “marketing trading”.
Of course, you can take the trades also with a smaller account, let’s say with only $25k, but then you should also reduce your profit expectation, just to be not too disappointed after one year of trading. Especially beginning traders get disappointed when they make “only” 20% or 30% a year because they have statements like “I made 1 million out of $10,000 in just one year” in mind. But I can tell you, using good risk and money management parameters, these statements are all bogus.
If you still think the results shown on the chart above are pretty good and you would like to join me with Traders Notebook, I want to make you a special offer today.
Pay for a 6-month subscription and get a 12-month subscription from us! That's right, 12-month subscription for only the 6-month subscription price!
Click here to purchase Traders Notebook 6-month subscription.
I think that’s a pretty good deal, isn’t it?
Wishing you all the best with your trading,
Andy Jordan
Editor for Traders Notebook which shows you Futures Trading Strategies in Spreads, Options, and Swing Trades. Learn step-by-step how to trade successfully.
© by Andy Jordan. Re-transmission or reproduction of any part of this material is strictly prohibited without the prior written consent of Trading Educators, Inc.
Traders Notebook Complete
Learn how to manage this trade by getting daily detailed trading instructions, click here!
6-Months FREE when you purchase a 6-Month Subscription!
© by Andy Jordan. Re-transmission or reproduction of any part of this material is strictly prohibited without the prior written consent of Trading Educators, Inc.
CHECK OUT PERFORMANCE SPREADS FOR TRADERS NOTEBOOK!

Traders Notebook Complete
Learn how to manage this trade by getting daily detailed trading instructions, click here!
Traders Notebook Complete
Learn how to manage this trade by getting daily detailed trading instructions, click here!
6-Months FREE when you purchase a 6-Month Subscription!

Professional Trader Marco Mayer
Educator for Forex, Futures and Systematic Trader
Creator of Ambush Trading Method, Ambush Signals, and Head of AlgoStrats.com
Trading Article: Manual Backtesting Pitfalls
If you don’t want to learn how to backtest automatically right now but still want to profit from backtesting, you got to do it manually. That’s how I started too many years ago. I still remember sitting there with printed charts and writing down trade results on a separate sheet of paper.
Now there are some pitfalls you better...read more.
Marco Mayer is an Educator for Forex, Futures and a Systematic Trader, so if you have questions, he wants to hear from you! This email address is being protected from spambots. You need JavaScript enabled to view it.
Check out Ambush Signals
LEARN ABOUT AMBUSH TRADING METHOD
© by Marco Mayer. Re-transmission or reproduction of any part of this material is strictly prohibited without the prior written consent of Trading Educators, Inc.
WE APPRECIATE YOUR TRUST IN US
THANK YOU FOR YOUR BUSINESS!
Check out our Blog!
To view previous published Chart Scan newsletters, please log in or click on "Join Us,"
shown above, to subscribe to our free "Members Only" section.
A WEALTH OF INFORMATION & EDUCATION:
Joe Ross-Trading Educators' popular free Chart Scan Newsletter has been published since 2004.
Note: Unless otherwise noted, all charts used in Chart Scan commentary were created
by using Genesis Financial Technologies' Trade Navigator (with permission).
Legal Notice and Copyright 2019 Disclaimer - Published by Trading Educators, Inc.
Chart Scan is a complimentary educational newsletter.
© by Trading Educators, Inc. Re-transmission or reproduction of any part of this material is strictly prohibited without prior written consent.
Edition 801 - November 8, 2019
Edition 801 - November 8, 2019

I would like to thank all the traders who found the value in our 800th Edition Newsletter special offers. Many new and returning traders reached out, sharing their trading stories which allowed me to keep encouraging each and every one of them. I want you to succeed as a trader and that is why I share my trading knowledge with you today. Now, let me share with you my next trading lesson, please read on. Happy trading, Master Trader - Joe Ross

Master Trader Joe Ross
Author, Trader, Trading Mentor, and Founder of Trading Educators, Inc.
Developer of Instant Income Guaranteed
Chart Scan with Commentary: Color Bias
In the past few years, I admit to liking to see my charts with colored bars: Red for a down bar and green for an up bar. However, when I really want to study a chart and do some chart reading, I switch to black bars on a white background. I want to avoid color bias.
I have many things against using candlestick charts, which I won’t go into here, but one of them is the fact that candles give color bias, even when they are black and white.
I want to make a fine point with regards to color. When you see a green bar or candle, your mind automatically thinks “up.” When you see a red bar or candle, your mind automatically thinks “down” (unless you happen to be in China, where red and green have the opposite meanings).
The graphic below will serve to show what I mean.
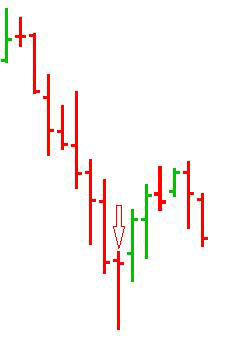
Prices had been coming down to the lowest low on the chart, which is correctly colored red…or is it? If you look closely at the bar you will see that momentum had actually changed. Prices opened near the close of the previous bar, and moved up the high. But at some time during the formation of that bar, momentum changed, and from the low of the bar up to the close, prices recovered, and actually closed close to where the bar opened.
This recovery by prices should have served as an alert that the next bar might very well be an up bar, which is actually what took place. In other words, the upward momentum from a supposedly down bar was continued on the very next bar. The color of the bar that made the low placed a mental bias in favor of further downward movement, whereas the relationship of the close to the low signaled a change to upward momentum.
© by Joe Ross. Re-transmission or reproduction of any part of this material is strictly prohibited without the prior written consent of Trading Educators, Inc.

Master Trader Joe Ross
Author, Trader, Trading Mentor, and Founder of Trading Educators, Inc.
Developer of Instant Income Guaranteed
Trading Article: False Consensus Part 2
Jim own a Hog farm. He produces 1,000 hogs per month to take to market, so he runs a fair-sized hog operation. Jim grows corn and soybeans for feed. He grinds his own beans into meal, and has silos for storage of both the corn and the beans.
In years where the crop of the best quality, Jim stores...read more.
© by Joe Ross. Re-transmission or reproduction of any part of this material is strictly prohibited without the prior written consent of Trading Educators, Inc.

Philippe Guartier: Administration and
New Developments of Instant Income Guaranteed
Trading Idea: Instant Income Guaranteed
CF Trade
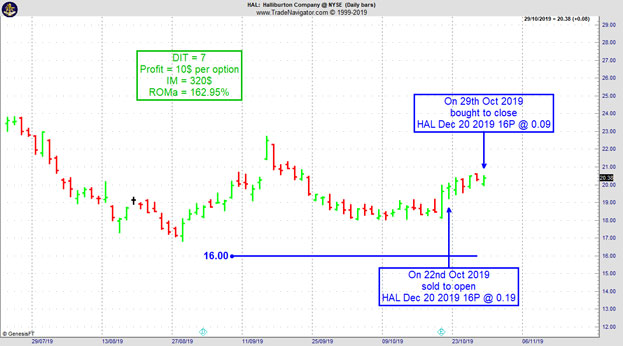
- On 22nd October 2019, we sold to open HAL Dec 20 2019 16P @ 0.19, with 58 days until expiration and our short strike about 18% below price action.
- On 29th October 2019, we bought to close HAL Dec 20 2019 16P @ 0.09, after 7 days in the trade
Philippe
Receive daily trade recommendations - we do the research for you.
♦ SIGN UP TODAY! WEALTH BUILDING FOR YOUR FUTURE ♦
Learn More!
Instant Income Guaranteed
30% Savings using coupon code: iig30
PERFORMANCE RECORD
SEPTEMBER 2019 TO MAY 2014
INSTANT INCOME GUARANTEED
Need more information? We want to hear from you.
Email questions to This email address is being protected from spambots. You need JavaScript enabled to view it.
30% Savings using coupon code: iig30


© by Joe Ross and Philippe Gautier. Re-transmission or reproduction of any part of this material is strictly prohibited without the prior written consent of Trading Educators, Inc.
BECOME A PART OF OUR TRADING TEAM
JOIN TODAY
INSTANT INCOME GUARANTEED

Professional Trader Andy Jordan
Educator for Spreads, Options, Swing, Day Trading, and
Editor of Traders Notebook Complete
Trading Article: Golden Rules by Paul Tudor Jones
During the next few weeks, I want to have a look into the “golden rules” of famous traders with the idea, to find something they all have in common.
I am starting with Paul Tudor Jones. Here, what I found in Wikipedia about him:
Paul Tudor Jones II (born September 28, 1954) is an American investor, hedge fund manager, and philanthropist. In 1980, he founded....read more.
Andy Jordan is the editor for Traders Notebook which shows you Futures Trading Strategies in Spreads, Options, and Swing Trades. Learn step-by-step how to trade successfully.
Traders Notebook Complete
Learn how to manage this trade by getting daily detailed trading instructions, click here!
6-Months FREE when you purchase a 6-Month Subscription!
© by Andy Jordan. Re-transmission or reproduction of any part of this material is strictly prohibited without the prior written consent of Trading Educators, Inc.
CHECK OUT PERFORMANCE SPREADS FOR TRADERS NOTEBOOK!

Traders Notebook Complete
Learn how to manage this trade by getting daily detailed trading instructions, click here!

Professional Trader Andy Jordan
Educator for Spreads, Options, Swing, Day Trading, and
Editor of Traders Notebook Complete
Traders Notebook: How to Read a P&L Chart
Let's look at the P&L chart of all spread trade recommendations in Traders Notebook since January 2019. I would like to discuss a few things a trader should always check to see if a trading method or a specific way of trading makes sense. As we can see on the (hypothetical) P&L chart from below, the profit reached almost $15k:
- What does “$15k” mean?
- What was the risk?
- What about the draw-downs?
- Were there enough trades to see the results are statistically significant?

Let’s go through it, step-by-step:
A result of about $15k is kind of meaningless, as long as we don’t know how much money we need so we can get to this result. This is usually the point, where a good marketing specialist will look up how much margin was used to cover the trades and then he will probably tell you the following: “You could have reached that result with an account size of about $15k, Andy. As you can see, this means a return of about 100%! Isn’t that awesome?” But wait a minute. After the trades are done, it is always easy to calculate the optimized values to present huge profits. But what would have happened if there were more losing trades in a row? Well, easy answer: You would have been out of business! So, let’s have a look at the chart by ourselves and forget about the marketing guy. As we can see, the largest draw-down happened around trade 31 of about $5k. Is there a way we can have a few of these draw-downs in a row? Yes, of course. To be on the save side, we better look at the largest draw-down and we multiply this value a couple of times so we can resist even larger draw-down periods. How often we multiply the draw-down is of course up to each trader, but I would use at least 3 to 4 times the largest draw-down ($15k - $20k). Therefore, an account size of about $30k to $40k or even better $50k make much more sense to reach these results. And if we use for example an account size of $50k for our calculation, our profit is down to about 30%, which is by the way still pretty good in the world of “real trading” and not “marketing trading”.
Of course, you can take the trades also with a smaller account, let’s say with only $25k, but then you should also reduce your profit expectation, just to be not too disappointed after one year of trading. Especially beginning traders get disappointed when they make “only” 20% or 30% a year because they have statements like “I made 1 million out of $10,000 in just one year” in mind. But I can tell you, using good risk and money management parameters, these statements are all bogus.
If you still think the results shown on the chart above are pretty good and you would like to join me with Traders Notebook, I want to make you a special offer today.
Pay for a 6-month subscription and get a 12-month subscription from us! That's right, 12-month subscription for only the 6-month subscription price!
Click here to purchase Traders Notebook 6-month subscription.
I think that’s a pretty good deal, isn’t it?
Wishing you all the best with your trading,
Andy Jordan
Editor for Traders Notebook which shows you Futures Trading Strategies in Spreads, Options, and Swing Trades. Learn step-by-step how to trade successfully.
© by Andy Jordan. Re-transmission or reproduction of any part of this material is strictly prohibited without the prior written consent of Trading Educators, Inc.

Professional Trader Marco Mayer
Educator for Forex, Futures and Systematic Trader
Creator of Ambush Trading Method, Ambush Signals, and Head of AlgoStrats.com
Trading Article: Manual Backtesting Pitfalls
If you don’t want to learn how to backtest automatically right now but still want to profit from backtesting, you got to do it manually. That’s how I started too many years ago. I still remember sitting there with printed charts and writing down trade results on a separate sheet of paper.
Now there are some pitfalls you better...read more.
Marco Mayer is an Educator for Forex, Futures and a Systematic Trader, so if you have questions, he wants to hear from you! This email address is being protected from spambots. You need JavaScript enabled to view it.
Check out Ambush Signals
LEARN ABOUT AMBUSH TRADING METHOD
© by Marco Mayer. Re-transmission or reproduction of any part of this material is strictly prohibited without the prior written consent of Trading Educators, Inc.
WE APPRECIATE YOUR TRUST IN US
THANK YOU FOR YOUR BUSINESS!
Check out our Blog!
To view previous published Chart Scan newsletters, please log in or click on "Join Us,"
shown above, to subscribe to our free "Members Only" section.
A WEALTH OF INFORMATION & EDUCATION:
Joe Ross-Trading Educators' popular free Chart Scan Newsletter has been published since 2004.
Note: Unless otherwise noted, all charts used in Chart Scan commentary were created
by using Genesis Financial Technologies' Trade Navigator (with permission).
Legal Notice and Copyright 2019 Disclaimer - Published by Trading Educators, Inc.
Chart Scan is a complimentary educational newsletter.
© by Trading Educators, Inc. Re-transmission or reproduction of any part of this material is strictly prohibited without prior written consent.
Edition 800 - November 1, 2019
Edition 800 - November 1, 2019

This is our 800th Edition Newsletter!
Master Trader Joe Ross won't extend this offer to just any trader!
Our 800th Anniversay Edition will be a special one!
OUR FIRST 8 TRADERS WILL RECEIVE
30% OFF JOE ROSS' PRIVATE MENTORING!!
SIGN UP TODAY!
Yes, I want 30% Off Joe Ross' Private Mentoring Services!
Use Coupon Code after we send you the payment link: 30=800
BUT FIRST!
Click below and complete Joe Ross' Private Mentoring submission form:
https://tradingeducators.com/contact-form-joe
LEARN MORE ABOUT MASTER TRADER JOE ROSS' PRIVATE MENTORING SERVICES, CLICK HERE:
https://tradingeducators.com/private-mentoring/joe-ross
OUR 80% OFF COUPON HAS EXPIRED : (
BUT!
YOU CAN STILL ENJOY A NICE DISCOUNT
40% OFF Recorded Webinars and eBooks!
Use coupon code during checkout: thanks40
HURRY! THIS DISCOUNT WILL EXPIRE SOON!

Master Trader Joe Ross
Author, Trader, Trading Mentor, and Founder of Trading Educators, Inc.
Developer of Instant Income Guaranteed
Chart Scan with Commentary: Price Insurance
There is more than one way to think about selling put options. If you are strictly an option trader, you look at selling puts as a way to make money if prices remain sideways, or move up. You are a speculator. As a speculator, you might look at put selling as part of an overall option strategy involving one or more other options.
A person buying a put option can be either an investor or a speculator. As an investor, you want insurance against falling prices of the underlying you own. As a speculator you are hoping to profit from the premium earned if the put fails to reach the strike price of the put by the time the option expires.
At Trading Educators, we view selling puts as being in the insurance business. Insurance companies succeed to the extent that they are good underwriters of risk. With our Instant Income Guaranteed program (IIG), we strive to be excellent underwriters. We view the person buying the put as he/she getting what they want—either insurance, or as a way to speculate on falling prices. By selling puts, we give them what they want. So it is a win-win situation. Both buyer and seller are getting what they want.
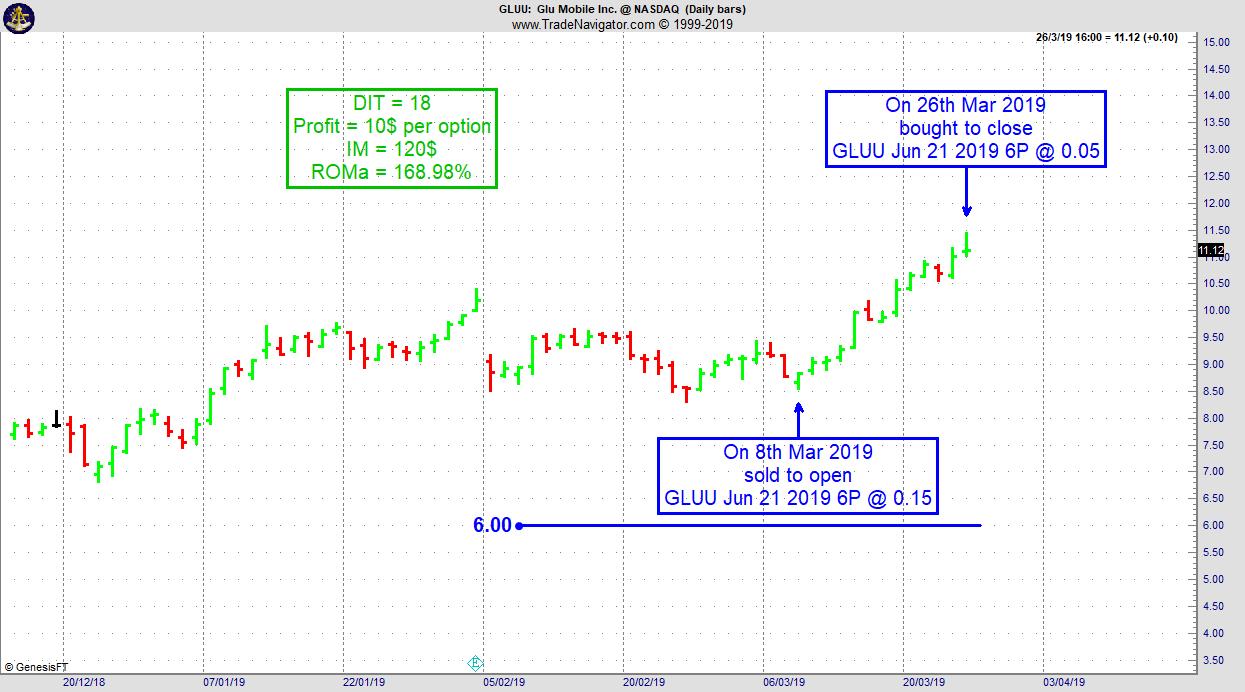
Following is a recent IIG trade. We were in the trade 18 days. Our annualized return on margin of $120 was 168.98%. If you’re tired of the losses you take trading with other methods, give IIG a try.
© by Joe Ross. Re-transmission or reproduction of any part of this material is strictly prohibited without the prior written consent of Trading Educators, Inc.

Master Trader Joe Ross
Author, Trader, Trading Mentor, and Founder of Trading Educators, Inc.
Developer of Instant Income Guaranteed
Trading Article: False Consensus Part 1
Traders and investors try to understand their world. They make hypotheses and test them. Rather than conducting formal...read more.
© by Joe Ross. Re-transmission or reproduction of any part of this material is strictly prohibited without the prior written consent of Trading Educators, Inc.

Philippe Guartier: Administration and
New Developments of Instant Income Guaranteed
Trading Idea: Instant Income Guaranteed
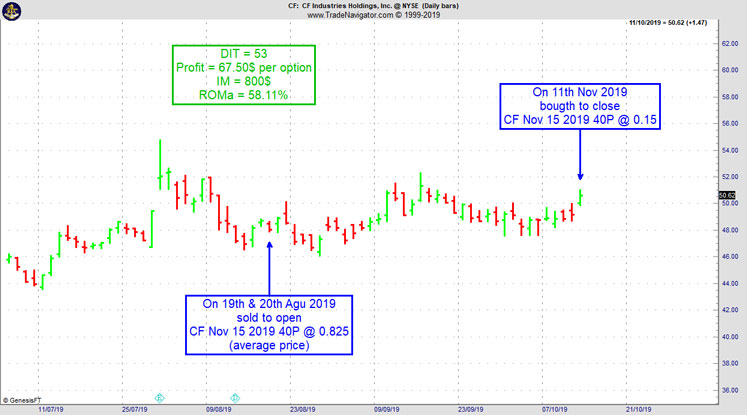
CF Trade
- On 19th and 20th August 2019, we sold to open CF Nov 15 2019 40P @ 0.825, with 86 days until expiration and our short strike about 17% below price action.
- On 11th October 2019, we bought to close CF Nov 15 2019 40P @ 0.15, after 53 days in the trade.
Philippe
30% Savings using coupon code: iig30
Receive daily trade recommendations - we do the research for you.
♦ SIGN UP TODAY! WEALTH BUILDING FOR YOUR FUTURE ♦
Learn More!
Instant Income Guaranteed
30% Savings using coupon code: iig30
PERFORMANCE RECORD
SEPTEMBER 2019 TO MAY 2014
INSTANT INCOME GUARANTEED
Need more information? We want to hear from you.
Email questions to This email address is being protected from spambots. You need JavaScript enabled to view it.
30% Savings using coupon code: iig30


30% Savings using coupon code: iig30
© by Joe Ross and Philippe Gautier. Re-transmission or reproduction of any part of this material is strictly prohibited without the prior written consent of Trading Educators, Inc.
BECOME A PART OF OUR TRADING TEAM
JOIN TODAY
INSTANT INCOME GUARANTEED

Professional Trader Andy Jordan
Educator for Spreads, Options, Swing, Day Trading, and
Editor of Traders Notebook Complete
Trading Article: Self Control
To become a truly successful trader you must become a truly committed trader. How do you get yourself to be in control?
Statistics and society may predict, but you alone....read more.
Andy Jordan is the editor for Traders Notebook which shows you Futures Trading Strategies in Spreads, Options, and Swing Trades. Learn step-by-step how to trade successfully.
Traders Notebook Complete
Learn how to manage this trade by getting daily detailed trading instructions, click here!
6-Months FREE when you purchase a 6-Month Subscription!
© by Andy Jordan. Re-transmission or reproduction of any part of this material is strictly prohibited without the prior written consent of Trading Educators, Inc.
CHECK OUT PERFORMANCE SPREADS FOR TRADERS NOTEBOOK!

Traders Notebook Complete
Learn how to manage this trade by getting daily detailed trading instructions, click here!

Professional Trader Andy Jordan
Educator for Spreads, Options, Swing, Day Trading, and
Editor of Traders Notebook Complete
Traders Notebook: How to Read a P&L Chart
Let's look at the P&L chart of all spread trade recommendations in Traders Notebook since January 2019. I would like to discuss a few things a trader should always check to see if a trading method or a specific way of trading makes sense. As we can see on the (hypothetical) P&L chart from below, the profit reached almost $15k:
- What does “$15k” mean?
- What was the risk?
- What about the draw-downs?
- Were there enough trades to see the results are statistically significant?

Let’s go through it, step-by-step:
A result of about $15k is kind of meaningless, as long as we don’t know how much money we need so we can get to this result. This is usually the point, where a good marketing specialist will look up how much margin was used to cover the trades and then he will probably tell you the following: “You could have reached that result with an account size of about $15k, Andy. As you can see, this means a return of about 100%! Isn’t that awesome?” But wait a minute. After the trades are done, it is always easy to calculate the optimized values to present huge profits. But what would have happened if there were more losing trades in a row? Well, easy answer: You would have been out of business! So, let’s have a look at the chart by ourselves and forget about the marketing guy. As we can see, the largest draw-down happened around trade 31 of about $5k. Is there a way we can have a few of these draw-downs in a row? Yes, of course. To be on the save side, we better look at the largest draw-down and we multiply this value a couple of times so we can resist even larger draw-down periods. How often we multiply the draw-down is of course up to each trader, but I would use at least 3 to 4 times the largest draw-down ($15k - $20k). Therefore, an account size of about $30k to $40k or even better $50k make much more sense to reach these results. And if we use for example an account size of $50k for our calculation, our profit is down to about 30%, which is by the way still pretty good in the world of “real trading” and not “marketing trading”.
Of course, you can take the trades also with a smaller account, let’s say with only $25k, but then you should also reduce your profit expectation, just to be not too disappointed after one year of trading. Especially beginning traders get disappointed when they make “only” 20% or 30% a year because they have statements like “I made 1 million out of $10,000 in just one year” in mind. But I can tell you, using good risk and money management parameters, these statements are all bogus.
If you still think the results shown on the chart above are pretty good and you would like to join me with Traders Notebook, I want to make you a special offer today.
Pay for a 6-month subscription and get a 12-month subscription from us! That's right, 12-month subscription for only the 6-month subscription price!
Click here to purchase Traders Notebook 6-month subscription.
I think that’s a pretty good deal, isn’t it?
Wishing you all the best with your trading,
Andy Jordan
Editor for Traders Notebook which shows you Futures Trading Strategies in Spreads, Options, and Swing Trades. Learn step-by-step how to trade successfully.
© by Andy Jordan. Re-transmission or reproduction of any part of this material is strictly prohibited without the prior written consent of Trading Educators, Inc.

Professional Trader Marco Mayer
Educator for Forex, Futures and Systematic Trader
Creator of Ambush Trading Method, Ambush Signals, and Head of AlgoStrats.com
Trading Article: Manual Backtesting Pitfalls
If you don’t want to learn how to backtest automatically right now but still want to profit from backtesting, you got to do it manually. That’s how I started too many years ago. I still remember sitting there with printed charts and writing down trade results on a separate sheet of paper.
Now there are some pitfalls you better...read more.
Marco Mayer is an Educator for Forex, Futures and a Systematic Trader, so if you have questions, he wants to hear from you! This email address is being protected from spambots. You need JavaScript enabled to view it.
Check out Ambush Signals
LEARN ABOUT AMBUSH TRADING METHOD
© by Marco Mayer. Re-transmission or reproduction of any part of this material is strictly prohibited without the prior written consent of Trading Educators, Inc.
CHECK OUT PERFORMANCE SPREADS FOR TRADERS NOTEBOOK!

WE APPRECIATE YOUR TRUST IN US
THANK YOU FOR YOUR BUSINESS!
Check out our Blog!
To view previous published Chart Scan newsletters, please log in or click on "Join Us,"
shown above, to subscribe to our free "Members Only" section.
A WEALTH OF INFORMATION & EDUCATION:
Joe Ross-Trading Educators' popular free Chart Scan Newsletter has been published since 2004.
Note: Unless otherwise noted, all charts used in Chart Scan commentary were created
by using Genesis Financial Technologies' Trade Navigator (with permission).
Legal Notice and Copyright 2019 Disclaimer - Published by Trading Educators, Inc.
Chart Scan is a complimentary educational newsletter.


