

Joe Ross
Edition 702 - November 24, 2017
Edition 702 - November 24, 2017

We hope you had a wonderful Thanksgiving
celebration with your family and friends!
ENDS SOON!
30% Off All Products and Services
Coupon Code
stuffed30
Use during checkout expires midnight U.S. Central time on November 26, 2017

Chart Scan with Commentary - Consolidation Part 8
by Master Trader Joe Ross
Author, Trader, Trading Mentor, and Founder of Trading Educators, Inc.
Developer of Instant Income Guaranteed
We have been taking this series one step at a time. I have drawn the trading envelope at the earliest possible time — the time I was first able to identify congestion (11-20 bars). Prices had entered the upper trading zone between the congestion high and the .146 inner zone (dash-dot green line). The entry was on the 8th bar from the left including the measuring bar.
Once prices entered that zone, I was looking to go short 1 tick below the inner zone line. Assuming I was trading 10 contracts, and because I could afford it, I placed my initial stop loss 1 tick above the congestion high. My objective was to liquidate 7 contracts at the midpoint line (red line). If prices would reach the midpoint line, I would move the protective stop on 1 contract to break even and the protective stop on 2 contracts to protect 50% of my profits. As you can see from the chart, I was filled as prices exited the inner zone. Two bars later I was filled at the midpoint line. On the last bar on the chart you can see that my 50% stop was hit.
Because the bar that hit my 50% stop was a reversal bar, I moved my breakeven stop to 1 tick above the high of the last bar on the chart. The following day (not shown) I was stopped out there. I was paid to trade on all parts of my position. That’s all I ever ask of a market.

© by Joe Ross. Re-transmission or reproduction of any part of this material is strictly prohibited without the prior written consent of Trading Educators, Inc.
ENDS SOON!
30% Off All Products and Services
Coupon Code
stuffed30
Use during checkout expires midnight U.S. Central time on November 26, 2017
Trading Article - Fitting it all together Part 4 - Market Spillover
by Master Trader Joe Ross
Author, Trader, Trading Mentor, and Founder of Trading Educators, Inc.
Developer of Instant Income Guaranteed
Markets can and do spillover from one to the other. We saw this back in 2007, and we can now see how dangerously close we were then and are now to a melt-down.
Until early in 2007, I had never heard of US subprime lending. On hearing the detail, it left me with a sense of wonderment.
“You mean, the borrower lies about his income (no job, no income, no hope) and the lender offers exceptionally low 'teaser' interest rates, with the proviso of these going up by half (!) within two years, and nobody screamed?”
And then they took such loans, bundled them with better loans, sliced and spliced the end result like so much rope, got rating agencies to apply the last rites, and sold them on to unsuspecting institutions looking for yield enhancement (a little extra margin, magnified sixteen times by leveraging, so that anything small really started to look impressively large)!
And that house of cards was supposed to remain intact?
If you had never tasted snake-oil before, this was your golden opportunity. About a $1 trillion of the stuff was written, first Fed estimates were that $100bn would go bad, but add the misadventure of any misguided leveraging, and the final bill would be about $250bn.
That would have sunk the US banking system. But because banks securitized and offloaded the stuff faster than they generated it, relatively little stuck to banks, except to the extent that their asset management funds invested in such stuff.
Anyway, the $250bn was spread around the world, at least 10% in Japan, a goodly portion in Europe and a fair amount in lower Manhattan. The losses would rest where they fell. Rest in peace.
Meanwhile, financial markets in their entirety couldn't quite figure where all the bodies were buried. A few hedge funds owed up (and folded). A few banks wrote off early and got mostly ignored. A few latecomers owed up and got clobbered. But by then the greater universe was on a witch hunt, while pulling away from leveraged corporate debt as well.
Banks became wary of counterparty banks. “Are you still good?
A rush for Treasury bonds ensued, sinking such bond yields. A flight to safety was in progress.
On 10 August it got so bad that European money market rates no longer reflected central bank targeted rates. Trust was out of the window and the willingness to deal getting thin indeed. Liquidity was drying up. The ECB, faced with banks being unable to get funds, injected $130bn, followed shortly by Fed and BoJ.
Another week and US credit markets generally seized up, with heavy spillover into equity markets, as uncertainty bit and induced risk aversion, good assets were sold to cover bad credit losses, and basically everyone lost their nerve.
Even Japanese housewives reversed positions, dumping Aussie and Kiwi and causing the Japanese Yen to shoot through the roof as the carry-trade got liquidated.
Not a moment too soon the Fed finally capitulated, but not in the usual way. The unusual twist was to lower only the discount rate by 0.5%, halving the penalty the banks pay to go into the central bank to cover their liquidity needs.
Would it be enough? If liquidity didn't improve, with massive volatility marking most markets as investors tried to re-establish value where anarchy ruled, the Fed at some point had to capitulate for real and go the whole hog, even lowering fed funds rate once, twice or even three times by 0.25%.
It proved to be an interesting year. Instead of being floored by bird flu, or getting fallout from US nuking of Iranian nuclear facilities, the world got old-fashioned credit failure, coupled to stress-testing leveraged universes.
Are we due for another such cleansing?
© by Joe Ross. Re-transmission or reproduction of any part of this material is strictly prohibited without the prior written consent of Trading Educators, Inc.
ENDS SOON!
30% Off All Products and Services
Coupon Code
stuffed30
Use during checkout expires midnight U.S. Central time on November 26, 2017

Instant Income Guaranteed - GDXJ Trade
Philippe Gautier: Administration and New Developments
Developer: Joe Ross
On 25th September 2017 we gave our Instant Income Guaranteed subscribers the following trade on Market Vectors Junior Gold Min (GDXJ). We sold price insurance as follows:
- On 26th September 2017, we sold to open GDXJ Nov 17 2017 30P @ 0.27$, with 51 days until expiration and our short strike about 14% below price action.
- On 9th October 2017, we bought to close GDXJ Nov 17 2017 30P @ 0.10$, after 13 days in the trade for quick premium compounding.
Profit: 17$ per option
Margin: 600$
Return on Margin annualized: 79.55%
Philippe

Receive daily trade recommendations - we do the research for you!
♦ SIGN UP TODAY! THIS IS WORTH THE INVESTMENT ♦
© by Joe Ross and Philippe Gautier. Re-transmission or reproduction of any part of this material is strictly prohibited without the prior written consent of Trading Educators, Inc.
ENDS SOON!
30% Off All Products and Services
Coupon Code
stuffed30
Use during checkout expires midnight U.S. Central time on November 26, 2017

Trading Article - Time Stop
by Professional Trader Andy Jordan
Educator for Spreads, Options, Swing/Day Trading, and
Editor of Traders Notebook Complete and Traders Notebook Outrights
If it was easy to win at trading, there would be more millionaires. The techniques for trading are simple. The age-old question is how to balance patience, wisdom, and prudent care against going for the grand slam.
In trading, pulling the trigger on when to trade equally important as all the preparation and attention to detail that went before. In other words, timing is everything when it comes to entering the trade. If a trade does not do well at the start, the trader must be disciplined and have ready a variety of alternate courses of action. As long as the circumstances for making the trade are still in effect, the trader can stay with the position. However, I believe in using a time stop. A time stop says, “I will exit the trade within a set amount of time even if the circumstances for making it are still in effect.” In the way I trade, success depends on prices quickly moving my way. If they fail to move my way, I know that my timing was off and I exit. Sometimes I have made a little and sometimes I lose a little. Overall, I do a little less than break even on the trades that time out. If circumstances are still the same, I look for a better time to get into the trade. My point is this: If my timing was off, I was wrong. When I’m wrong, I get out.
© by Andy Jordan. Re-transmission or reproduction of any part of this material is strictly prohibited without the prior written consent of Trading Educators, Inc.
ENDS SOON!
30% Off All Products and Services
Coupon Code
stuffed30
Use during checkout expires midnight U.S. Central time on November 26, 2017
 Trading Video - Trend Following Is Not Yet Dead: Part I
by Professional Trader Marco Mayer
Educator for Forex and Futures, Systematic Trader, and
Creator of Ambush Trading Method, Ambush Signals, and AlgoStrats.com
In this video, Marco gives you some insights on his journey into the world of traditional trend following. He talks about how trend following works, what to consider, and if it's a trading style for the average trader to consider. This is Part 1 of a 2-Part series. In his Part II, Marco will go into the details of his backtests.
Feel free to email Marco Mayer with any questions, This email address is being protected from spambots. You need JavaScript enabled to view it..
© by Marco Mayer. Re-transmission or reproduction of any part of this material is strictly prohibited without the prior written consent of Trading Educators, Inc.
ENDS SOON!
30% Off All Products and Services
Coupon Code
stuffed30
Use during checkout expires midnight U.S. Central time on November 26, 2017
Check out our Blog!
To view previous published Chart Scan newsletters, please log in or click on "Join Us,"
shown above, to subscribe to our free "Members Only" section.
A WEALTH OF INFORMATION & EDUCATION:
Joe Ross-Trading Educators' popular free Chart Scan Newsletter has been published since 2004.
Note: Unless otherwise noted, all charts used in Chart Scan commentary were created
by using Genesis Financial Technologies' Trade Navigator (with permission).
Legal Notice and Copyright 2017 Disclaimer - Published by Trading Educators, Inc.
Chart Scan is a complimentary educational newsletter.
© by Trading Educators, Inc. Re-transmission or reproduction of any part of this material is strictly prohibited without prior written consent.
Edition 701 - November 17, 2017
Edition 701 - November 17, 2017
30% Off All Products and Services!
Coupon Code
stuffed30
Use during checkout expires midnight U.S. Central time on November 26, 2017
Chart Scan with Commentary - Consolidation Part 7
by Master Trader Joe Ross
Author, Trader, Trading Mentor, and Founder of Trading Educators, Inc.
Developer of Instant Income Guaranteed
Last week we completed the construction of a trading envelope in the 30-year Treasury Bond. The next step is to go back to find out the earliest time we could have constructed the envelope.
I submit that it must be once prices are seen to be in congestion (11-20 bars).
Looking at the chart we see that congestion could actually be defined as 10 bars, all having either Opens or Closes within the trading range of a single measuring bar, comprising a total of 11 bars. That, then, is the earliest point in time at which an envelope could have been constructed.

© by Joe Ross. Re-transmission or reproduction of any part of this material is strictly prohibited without the prior written consent of Trading Educators, Inc.
30% Off All Products and Services!
Coupon Code
stuffed30
Use during checkout expires midnight U.S. Central time on November 26, 2017
Trading Article - Fitting it all together Part 3
by Master Trader Joe Ross
Author, Trader, Trading Mentor, and Founder of Trading Educators, Inc.
Developer of Instant Income Guaranteed
When a trend begins, always question its durability.
Traders who are in the market for the greater wins are wise to incorporate, when possible, seasonal factors, fundamental factors, technical analysis, and chart analysis. Among those who do, some start with seasonal research and then draw on fundamental knowledge or technical and chart reading expertise to help measure risk and confirm or deny potential reward. Others start instead from a fundamental or technical perspective, and then analyze the seasonal path of least resistance. It’s also important to realize that seasonality is not always on time; seasonal factors can come early or late. The same thing is true of cycle turning points, they, too, can come early or late.
In this issue of Chart Scan, let’s think for a moment about the effects of interest rates. If the Federal Reserve is concerned that a heated economy is stimulating inflationary pressure, the FED will launch a series of rate increases designed to slow growth. The strategy may have its intended effect. But once the strategy begins, you can expect a series of rate increases. However, it would be insane to increase rates when the economy is deflationary. Increasing rates will only make things worse.
When a cooling economy eases pressure on interest rates, financial instruments typically rally. Therefore, a fundamental outlook may encourage tentative long positions in interest rate futures. A trader who first refers to seasonal research before making final trading decisions finds that interest rates tend to peak in April/May, and generally decline into the fourth quarter. What we have observed over the years is that futures all along the yield curve tend to begin trending higher in May/June, which impacts the September Treasury Bonds and moves them higher.
Because big money is most concerned with long-term survival and advantage, trends in interest rates are usually confirmed by two spread characteristics: instruments at the long end of the yield curve outperform the short end, and deferred contracts outperform nearby contracts. A tentatively bullish fundamental trader who considers spreads to be a low-risk alternative to an outright position might find opportunity in certain seasonal spreads. One that you might want to think about for the future is Long June of the following year and Short September of the current year in Eurodollars. There may still time to consider this spread, depending upon when you receive this issue of Chart Scan. You might also consider Long June two years ahead, and short September of next year.
© by Joe Ross. Re-transmission or reproduction of any part of this material is strictly prohibited without the prior written consent of Trading Educators, Inc.
30% Off All Products and Services!
Coupon Code
stuffed30
Use during checkout expires midnight U.S. Central time on November 26, 2017
Instant Income Guaranteed - SLCA Trade
Philippe Gautier: Administration and New Developments
Developer: Joe Ross
On 7th November 2017 we gave our Instant Income Guaranteed subscribers the following trade on U.S. Silica Holdings Inc. (SLCA). We sold price insurance as follows:
- On 8th November 2017, we sold to open SLCA Dec 15 2017 27P @ 0.25$, with 37 days until expiration and our short strike about 22% below price action.
- On 9th November 2017, we bought to close SLCA Dec 15 2017 27P @ 0.10$, after only 1 day in the trade for quick premium compounding.
Profit: 15$ per option
Margin: 540$
Return on Margin annualized: 1,013.89%
Return on Principal annualized: 202.78%
Philippe

Receive daily trade recommendations - we do the research for you!
♦ SIGN UP TODAY! THIS IS WORTH THE INVESTMENT ♦
© by Joe Ross and Philippe Gautier. Re-transmission or reproduction of any part of this material is strictly prohibited without the prior written consent of Trading Educators, Inc.
30% Off All Products and Services!
Coupon Code
stuffed30
Use during checkout expires midnight U.S. Central time on November 26, 2017
Trading Blog Post - Being in a Positive State of Mind
by Professional Trader Andy Jordan
Educator for Spreads, Options, Swing/Day Trading, and
Editor of Traders Notebook Complete and Traders Notebook Outrights
Find out which mood is the best choice when trading. Read more.
© by Andy Jordan. Re-transmission or reproduction of any part of this material is strictly prohibited without the prior written consent of Trading Educators, Inc.
30% Off All Products and Services!
Coupon Code
stuffed30
Use during checkout expires midnight U.S. Central time on November 26, 2017
Trading Article - Trade Managemnt: Locking in Windfall Profits
by Professional Trader Marco Mayer
Educator for Forex and Futures, Systematic Trader, and
Creator of Ambush Trading Method, Ambush Signals, and AlgoStrats.com
I have another real-world example of manual trade management for you this week.
It’s a day trade in GBP/USD I found myself in a couple of days ago. The GBP has been a really nice market to trade lately providing plenty of swings and volatility.
The plan was to get in at a price level where I expected buyers to come into the market around 1.3070, using a relatively tight stop of 20 pips. I had no clear profit target for the trade but wasn’t expecting more than a decent bounce. I also was aware that the market might run into trouble around 1.3120 so I knew I had to watch closer should it approach that level.
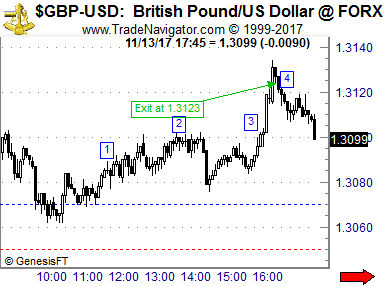
Here’s what happened. I got my fill at 1.3070 and shortly after the pound showed me that I wasn’t completely wrong with my idea. Once prices had moved to 1) (see chart) I moved the stop below the lowest low since I got in to 1.3060 to reduce the risk by 50%.
At 2) I was up quite nicely already and moved my stop just slightly below the entry price at to 1.3068. After that prices consolidated between 1.3080 and 90 for a while. Until at 3) prices started to move and exploded about 40 pips within minutes to the upside. This I hadn’t expected, probably some news hit the market.
Now 40 pips isn’t a totally crazy move but I had expected this to take hours so this has been a windfall profit at that point. What to do now? I’ve been up about 60 pips with an initial risk of 20 pips. That’s more than I had been looking for so I could have simply closed out the trade and take the profit. But as the pound was exploding in a parabolic way without any corrections why not just trail the stop really tight and see how far it goes?
That’s exactly what I did at 4) and so I got stopped out at about 1.3120 with a nice profit of 50 pips.
So one way to deal with windfall profits is to not get greedy and start locking them in more and more tight. The more parabolic the move gets, the more aggressive you might want to move your stop. Especially in the currency markets these moves don’t tend to carry on for too long.
Happy Trading!
Marco
Feel free to email Marco Mayer with any questions, This email address is being protected from spambots. You need JavaScript enabled to view it..
© by Marco Mayer. Re-transmission or reproduction of any part of this material is strictly prohibited without the prior written consent of Trading Educators, Inc.
30% Off All Products and Services!
Coupon Code
stuffed30
Use during checkout expires midnight U.S. Central time on November 26, 2017
Check out our Blog!
To view previous published Chart Scan newsletters, please log in or click on "Join Us,"
shown above, to subscribe to our free "Members Only" section.
A WEALTH OF INFORMATION & EDUCATION:
Joe Ross-Trading Educators' popular free Chart Scan Newsletter has been published since 2004.
Note: Unless otherwise noted, all charts used in Chart Scan commentary were created
by using Genesis Financial Technologies' Trade Navigator (with permission).
Legal Notice and Copyright 2017 Disclaimer - Published by Trading Educators, Inc.
Chart Scan is a complimentary educational newsletter.
© by Trading Educators, Inc. Re-transmission or reproduction of any part of this material is strictly prohibited without prior written consent.
Edition 700 - November 10, 2017
Edition 700 - November 10, 2017
Chart Scan with Commentary - Consolidation Part 6
by Master Trader Joe Ross
Author, Trader, Trading Mentor, and Founder of Trading Educators, Inc.
Developer of Instant Income Guaranteed
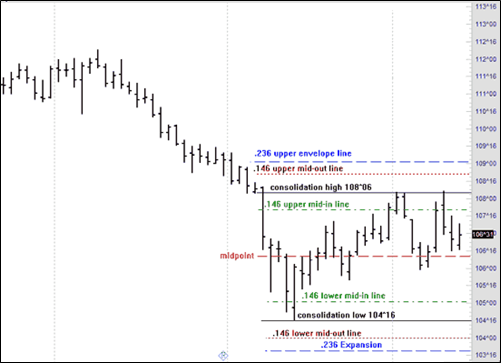
Last week I wrote that there were two ratios we would use to compute envelope lines. The second ratio is .146.
We previously discovered the height of the consolidation as being 3^22. We will now go through a similar procedure to we did last week, using the .146 ratio.
3^22 = 3*32+22 = 118
.146*118 = 17.228 = decimal height of the consolidation.
The high of the consolidation was 108^06.
Converting 108^06 to decimal:
108*32+6 = 3462
Next we add the ratio of .146 of the height to the high of the consolidation, but this time we take a second step as well. We will subtract the ratio of .146 of the height from the consolidation. This will give us two lines: one between the high of the consolidation and the upper envelope line called the “upper mid-out line,” and one between the upper envelope line and the lower envelope line, called the “upper mid-in line.”
3462+17.228 = 3479.228
Converting back to 32nds:
3479.228/32 = 108.725875
.725875*32 = 7 (rounded)
108^23 = upper mid-out line.
3462-17.228 = 3444.772
Converting back to 32nds:
3444.772/32 = 107.649125
.649125*32 = 21 (rounded)
107^21= upper mid-in line.
The lower mid-in line and the lower mid-out lines are computed as follows:
The low of the consolidation: 104^16.
Converting 104^16 to decimal:
104X32+16 = 3344
3344+17.228 = 3361.228
3361.228/32 = 105.038375
.038375*32 = 1 (rounded)
105^1 = lower mid-in line.
3344-17.228 = 3327.772
3327.772/32 = 103.992875 (rounded)
.9982875*32 = 32/32 = 1
To be continued...
© by Joe Ross. Re-transmission or reproduction of any part of this material is strictly prohibited without the prior written consent of Trading Educators, Inc.
Trading Article - Fitting it all together Part 2 (Economics 101 in a nutshell)
by Master Trader Joe Ross
Author, Trader, Trading Mentor, and Founder of Trading Educators, Inc.
Developer of Instant Income Guaranteed
We heard from a lot of you that you would like me to continue describing how markets are related. I will intersperse these kinds of tidbits with others. However, since so many asked, today's tidbit is along the lines of how markets relate to fundamentals.
After a breakout, look for a return. Successful returns can beget generous returns.
When a market does finally overcome resistance, penetrate a psychological barrier, or break out of a formation or consolidation, it tends to do so boldly at first. But after its initial thrust, it often needs reassurance. To reconfirm its freedom, it may even return to the very area from which it just broke its constraints.
When traders on the wrong side exit and new participants eagerly enter in the direction of the breakout, the return to retest succeeds in reenergizing, reinforcing, and resuming the new trend.
Futures traders must always expect the unexpected when least expected. Would you, for example, expect prices to be pressured by a surge in supply before a decline in consumption?
Let's look at some relationships in the soybean market.
Brazil harvests soybeans from February through May, during which crushing facilities run at capacity. Flush with new supplies for sale (most soybean oil is consumed domestically), the world's second largest exporter of soybean meal competes aggressively in the world market.
But soybean meal is a high-protein feed supplement for livestock. World consumption is greatest by far during the Northern Hemisphere's cold winter weather, when high caloric intake is required for animals to maintain and gain weight. Conversely, world consumption is lowest during July and August, when grass is available and the weather is hot.
So you might expect soybean meal prices to be especially weak during June, just after Brazil's harvest and just before the heat of the northern summer. But that is not so! Soybean meal has instead been the leader in the grains and soy complex.
Why is that the case? A seasonal transition appears to occur during June. As the surge in South American supplies begins to recede, the market turns back towards old-crop US supplies — perhaps stimulating some change in commercial ownership. U.S. soybean processors, who may have hedged soybean meal during Brazil's harvest in order to protect product prices and profit margins, may now begin covering short positions. Conversely, with low July/August consumption already discounted, the market begins to anticipate a rise in Northern Hemisphere demand — perhaps generating commercial buying.
Although product value within the soy complex has generally begun to favor soybean meal over soybean oil from as early as March, this sudden surge in soybean meal has been especially reflected in spreads between the two right around the middle of June. You might want to mark that on your trading calendar; it has been a high percentage spread trade for many years.
This strength in old-crop soybean meal is also reflected in spreads against new-crop soybean meal. As world demand returns to U.S. supplies, a new crop of soybeans is emerging to offer potentially plentiful new supplies late in the year. So, usually, the old-crop outperforms new-crop, often throughout the rest of the marketing year.
© by Joe Ross. Re-transmission or reproduction of any part of this material is strictly prohibited without the prior written consent of Trading Educators, Inc.
Instant Income Guaranteed - KR Trade
Philippe Gautier: Administration and New Developments
Developer: Joe Ross
On 29th October 2017 we gave our Instant Income Guaranteed subscribers the following trade on Kroger Company (KR). We sold price insurance as follows:
- On 30th October 2017, we sold to open KR Dec 01 2017 18P @ 0.20$, with 31 days until expiration and our short strike about 12% below price action.
- On 2nd November 2017, we bought to close KR Dec 01 2017 18P @ 0.10$, after only 3 days in the trade for quick premium compounding.
Profit: 10$ per option
Margin: 360$
Return on Margin annualized: 337.96%
We have also added new types of trades for our IIG daily guidance since 2016, "no loss" propositions with unlimited upside potential, still using other people's money to trade.
Philippe

Receive daily trade recommendations - we do the research for you!
♦ SIGN UP TODAY! THIS IS WORTH THE INVESTMENT ♦
© by Joe Ross and Philippe Gautier. Re-transmission or reproduction of any part of this material is strictly prohibited without the prior written consent of Trading Educators, Inc.
Trading Idea - Crude Light Calandar Spread
by Professional Trader Andy Jordan
Educator for Spreads, Options, Swing/Day Trading, and
Editor of Traders Notebook Complete and Traders Notebook Outrights
This week, we're looking at CLG18 – CLF18: long February 2018 and January 2018 Crude Oil (NYMEX on Globex).
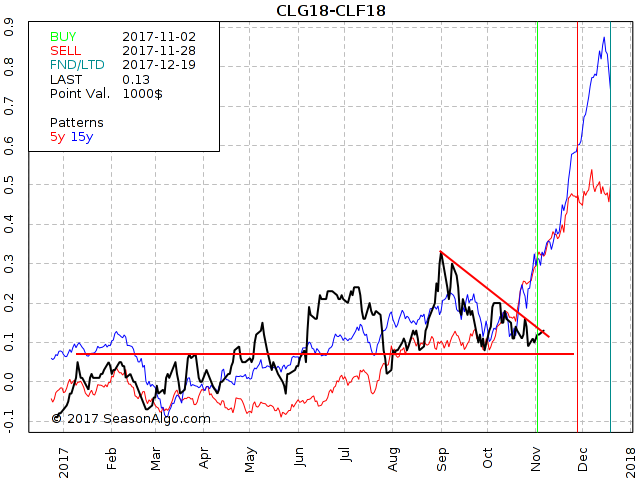
Today we consider a Crude Light calendar spread: long February 2018 and January 2018 Crude Oil (symbols on CQG for the January – February spread is CLES1F8). The spread has found support around 0.070 several times during the last few months. At the same level, the spread has run into resistance during the first few months of 2017. As long as the spread stays above break even, there is a good chance the spread will follow it seasonal tendency to the up-side for the next few weeks.
Do you want to see how we manage this trade and how to get detailed trading instructions every day?
Traders Notebook Complete
Please visit the following link:
Yes, I would like additional information!
© by Andy Jordan. Re-transmission or reproduction of any part of this material is strictly prohibited without the prior written consent of Trading Educators, Inc.
Trading Video - Questions and Answers
by Professional Trader Marco Mayer
Educator for Forex and Futures, Systematic Trader, and
Creator of Ambush Trading Method, Ambush Signals, and AlgoStrats.com
This is the first part of a series in which Marco answered oft asked trading questions. This episode includes bid/ask spread and discipline in trading
>
© by Marco Mayer. Re-transmission or reproduction of any part of this material is strictly prohibited without the prior written consent of Trading Educators, Inc.
Check out our Blog!
To view previous published Chart Scan newsletters, please log in or click on "Join Us,"
shown above, to subscribe to our free "Members Only" section.
A WEALTH OF INFORMATION & EDUCATION:
Joe Ross-Trading Educators' popular free Chart Scan Newsletter has been published since 2004.
Note: Unless otherwise noted, all charts used in Chart Scan commentary were created
by using Genesis Financial Technologies' Trade Navigator (with permission).
Legal Notice and Copyright 2017 Disclaimer - Published by Trading Educators, Inc.
Chart Scan is a complimentary educational newsletter.
© by Trading Educators, Inc. Re-transmission or reproduction of any part of this material is strictly prohibited without prior written consent.
Edition 699 - November 3, 2017
Edition 699 - November 3, 2017
Chart Scan with Commentary - Consolidation Part 5
by Master Trader Joe Ross
Author, Trader, Trading Mentor, and Founder of Trading Educators, Inc.
Developer of Instant Income Guaranteed
Continuing with the bond illustration to this point, the next step is to compute a couple of very interesting ratios. These ratios are ones I came across long before I ever heard of Gann or Fibonacci. If they turn out to be the same as the ratios of either of them, so be it. I know that I discovered them on my own, and have used them for many decades. They work amazingly well when trading inside consolidation. The ratios are used to create an envelope. The first ratio will be used to compute both upper and lower envelope values.
Last week we discovered that the height of the consolidation was 3^22. We must now take a ratio from the value of the height. The ratio is .236. To compute the ratio we will convert the height from 32nds to decimal.
3^22 = 3*32+22 = 118
.236*118 = 27.848
The high of the consolidation was 108^06.
Converting 108^06 to decimal:
108*32+6 = 3462
Next we add the ratio of .236 to the high of the consolidation to obtain a value for the upper envelope line:
3462+27.848 = 3489.848
Converting that back to 32nds:
3489.848/32 = 109.05774
.05774*32 = 2 (rounded)
The upper envelope line is placed at 109^2
We now have to obtain a value for the lower envelope.
The low of the consolidation was 104^16.
104*32+16 = 3344
Next we subtract the ratio of .236 from the low of the consolidation to obtain a value for the lower envelope line:
3344-27.848 = 3316.152
Converting back to 32nds:
3316.152/32 = 103.62975
.62975*32 = 20 (rounded)
The lower envelope line is placed at 103^20
Next week we will compute another ratio and add it to and subtract from both the high and the low of the consolidation.
At this point our chart looked like this:

To be continued...
© by Joe Ross. Re-transmission or reproduction of any part of this material is strictly prohibited without the prior written consent of Trading Educators, Inc.
Trading Article - Fitting it all together Part 1 (Economics 101 in a nutshell)
by Master Trader Joe Ross
Author, Trader, Trading Mentor, and Founder of Trading Educators, Inc.
Developer of Instant Income Guaranteed
Here is an encapsulated generalized view of markets and trading:
Try to develop an inter-market view of how futures markets correlate with one another. Cows are fed grain to fatten them up, so when grain prices rise, expect higher meat prices — ergo, be ready to trade meats from the long side.
If meat prices go up, then so should other food prices like cocoa and sugar for candy bars.
Orange juice, coffee, and pork belly bacon are served for breakfast with eggs, and wheat toast is buttered with (ugh) corn oil margarine. If corn prices rise, the demand for wheat will rise, and both wheat toast and corn oil margarine will rise in price. Lesson: favor grains to the long side.
Half-witted politicians think they are being ecologically responsive by pushing for ethanol, but all this does is push the price of corn higher, then the price of meat higher, and finally the price of a lot of other things higher. Why do I call the politicians half-wits? Because anyone with even the smallest amount of knowledge knows that all you can get from corn as an energy source is exactly what you put into it. One unit of energy in and one unit of energy out.
If the trend in gold and interest rates has been declining, deflation is prevalent. Be ready to trade bonds and notes from the long side.
The opposite trends apply to inflation. When the prices of gold and interest rates are rising, expect most commodities to follow that trend, except independent currencies and the stock market, which decline with rising rates.
Manufacturers increase profits two basic ways without the need for increased efficiency: by lowering labor and raw materials costs, or by raising prices.
When inflation is prevalent, higher raw material costs are passed on to higher finished product costs to maintain a fixed profit margin. The Producer Price Index, PPI, usually increases before the Consumer Price Index, CPI, does. Factory utilization over 85% is thought to forecast rising inflation as well.
© by Joe Ross. Re-transmission or reproduction of any part of this material is strictly prohibited without the prior written consent of Trading Educators, Inc.
Instant Income Guaranteed - LITE Trade
Philippe Gautier: Administration and New Developments
Developer: Joe Ross
On 19th September 2017 we gave our Instant Income Guaranteed subscribers the following trade on Lumentum Holdings Inc (LITE). We sold price insurance as follows:
- On 20th September 2017, we sold to open LITE Oct 20 2017 47P @ 0.45$, with 30 days until expiration and our short strike about 21% below price action.
- On 6th October 2017, we bought to close LITE Oct 20 2017 47P @ 0.10$, after 16 days in the trade for quick premium compounding.
Profit: $35 per option
Margin: $940
Return on Margin Annualized: 89.94%
We have also added new types of trades for our IIG daily guidance since 2016, "no loss" propositions with unlimited upside potential, still using other people's money to trade.
Philippe

Receive daily trade recommendations - we do the research for you!
♦ SIGN UP TODAY! THIS IS WORTH THE INVESTMENT ♦
© by Joe Ross and Philippe Gautier. Re-transmission or reproduction of any part of this material is strictly prohibited without the prior written consent of Trading Educators, Inc.
Trading Article - Protective Stops
by Professional Trader Andy Jordan
Educator for Spreads, Options, Swing/Day Trading, and
Editor of Traders Notebook Complete and Traders Notebook Outrights
Protective stops have to be related to the strategy and the markets being traded. It is not a good idea to use a $200 stop that might be appropriate on a corn contract in sugar or the soybean market. This is because each market has a different value and different volatility. Protective stops should be linked to the volatility and value of the underlying market.
It is also a major mistake to use a protective stop purely based on your account size and how much you are willing to lose. If you have a $10,000 account and you don't want to risk more than $500 on any given trade, but the stop in this particular market and trade is at $750, you DON'T take the trade. Risk management and money management are major parts of trading, and have to be implemented into your trading strategy.
© by Andy Jordan. Re-transmission or reproduction of any part of this material is strictly prohibited without the prior written consent of Trading Educators, Inc.
Trading Video - Why having a view on a market isn't enough
by Professional Trader Marco Mayer
Educator for Forex and Futures, Systematic Trader, and
Creator of Ambush Trading Method, Ambush Signals, and AlgoStrats.com
In this video, Marco talks about why having a view on the direction of a market isn't enough. The reason is that just having a directional view doesn't make a trade...find out why!
Happy trading,
Marco
Feel free to email Marco with any questions, This email address is being protected from spambots. You need JavaScript enabled to view it..
© by Marco Mayer. Re-transmission or reproduction of any part of this material is strictly prohibited without the prior written consent of Trading Educators, Inc.
Check out our Blog!
To view previous published Chart Scan newsletters, please log in or click on "Join Us,"
shown above, to subscribe to our free "Members Only" section.
A WEALTH OF INFORMATION & EDUCATION:
Joe Ross-Trading Educators' popular free Chart Scan Newsletter has been published since 2004.
Note: Unless otherwise noted, all charts used in Chart Scan commentary were created
by using Genesis Financial Technologies' Trade Navigator (with permission).
Legal Notice and Copyright 2017 Disclaimer - Published by Trading Educators, Inc.
Chart Scan is a complimentary educational newsletter.
© by Trading Educators, Inc. Re-transmission or reproduction of any part of this material is strictly prohibited without prior written consent.
Edition 698 - October 27, 2017
Edition 698 - October 27, 2017
Trading Article - Don’t be stubborn in trading!
by Professional Trader Marco Mayer
Educator for Forex and Futures, Systematic Trader, and
Creator of Ambush Trading Method, Ambush Signals, and AlgoStrats.com
I recently found myself in a day trade in USD/CAD that I’d like to talk about. The exact reason for my entry actually doesn't matter for this article but the idea was to buy the pair at a support level where I expected it to at least temporarily bounce off nicely. The best case outcome for this trade was that it would hit my profit target that I had set shortly after the entry. It would give me a nice profit of more than two times my risk and I set it at a price where I was expecting the potential rally to run into sellers again.
For sure I’ve been lucky with this one as shortly after the entry the market rallied nicely straight up for hours without any significant corrections. So the next morning (entry happened during the night) I was pleasantly surprised that USD/CAD was already approaching my profit target, see below on the first chart the market looked like at that point in time.

USD/CAD was just about 7 pips short of reaching my profit target while my stop-loss was still at the initial stop loss level. I think I’ve read a similar story in one of the market wizards books, but in a summary, the situation was like this. The market was trading very close to my profit target that I had set because I expected sellers around that price level. At the same time, the trade could still turn into a full loss as I hadn’t moved my stop loss.
So, in other words, the potential for further profits was just about 7 pips while my risk was about 53 pips! That’s when you simply cannot be stubborn in a discretionary trade, you got to act!
As this had been such a nice, stress-free rally to that point and I’ve been already so close to the profit target I decided to simply take my money and run. I just got out at the market.
If the profit target had been slightly further away I might have chosen another option. Go down to a lower timeframe and use a tight trailing stop to either get stopped out with a nice profit or have the market run into the profit target.
On the right chart, you can see what happened after that. The rally fizzled and USD/CAD plummeted. So don’t be stubborn in trading!
Happy trading,
Marco
Feel free to email Marco with any questions, This email address is being protected from spambots. You need JavaScript enabled to view it..
© by Marco Mayer. Re-transmission or reproduction of any part of this material is strictly prohibited without the prior written consent of Trading Educators, Inc.
Chart Scan with Commentary - Consolidation Part 4
by Master Trader Joe Ross
Author, Trader, Trading Mentor, and Founder of Trading Educators, Inc.
Developer of Instant Income Guaranteed
In this issue of Chart Scan and in the next, I will be showing you a couple of confirming ways to trade sideways markets. I think you’ll find them interesting.
First, we must have a rule. We can trade in a consolidation only if the height of the consolidation is equal to or greater in dollars than the exchange minimum margin for entering the trade, or the exchange maintenance margin for holding overnight, at the time we realize the market has entered into the consolidation. The choice is yours.
As with all rules, there are exceptions. If a market has great volatility, we can use 1/2 the exchange minimum margin, or 1/2 the maintenance margin. Again, the choice is yours.
My example for this study is the seen on the daily T-Bond chart below. It could have been any market. A market is the market, and a chart is a chart. I'll be switching between two programs because I need to utilize two different studies. Unfortunately, I do not have them both in the same software.
The margin for the T-Bond was $1,620 and the maintenance margin was $1,200. The high of the consolidation was 108^06 and the low was 104^16, for a height of 3^22, which is equal to $3,687.50 — more than enough to meet our rule. In fact, the height was more than enough to meet our rule for great volatility: 1/2 the exchange minimum margin.
Let's get a bird’s eye view of how the bonds dropped into a consolidation area.

Next week we will do some measuring and draw some definitive lines on this chart. For now, let’s see where we can begin counting the consolidation so far.
We must ask: “which bar or Close of which bar most represents the vertical center of the consolidation?”
108 6/32 – 104 16/32 = 3 22/32
Divided by 2 = 1 27/32
1 27/32 + 104 16/32 = 106 11/32
The halfway mark of the consolidation is 106^11.
To be continued...
© by Joe Ross. Re-transmission or reproduction of any part of this material is strictly prohibited without the prior written consent of Trading Educators, Inc.
Trading Article - Selecting Stocks
by Master Trader Joe Ross
Author, Trader, Trading Mentor, and Founder of Trading Educators, Inc.
Developer of Instant Income Guaranteed
Stock book values, Price-Earnings Ratios, and stock dividends are not the fundamentals that determine a stock's price trend. Strong increased earnings, preferably over the last five years, are the most bullish fundamental statistic related to the price trend of a stock.
The best P-E ratio for strong rising stocks is over 20. These stocks remain in strong bull markets about 18 months. At the end of a typical bull market move, the P-E ratio will have doubled to over 40.
Stock traders should buy stocks that have increased earnings of 50% greater over the previous quarter minimum and show a solid earnings trend on an annual basis for five years. Be prepared to buy these stocks the moment they break out to the upside on a technical basis, or buy them when they post 52-week new highs. Wal-Mart and Tyson increased over 4000% in the decade of the 1980's. Both of these Northwest Arkansas companies met the above evaluation criteria. Another way to find good stocks is through the CANSLIM method. William O'Neil gives his excellent CANSLIM method away with a free Investor's Daily trial subscription. You might want to try it.
When I was living on a mountain top in South Africa I had only end of day data. The expense of using the Internet was so prohibitive as to make anything else not worthwhile. That is when I developed my own method for selecting stocks. It was really quite simple, and it worked. I have shown it to many of my students and they have seen it work. The method is to look for Traders Trick Entries ahead of Ross Hooks in rising markets.
Here is the "magic" way I did my stock selection: I hope you are ready for this! I typed in stock symbols aa, ab, ac, ad, ae, af, etc. consecutively, until I found a stock that was making a TTE ahead of a Ross Hook. For the next stock, I began with ba, bb, bc, bd, be, bf, etc. I rarely completed a letter series before I found something that met my qualifications. Furthermore, I don't recall having to use a 3-letter symbol to get the trades I wanted. The only qualification was volume, and I insisted on 400,000 shares/day. Sometimes it was drudge work doing it, but it met my other qualification — to be able to trade from any place in the world, including a mountain top, as long as I had a telephone, a modem, and a price chart.
© by Joe Ross. Re-transmission or reproduction of any part of this material is strictly prohibited without the prior written consent of Trading Educators, Inc.
Instant Income Guaranteed - CCL Trade
Philippe Gautier: Administration and New Developments
Developer: Joe Ross
On 4th October 2017 we gave our Instant Income Guaranteed subscribers the following trade on Carnival Corporation. (CCL). We sold price insurance as follows:
- On 5th October 2017, we sold to open CCL Nov 17 2017 60P @ 0.45$, with 42 days until expiration and our short strike about 8% below price action.
- On 16th October 2017, we bought to close CCL Nov 17 2017 60P @ 0.15$, after 11 days in the trade for quick premium compounding.
Profit: $30 per option
Margin: $1,200
Return on Margin Annualized: 82.95%
We have also added new types of trades for our Instant Income Guaranteed daily guidance since 2016, "no loss" propositions with unlimited upside potential, still using other people's money to trade.
Philippe

Receive daily trade recommendations - we do the research for you!
♦ SIGN UP TODAY! THIS IS WORTH THE INVESTMENT ♦
© by Joe Ross and Philippe Gautier. Re-transmission or reproduction of any part of this material is strictly prohibited without the prior written consent of Trading Educators, Inc.
Trading Article - Be Careful to Avoid Overconfidence
by Professional Trader Andy Jordan
Educator for Spreads, Options, Swing/Day Trading, and
Editor of Traders Notebook Complete and Traders Notebook Outrights
After a good-sized win or series of wins, you may get a feeling of invincibility with regards to your trading prowess. This could last for a period of time; an invincibility that quickly dismisses from mind the prior long cold spells suffered through, what a struggle it was at the time, how much toil, trouble, and, yes, even luck, that it took.
A state of great ease and relaxation can envelop us. If you won $5,000, for instance, you might feel like, “Heck, now I can lose $1,000 or $2,000, and still be up $3,000.” This feeling of fatness could be self-fulfilling. Of course you are too smart to fall into this trap; you would see it coming.
Unless you take this warning seriously, you might very well lose that money back — at least a serious chunk of it. How am I able to say that with such certainty? Because overconfidence makes one careless. If you do not pay attention to the details and self-control that helped you win in the first place, the likelihood of continuing to be successful rapidly diminishes.
One thing is true in trading: when things are going so well that it is hard to believe what is happening, don't change the disciplines and behavior that are working for you!
© by Andy Jordan. Re-transmission or reproduction of any part of this material is strictly prohibited without the prior written consent of Trading Educators, Inc.
Check out our Blog!
To view previous published Chart Scan newsletters, please log in or click on "Join Us,"
shown above, to subscribe to our free "Members Only" section.
A WEALTH OF INFORMATION & EDUCATION:
Joe Ross-Trading Educators' popular free Chart Scan Newsletter has been published since 2004.
Note: Unless otherwise noted, all charts used in Chart Scan commentary were created
by using Genesis Financial Technologies' Trade Navigator (with permission).
Legal Notice and Copyright 2017 Disclaimer - Published by Trading Educators, Inc.
Chart Scan is a complimentary educational newsletter.
© by Trading Educators, Inc. Re-transmission or reproduction of any part of this material is strictly prohibited without prior written consent.
Edition 697 - October 20, 2017
Edition 697 - October 20, 2017
Chart Scan with Commentary - Consolidation Part 3
by Master Trader Joe Ross
Author, Trader, Trading Mentor, and Founder of Trading Educators, Inc.
Developer of Instant Income Guaranteed
I’ve been discussing ways to spot congestion while it is still early in the game. Another way to know when you are in congestion is to see four bars with Opens, Closes, or both, inside the price range of another bar. Typically, you will see a large magnitude price bar, followed by price bars that all Open or Close within the trading range of the larger bar.
Sometimes the large bar occurs within the consolidation and is not the first bar in the series. However, the large bar usually occurs first.
This should not be surprising. I have proven over the years that some form of consolidation typically follows large magnitude bars.
A gap beyond the range of the previous bar is also a large bar move. Why? Because, in effect, prices have moved from the previous bar's close to the open of the bar following the gap. This, too, warns of an impending consolidation.
There is not enough room in this Chart Scan for me to show all the possible combinations of dojis, Open-high, Close-low bars, or Open-low, Close-high bars. Just remember that when you see these things happening, the market is in, or is about to go into, consolidation.
If these consolidation areas hook together, linked at times by single-legged trends, you then have what I call Congestion (11-20 bars) or a Trading Range (21 or more bars).

The question becomes how to trade effectively inside a sideways market. It's important for you to know, because at any time markets can and do go into prolonged consolidations — sometimes remaining in them so long that it becomes difficult to make a living without a good understanding of how to trade such markets.
In the next issue of Chart Scan we will take a look at how it might be done.
To be continued...
© by Joe Ross. Re-transmission or reproduction of any part of this material is strictly prohibited without the prior written consent of Trading Educators, Inc.
Trading Article - Setting Goals
by Master Trader Joe Ross
Author, Trader, Trading Mentor, and Founder of Trading Educators, Inc.
Developer of Instant Income Guaranteed
Here's a piece of advice: Don’t set goals too high.
A few months ago, happy Harry started trading. He read and heard that it is important to set specific goals and to try to reach them. Harry thought, "I really ought to set high goals for myself; doing that will help me to try hard. I think I'll shoot for a 20% profit per month."
But has Harry set a realistic goal? Dreams of getting rich can be a powerful motivator. However, setting unrealizable goals and then failing to meet them can demoralize Harry and actually defeat his efforts. There's a difference between high hopes and specific goals that you work to obtain, having a methodical and detailed plan.
High performance goals are not always the best goals. Harry may not have the experience or skills to reach a goal that exceeds his abilities. For example, would you try to swim the English Channel if you can't even swim two laps in a swimming pool? You have to avoid making overly high trading goals until you have the knowledge and skills to achieve them.
Nevertheless, here at Trading Educators we observe many novices making the mistake of setting their goals too high. We can understand why they do it, but we always try to dissuade them. Our culture teaches people who are ambitious to set high goals. We are taught that it is necessary to set high standards for ourselves and go out and do whatever it takes to reach them. But studies have shown that what is most important is the way you go about achieving goals.
When aspiring traders set high goals that exceed their skills, they usually fail, feel discouraged, and give up. So if you are an aspiring trader, like Harry, it may not be a good idea to immediately strive for a 20% profit per month.
If you're an aspiring trader, set yourself up to win, but don't set performance goals that are beyond your ability to achieve. Break your overall goal into specific steps, and pat yourself on the back after you succeed at each step. When you become a seasoned trader with advanced skills, you can set out to achieve your high performance goals. But in the early part of your trading career, it's in your best interest to focus on building your trading skills rather than on achieving a huge profit every month.
© by Joe Ross. Re-transmission or reproduction of any part of this material is strictly prohibited without the prior written consent of Trading Educators, Inc.

Kick back and learn while watching a webinar: Trading All Markets , Trading With More Special Set Ups , The Law of Charts In Depth , Traders Trick Advanced Concepts. You get lifetime access to watch as many times as you want, whenever you want. Use coupon code web30 when you checkout to get a 30% discount. Offer valid until 11:59 p.m., U.S. Central Time, October 25th.
Instant Income Guaranteed - NTNX Trade
Philippe Gautier: Administration and New Developments
Developer: Joe Ross
On 27th September 2017 we gave our Instant Income Guaranteed subscribers the following trade on Nutanix Inc. (NTXN). We sold price insurance as follows:
- On 28th September 2017, we sold to open NTNX Nov 17 2017 17.5P @ 0.25$, with 49 days until expiration and our short strike about 24% below price action.
- On 12th October 2017, we bought to close NTNX Nov 17 2017 17.5P @ 0.10$, after 14 days in the trade for quick premium compounding.
Profit: $15 per option
Margin: $350
Return on Margin Annualized: 111.73%
We have also added new types of trades for our Instant Income Guaranteed daily guidance since 2016, "no loss" propositions with unlimited upside potential, still using other people's money to trade.
Philippe

Receive daily trade recommendations - we do the research for you!
♦ SIGN UP TODAY! THIS IS WORTH THE INVESTMENT ♦
© by Joe Ross and Philippe Gautier. Re-transmission or reproduction of any part of this material is strictly prohibited without the prior written consent of Trading Educators, Inc.
Trading Video - What's the best time of the day to day trade EUR/USD?
by Professional Trader Marco Mayer
Educator for Forex and Futures, Systematic Trader, and
Creator of Ambush Trading Method, Ambush Signals, and AlgoStrats.com
Using a quantitative approach, Marco Mayers answers the question "What's the best time of the day to day trade the EUR/USD"?
© by Marco Mayer. Re-transmission or reproduction of any part of this material is strictly prohibited without the prior written consent of Trading Educators, Inc.
Trading Article - Don't Steam
by Professional Trader Andy Jordan
Educator for Spreads, Options, Swing/Day Trading, and
Editor of Traders Notebook Complete and Traders Notebook Outrights
“Steaming”, in poker parlance, is what happens when your queen's-up full house loses to a king's-up full house, or when your four kings lose to four aces. The term undoubtedly comes from the fact that steam begins to come out of your ears as you watch a pile of chips and money slide across the table to another player.
Because poker and trading have much in common, steaming can also happen to you in trading. Just imagine the last trade that moved perfectly into your direction right after your entry. Everything looked just fine, and you thought you would make some nice profit with this trade. But suddenly the market moved against you overnight on some bad news, and the perfect winning trade turned out to be a loser. Does this sound familiar? I'd bet it does.
But what can you do in such a situation? If possible, don't steam, which of course is easier said then done. But while the pain may be real, steaming is counterproductive. Everyone who has traded for some time recognizes that these trades are going to occur. Become annoyed. Become angry, if you must. Then forget about them. Wipe the slate clean. Resist the urge to give these occurrences a lot of emotional weight. Develop the ability to quickly reset yourself back to your normal trading, and reset your passions back to zero. The ability to go from anger and outrage to completely neutral in a very short time is a valuable skill in trading.
Use the time usually devoted to steaming to go back over the last trade in your mind to see if you missed anything. Could you have managed your trade differently? Did you put some extra money on the table that you might have saved? There is always something to be analyzed. Do it neutrally. Turn steam into analysis. Recognize that these things happen, and will balance out if you keep your balance!
© by Andy Jordan. Re-transmission or reproduction of any part of this material is strictly prohibited without the prior written consent of Trading Educators, Inc.
Check out our Blog!
To view previous published Chart Scan newsletters, please log in or click on "Join Us,"
shown above, to subscribe to our free "Members Only" section.
A WEALTH OF INFORMATION & EDUCATION:
Joe Ross-Trading Educators' popular free Chart Scan Newsletter has been published since 2004.
Note: Unless otherwise noted, all charts used in Chart Scan commentary were created
by using Genesis Financial Technologies' Trade Navigator (with permission).
Legal Notice and Copyright 2017 Disclaimer - Published by Trading Educators, Inc.
Chart Scan is a complimentary educational newsletter.
© by Trading Educators, Inc. Re-transmission or reproduction of any part of this material is strictly prohibited without prior written consent.
Edition 696 - October 13, 2017
Edition 696 - October 13, 2017
Check out next week's newsletter for Andy Jordan's Traders Notebook special offer!
by Professional Trader Andy Jordan
Educator for Spreads, Options, Swing/Day Trading, and
Editor of Traders Notebook Complete and Traders Notebook Outrights
This week, we're looking at ZMH18 – ZMN18: long March 2018 and short July 2018 Soybean Meal (CBOT on Globex).

Today we consider a Soybean Meal calender spread: long March 2018 and short July 2018 Soybean Meal (elec. symbols: ZMH18 – ZMN18; ZMES2H8 on CQG).
As you may have noticed, we are looking at a different chart today. The chart above is a so called “Correlation Chart” showing the correlation between the current Soybean Meal spread (March 18 – July 18) and the years 82, 99, 07, and 09. The spread has been following nicely its 4 Year correlation for the last few months. Will the spread follow the correlation during the next few weeks as well? Of course, we don’t know but together with the seasonal tendency to the up-side in October (chart below, there is a good statistical chance the spread will move higher.

Do you want to see how we manage this trade and how to get detailed trading instructions every day?
Traders Notebook Complete
Please visit the following link:
Yes, I would like additional information!
Check out next week's newsletter for Andy Jordan's Traders Notebook special offer!
© by Andy Jordan. Re-transmission or reproduction of any part of this material is strictly prohibited without the prior written consent of Trading Educators, Inc.
Chart Scan with Commentary - Consolidation Part 2
by Master Trader Joe Ross
Author, Trader, Trading Mentor, and Founder of Trading Educators, Inc.
Developer of Instant Income Guaranteed
This week we continue the discussion of sideways markets we started a week ago:
A good example of sideways price action is usually seen at the end of a trend or swing. Following a 1-2-3 low formation, the probabilities favor some form of consolidation. There is a word for this type of consolidation — “accumulation.” However, consolidations following a 1-2-3 high formation are called “distribution.” Consider what you have seen on charts. How many Vee bottoms and tops have you seen compared with how many consolidating tops and bottoms form up?
What are the first clues that prices may be getting ready to consolidate? Can consolidation be spotted while it is still in the birth canal? Let’s take a look:

The question becomes how to trade effectively inside a sideways market. It's important for you to know, because at any time markets can and do go into prolonged consolidations — sometimes remaining in them so long that it becomes difficult to make a living without a good understanding of how to trade such markets.
In the next issue of Chart Scan we will take a look at how it might be done.
To be continued...
© by Joe Ross. Re-transmission or reproduction of any part of this material is strictly prohibited without the prior written consent of Trading Educators, Inc.
Trading Article - What Drives Inflation?
by Master Trader Joe Ross
Author, Trader, Trading Mentor, and Founder of Trading Educators, Inc.
Developer of Instant Income Guaranteed
If there is one factor that drives the inflation-deflation cycle, it is the effect and trend of interest rates. The bond/note market is the foundation of the stock market, and makes its existence possible. Interest rates compete with all other forms of investment for capital. When rates are rising, the stock market is less attractive because government bond and note yields are guaranteed, while stock market dividends and profits are not. Falling interest rates, which may stimulate inflation, precipitated the largest stock market increase in history. Real interest rate yield equals the inflation rate subtracted from interest rate yields. A 5% bond yield and 7% inflation rate erodes the purchasing power of money annually by two times.
Notes and bonds are not really controllable by the FED. The market pretty much decides what those will be. There is a great fallacy perpetrated by the FED which makes people think the FED controls interest rates. The truth is they don’t. All the FED ever does is to react to what is happening in the market. When the yield curve gets too far out of alignment, the Fed raises or lowers interest rates.
However, there's more. The FED does control the money supply. The FED prints money with no accountability. They create money out of thin air. With the removal of the M3 statistic, the lack of control is even more prominently displayed. The FED is almost entirely responsible for long-term inflation. If you or I were to print money with no accountability, we would be put in prison for counterfeiting. Yet the FED continues to print counterfeit money to the extent that people on fixed incomes suffer tremendously from the falling dollar. In effect, by printing tons of money the FED has devalued the dollar to the point of excess. In the last 10 years the purchasing power of the dollar has declined considerably.
© by Joe Ross. Re-transmission or reproduction of any part of this material is strictly prohibited without the prior written consent of Trading Educators, Inc.
Instant Income Guaranteed - EV Trade
Philippe Gautier: Administration and New Developments
Developer: Joe Ross
On 24th September 2017 we gave our Instant Income Guaranteed subscribers the following trade on Eaton Vance Corporation (EV). We sold price insurance as follows:
- On 25th September 2017, we sold to open EV Nov 17 2017 45P @ 0.50$, with 52 days until expiration and our short strike about 7% below price action.
- On 3rd October 2017, we bought to close EV Nov 17 2017 45P @ 0.25$, after 8 days in the trade for quick premium compounding.
Profit: $25 per option
Margin: $900
Return on Margin Annualized: 126.74%
We have also added new types of trades for our Instant Income Guaranteed daily guidance since 2016, "no loss" propositions with unlimited upside potential, still using other people's money to trade.
Philippe

Receive daily trade recommendations - we do the research for you!
♦ SIGN UP TODAY! THIS IS WORTH THE INVESTMENT ♦
© by Joe Ross and Philippe Gautier. Re-transmission or reproduction of any part of this material is strictly prohibited without the prior written consent of Trading Educators, Inc.
Trading Video - Trading Error: Averaging into a Losing Position
by Professional Trader Marco Mayer
Educator for Forex and Futures, Systematic Trader, and
Creator of Ambush Trading Method, Ambush Signals, and AlgoStrats.com
Find out the most common, deadly mistakes traders can make, and that's averaging into a losing position. Learn insights as to why this is so tempting, and why you should avoid it at all costs.
© by Marco Mayer. Re-transmission or reproduction of any part of this material is strictly prohibited without the prior written consent of Trading Educators, Inc.
Check out our Blog!
To view previous published Chart Scan newsletters, please log in or click on "Join Us,"
shown above, to subscribe to our free "Members Only" section.
A WEALTH OF INFORMATION & EDUCATION:
Joe Ross-Trading Educators' popular free Chart Scan Newsletter has been published since 2004.
Note: Unless otherwise noted, all charts used in Chart Scan commentary were created
by using Genesis Financial Technologies' Trade Navigator (with permission).
Legal Notice and Copyright 2017 Disclaimer - Published by Trading Educators, Inc.
Chart Scan is a complimentary educational newsletter.
© by Trading Educators, Inc. Re-transmission or reproduction of any part of this material is strictly prohibited without prior written consent.
Edition 695 - October 6, 2017
Edition 695 - October 6, 2017
Chart Scan with Commentary - Consolidation Part 1
by Master Trader Joe Ross
Author, Trader, Trading Mentor, and Founder of Trading Educators, Inc.
Developer of Instant Income Guaranteed
This week we are beginning a multi-part series on trading in consolidation. I want to show you how to trade inside a consolidation. But first we need to see a few basics to build up to "how to do it."
Let's begin with a basic truth: every market is in consolidation between the highest high it ever made and the lowest low. However, within that consolidation are trends, swings, and smaller consolidations from 4-bar ledges to trading ranges extending for more than 20 bars.
To trade within a consolidation, we must know as early as possible that a market is indeed consolidating. As we go through this series, I'll show you how to tell.
When we see an /\/\ or \/\/ on the screen, we know we are in a consolidating area. I know from your communications that many of you have a hard time recognizing consolidation. One way to spot consolidation is through the use of candlesticks.

Candlesticks offer a visual aid for spotting consolidation. Let's see how. If you see a group of dojis in a row, or a group of alternating green and red candles in a row, you are looking at consolidation. Any combination of alternating dojis and candlesticks constitute consolidation. Consolidation always has a minimum of four bars. When I say any combination of dojis and candlesticks, I mean that you might get two or more black candles in a row, followed by one or more red candles. The opposite is also true you might get two or more red candles in a row followed by one or more black candles. The congestion often starts with a doji followed by alternating red and black candles.
Consolidation may be telling you there may be confusion about price. Consolidation may be telling you that there is no oversupply or excessive demand. Supply and demand are in equilibrium, and so the market goes sideways. Consolidation can also mean less order flow into the markets. Prices are at a level where buyers are willing to buy and sellers are willing to sell, but there is nothing known that would cause impulsive, emotional buying and selling. and momentum and thrust are mostly missing.
To be continued…
© by Joe Ross. Re-transmission or reproduction of any part of this material is strictly prohibited without the prior written consent of Trading Educators, Inc.
Trading Article - Trading: Art or Science?
by Master Trader Joe Ross
Author, Trader, Trading Mentor, and Founder of Trading Educators, Inc.
Developer of Instant Income Guaranteed
I believe trading is far more an art than a science. For one thing, if trading were a science, then we should all be able to enter the same trade at the same time, and exit at the same time, getting identical results. We all know that just isn’t so. Yet if trading were scientific, we should be able to get identical results by doing the same thing. I believe such expectation describes the “scientific method.”
In addition, if trading were scientific, we should be able to come up with a “get rich” formula that would work all the time. We could then all retire and never have to work again. We all know this isn’t so either.
When we, as traders, make a trading decision, most of the time we do not fully know why we are making that decision.
You look at a market, you think about taking a trade in that market, and at some point you pull the trigger. You have thought of dozens of things in the time interval leading up to your entry. If I were to ask you, "Exactly why are you buying what you are, or why are you selling what you are?" you would probably not be able to give an accurate answer. You may be able to give a few reasons, but it will most likely not be the full answer. A lot of your decision to enter is subconscious. You do not really know why you entered, especially if you are day trading. To that extent it is more an art than a science, because you cannot fully demonstrate why you are doing what you are doing.
But you could say, "I fully know what I'm doing. I am taking the trade because I am following the signals of my method or system." Wonderful, you have just proved my point. When you are blindly trading signals from a method or system, you truly don't know why you are taking the trade. You are essentially acting like a robot, pre-programmed to follow signals whether or not they make sense.
I am not disparaging trading that way. If a method or system produces winning results, then what you are doing is following a statistically proven plan. All methods and all systems are based on statistics. The odds on any single trade are never more than 50% win or lose. However, the probability for a succession of trades is quite another story. If you are trading a method that wins seven out of ten times that you enter, and the method has produced a loser three or four times in a row, then the probability for a successful trade increases each time you enter the market. Sooner or later, over a series of trades, you are going to have the result of seven winners against 3 losers. That is statistically valid; however, it is not exactly rocket science. You will have proven that trading is an art — the art of following a statistically valid plan.
© by Joe Ross. Re-transmission or reproduction of any part of this material is strictly prohibited without the prior written consent of Trading Educators, Inc.
Instant Income Guaranteed - LNC Trade
Philippe Gautier: Administration and New Developments
Developer: Joe Ross
On 13th September 2017 we gave our Instant Income Guaranteed (IIG) subscribers the following trade on Lincoln National Corporation (LNC). We sold price insurance as follows:
- On 14th and 15th September 2017, we sold to open LNC Oct 20 2017 62.5P @ 0.36$ (average price), with 35/36 days until expiration and our short strike about 10% below price action.
- On 25th September 2017, we bought to close LNC Oct 20 2017 62.5P @ 0.10$, after 11 days in the trade for quick premium compounding.
Profit: $26 per option
Margin: $1,250
Return on Margin Annualized: 69.02%
We have also added new types of trades for our IIG daily guidance since 2016, "no loss" propositions with unlimited upside potential, still using other people's money to trade.
Philippe

Receive daily trade recommendations - we do the research for you!
♦ SIGN UP TODAY! THIS IS WORTH THE INVESTMENT ♦
© by Joe Ross and Philippe Gautier. Re-transmission or reproduction of any part of this material is strictly prohibited without the prior written consent of Trading Educators, Inc.
Blog Post - Patience as a Central Pillar of Your Strategy
by Professional Trader Andy Jordan
Educator for Spreads, Options, Swing/Day Trading, and
Editor of Traders Notebook Complete and Traders Notebook Outrights
Find out what the primary part of your trading strategy should include...read more.
© by Andy Jordan. Re-transmission or reproduction of any part of this material is strictly prohibited without the prior written consent of Trading Educators, Inc.
Trading Article - Who's next in line?
by Professional Trader Marco Mayer
Educator for Forex and Futures, Systematic Trader, and
Creator of Ambush Trading Method, Ambush Signals, and AlgoStrats.com
"Buy low, sell high" is one of the most popular memes in the investment and trading world. And obviously, it does make sense, who wouldn't like to buy low and sell high all the time? I found this to be quite a helpful advice to invest in stocks for example. Wait for a crash, buy it and sell again when prices are back to old highs.
Of course, the problem often is to figure out what's actually a low price and what's a high price. You can also buy high and sell higher to make a profit, which is how trend following works.
So what's the real deal here? I think the actual question to ask is "who's going to buy after me?" or "who's next in line?". Will there be enough traders willing to buy after you did at a higher price? Or if you're short the other way around, will there be sellers standing in line to sell after you did or not?
Think about it. To make a profit that's exactly what needs to happen. If you buy at $100, the only way to make a profit is if there are buyers willing to buy at higher prices. If they don't bid it up after you and you find someone to sell to at a higher price, you won't make a profit. Simple fact most traders are not really aware of.
Obviously, there's always someone who's gonna be the last in line. Someone is going to buy the high of the day/week/month/year/all-time. In poker, there's the popular saying that if you don't know who the patsy is in the round after 30 minutes, it's probably you. That same idea applies to trading. If you don't know why other traders are probably willing to buy at a higher price after you during the day, you might be the last one in the order book to bid at such a high price for today.
Because of that, it's always helpful to ask yourself "Who's gonna buy/sell after me and why?". If you can't answer that question it might be best to skip the trade!
Happy Trading!
Marco
© by Marco Mayer. Re-transmission or reproduction of any part of this material is strictly prohibited without the prior written consent of Trading Educators, Inc.
Check out our Blog!
To view previous published Chart Scan newsletters, please log in or click on "Join Us,"
shown above, to subscribe to our free "Members Only" section.
A WEALTH OF INFORMATION & EDUCATION:
Joe Ross-Trading Educators' popular free Chart Scan Newsletter has been published since 2004.
Note: Unless otherwise noted, all charts used in Chart Scan commentary were created
by using Genesis Financial Technologies' Trade Navigator (with permission).
Legal Notice and Copyright 2017 Disclaimer - Published by Trading Educators, Inc.
Chart Scan is a complimentary educational newsletter.
© by Trading Educators, Inc. Re-transmission or reproduction of any part of this material is strictly prohibited without prior written consent.
Edition 694 - September 29, 2017
Edition 694 - September 29, 2017
Chart Scan with Commentary - Profit Taking Pivots
by Master Trader Joe Ross
Author, Trader, Trading Mentor, and Founder of Trading Educators, Inc.
Developer of Instant Income Guaranteed
One of my friends sent me the following chart along with his comments as you’ll see below.
Not all my students trade plain vanilla charts, which is usually the way I trade them. Some students use indicators in unconventional ways to improve their trading. The chart below is an example of using Stochastics to confirm changes in momentum in conjunction with ends of swings and trends.

Here's what my friend wrote:
"Hey, Joe...I'm passing along this chart because I thought you'd want to take a look.
You've been talking longer-term recently; I just happened to be looking at the daily GOLD chart this evening. You might be interested to observe how well the Stochastic (5,3,3) has caught the profit-taking retracements, prior to changing direction in this market.
For example, if one made a habit of taking the first breakout following a %K/%D cross (or perhaps even wait for a reversal bar), plenty of dollars could have been made in gold futures. Will prices move higher or lower? We'll have to wait and to see!"
The concept shown in this issue of Chart Scan, along with greater details and even more techniques are covered in our More Special-Setups Webinar.
© by Joe Ross. Re-transmission or reproduction of any part of this material is strictly prohibited without the prior written consent of Trading Educators, Inc.
Trading Article - Can Tick, Ticki, and Trin Be Used with Stochastics?
by Master Trader Joe Ross
Author, Trader, Trading Mentor, and Founder of Trading Educators, Inc.
Developer of Instant Income Guaranteed
I get some unusual questions from time to time, and this is one of them.
Certainly, the TICK can be used with Stochastics, as I explain below. The TICK expresses the net total of NYSE stocks that have down-ticked or up-ticked on the last trade. When E-Mini S&Ps are making new intra-day highs, the TICK should be +250 minimum. If the TICK is negative, do not take a long position. When new intraday lows are being made, a -250 minimum value should be recorded. If the TICK reaches over +500, try to buy a Stochastic D line correction at 50 or lower, and expect new intraday highs. After 2 PM CST, the main trading in the T-Bonds is over, and E-Mini S&P prices are prone to rally if they were being pressured by the T-Bonds.
The TIKI does the same thing for the Dow 30 as the TICK does for the NYSE Stock Index. It measures the tick for the 30 DJ Industrial stocks. However, I am not able to tell you exactly how to use it because I haven't really ever looked at it. I'm sure that at a value which shows TIKI to favor a long position, and with the Stochastic at oversold, you would have corroboration for going long. Vice-versa for going short with the Stochastic at overbought.
The TRIN calculates two ratios of up and down volume on gaining and losing stocks. Below 65 the TRIN is bullish; it is bearish above 110. If you seek confirmation of TRIN for a bullish position, you would want a Stochastic reading of 25 or less. If you wanted confirmation of TRIN for a bearish position, you would want to see Stochastic at 75 or more.
Numbers can be very important. Did you know that the probability of financial ruin of a system 50% accurate with a 1 to 1 pay off risking 10% of capital on each trade is .99%; with a 2 to 1 payoff, the probability of financial ruin falls to .008%?
© by Joe Ross. Re-transmission or reproduction of any part of this material is strictly prohibited without the prior written consent of Trading Educators, Inc.
Instant Income Guaranteed - IPHI Trade
Philippe Gautier: Administration and New Developments
Developer: Joe Ross
On 4th September 2017 we gave our IIG subscribers the following trade on Inphi Corporation (IPHI). We sold price insurance as follows:
- On 5th and 7th September 2017, we sold to open IPHI Oct 20 2017 30P @ 0.325$ (average price), with 44 days until expiration and our short strike about 20% below price action.
- On 19th September 2017, we bought to close IPHI Oct 20 2017 30P @ 0.15$, after 13 days in the trade for quick premium compounding.
Profit: $17.50 per option
Margin: $600
Return on Margin Annualized: 81.89%
We have also added new types of trades for our IIG daily guidance since 2016, "no loss" propositions with unlimited upside potential, still using other people's money to trade.
Philippe

Receive daily trade recommendations - we do the research for you!
♦ SIGN UP TODAY! THIS IS WORTH THE INVESTMENT ♦
© by Joe Ross and Philippe Gautier. Re-transmission or reproduction of any part of this material is strictly prohibited without the prior written consent of Trading Educators, Inc.
Traders Notebook Outrights
by Professional Trader Andy Jordan
Educator for Spreads, Options, Swing/Day Trading, and
Editor of Traders Notebook Complete and Traders Notebook Outrights
Learn Futures Swing Trading Strategies with Traders Notebook Outrights
Whether you trade commodities, currencies, financial instruments or indexes, there is a right approach to every market and time frame. You have never experienced support as you will find it with Traders Notebook. We back up and stand behind everything we do. Traders Notebook Outright shows you Futures Trading Strategies that you can also incorporate into your existing personal Day Trading Strategies.
YOU can tap into Joe Ross' and Andy Jordans' decades of hands-on trading experience. There is no need to struggle for years buying one book after another, or one "magical" mechanical trading system after another. You will receive a solid trading education from us! There is no need to knock yourself out learning about a lot of indicators. No need for Elliott Waves, Fibonacci points of confluence, and no need for Gann Theory.
Traders Notebook Outright Guide explains the Outright trading service from Trading Educators. It shows you around on the Outright Campus and how to use the information provided by the service.
TRADERS NOTEBOOK OUTRIGHTS
LOW
Monthly Subscription
$49.00/month
© by Andy Jordan. Re-transmission or reproduction of any part of this material is strictly prohibited without the prior written consent of Trading Educators, Inc.
TRADING VIDEO - MOST DEADLY MISTAKE MADE BY TRADERS
by Professional Trader Marco Mayer
Educator for Forex and Futures, Systematic Trader, and
Creator of Ambush Trading Method, Ambush Signals, and AlgoStrats.com
Let me share with you one of the most common, and most deadly mistakes traders can make, and that's averaging into a losing position. I will also give you some insights as to why this is so tempting, and shows you why you should avoid it at all costs.
INVEST IN YOU!
Marco Mayer - Private Mentoring Services
© by Marco Mayer. Re-transmission or reproduction of any part of this material is strictly prohibited without the prior written consent of Trading Educators, Inc.
Check out our Blog!
To view previous published Chart Scan newsletters, please log in or click on "Join Us,"
shown above, to subscribe to our free "Members Only" section.
A WEALTH OF INFORMATION & EDUCATION:
Joe Ross-Trading Educators' popular free Chart Scan Newsletter has been published since 2004.
Note: Unless otherwise noted, all charts used in Chart Scan commentary were created
by using Genesis Financial Technologies' Trade Navigator (with permission).
Legal Notice and Copyright 2017 Disclaimer - Published by Trading Educators, Inc.
Chart Scan is a complimentary educational newsletter.
© by Trading Educators, Inc. Re-transmission or reproduction of any part of this material is strictly prohibited without prior written consent.
Edition 693 - September 22, 2017
Edition 693 - September 22, 2017
AMBUSH TRADING METHOD - 3:1 Ratio
by Professional Trader Marco Mayer
Educator for Forex and Futures, Systematic Trader, and
Creator of Ambush Trading Method, Ambush Signals, and AlgoStrats.com
Ambush made new all time equity highs having its best month EVER!
Marco Mayer has extended his 6-Month Subscription Special Offer until September 26th!
Ambush Signals has almost a $15,000 profit so far in 2017 with a maximum drawdown of about $4,000. That’s an excellent ratio of more than 3:1. That’s very, very hard to find in the industry, especially in 2017.

Ambush beat its historical pre-live backtest!
View more sample portfolios on the Performance Page.

In total the portfolio gained more than $8,000 in August, with 85% winning trades while having made over 1.4 times more profits on winning trades than on losing trades. How’s your favorite market doing with Ambush? Go to the Performance Page!
Become an Ambush Trader!
- Ambush Signals does all the work for you
- Customize your markets
- Position sizing tool to automatically adjust the positions to your risk preferences
6 months of Ambush Signals
Low Price of $499
$215 savings!
Build the Confidence through Drawdowns
6 months of Ambush Signals for $499 today, click here!
If you prefer to generate the signals on your own, buy the Ambush eBook today!
Coupon Code, ambush300, takes $300 off regular price!
© by Marco Mayer. Re-transmission or reproduction of any part of this material is strictly prohibited without the prior written consent of Trading Educators, Inc.
Chart Scan with Commentary - eMini Russell 2000
by Master Trader Joe Ross
Author, Trader, Trading Mentor, and Founder of Trading Educators, Inc.
Developer of Instant Income Guaranteed
Personally, I enjoy trading the e-mini Russell 2000. It makes beautiful Law of Charts formations. I take trades in it mostly from the 3-10, minute time frames, but also quite often from the daily chart. The formations are always clean and clear, and the moves tend to be spectacular. As one of our trading friends put it, you get ten ticks to the point with Russell for $100 total, versus only four ticks per point with the e-mini S&P for a total of $50. That makes Russell easier to trade.
Let's look at a daily Russell chart to see some classic Law of Charts formations that have happened recently.
As you can see, prices reached the low in May with a beautiful reversal bar. Based on that reversal bar, frightened shorts began buying to lock in any profits they might have had from earlier price action. Reversal bar breakout traders joined in the buying, and prices moved from #1 to #2. Again at #2 there was profit taking by longs, and their selling took prices down to where we see #3. There were four correcting bars in the move to #3, at which time there was Traders Trick Entry available for going long.
Prices then proceeded to move past the #2 point, and a Ross hook formed. From the point of the first Ross hook there were three bars of correction, yielding another Traders Trick Entry.
Prices moved up again, formed a second Ross Hook, but then fell back into a 16-bar consolidation. The high and low of the consolidation I showed as brown horizontal lines. The green line is the center of the consolidation.
As I write this, it is not yet clear what will happen from where we see prices on the last bar. But a lot of money was available from the two TTEs.
Implementing The Law of Charts using the Traders Trick Entry continues to produce profits for thousands of traders around the world. Because of this we are proud to offer the Trading All Markets Recorded Webinar, or The Law of Charts In-Depth Recorded Webinar. We hope those of you who have been unable to take private mentoring will take advantage of the wealth of knowledge available in either of these Recorded Webinars.

© by Joe Ross. Re-transmission or reproduction of any part of this material is strictly prohibited without the prior written consent of Trading Educators, Inc.
Trading Article - Plans and Objectives
by Master Trader Joe Ross
Author, Trader, Trading Mentor, and Founder of Trading Educators, Inc.
Developer of Instant Income Guaranteed
I was watching an old movie "Coach Carter," starring Samuel L. Jackson. I couldn't help thinking about the many similarities between what a coach must do to prepare his players and what a trader must do to prepare to trade.
Since trading is largely a self-directed business venture, embarking on a trading career requires that you are able to set clearly defined objectives and develop a specific plan for achieving them.
Clearly defined objectives and well-developed plans carry the stamp of success in any professional undertaking.
Imagine an ocean liner departing without a navigational plan, a repairman doing repairs on your refrigerator without full knowledge of the workings of the compressor, or a professional basketball team running onto the court without a game plan.
In each case, the lack of a clearly defined plan in which specific objectives are set and specific steps are outlined can produce disastrous results. Clearly defined plans are essential. The captain sails his ship with plans for the safe and on-time arrival to a destination city. The repairman examines the inner workings of your refrigerator and uses the correct parts and tools to fix the problem. The coach tells the basketball team to run specific plays to defeat the opponent.
Successful trading careers start with plans that specify objectives, which in turn lead to success. There are psychological benefits to establishing objectives and developing plans to reach them. First, you may find your stress levels are reduced. Making a specific plan allows you to detail any vague and seemingly unattainable objectives into clearly defined steps, which in turn make the larger goal seem more reachable. When you have a specific plan, you can more easily identify which steps to do first, and then figure out how you will achieve each one. In addition, you will find that following a plan ensures you stay positive, so you control each aspect of your trading day (instead of its controlling you). This leads to increased confidence and consistency, which leads to increased effectiveness, which in turn leads to advancement towards your ultimate goal.
You must then write down the way you envision your goal. Create a definitive statement detailing as much of it as you can. Be very specific. Then read your objectives aloud every day. They must become believable.
Accordingly, you adjust trade size and protective stops so that you never lose more than your planned amount on any trade.
Now, map out your plan. What is your budget for hardware, software, and education? How much time can you devote? How much money will you use? What trading time frame, or style, matches your personality? For example, if you have trouble making split-second decisions, then scalping is not for you. Perhaps position trading, with a 2 to 5-day hold, better suits your personality.
Maybe you want to target certain markets and become a “specialist” in those markets. Or maybe you prefer to trade spreads or options. What set-ups do you prefer? Become an expert at trading a particular set-up and have it deliver the main part of your gains. Detail your trade, risk and money management strategies. Finally, establish a list of trading rules that you keep close-by.
Once you establish convincing and realistic objectives, and map out a plan that leads to those goals, you will find your trading efforts to be easier, more exciting, and certainly more successful!
© by Joe Ross. Re-transmission or reproduction of any part of this material is strictly prohibited without the prior written consent of Trading Educators, Inc.
Instant Income Guaranteed - UFS Trade
Philippe Gautier: Administration and New Developments
Developer: Joe Ross
On 20th August 2017 we gave our IIG subscribers the following trade on Domtar Corporation (UFS). We sold price insurance as follows:
- On 21st August 2017, we sold to open UFS Oct 20, 2017 35P @ $0.35, with 59 days until expiration and our short strike 12% below price action.
- On 11th September 2017, we bought to close UFS Oct 20, 2017 35P @ $0.15, after 21 days in the trade.
Profit: $20 per option
Margin: $70
Return on Margin Annualized: 49.66%
We have also added new types of trades for our IIG daily guidance since 2016, "no loss" propositions with unlimited upside potential, still using other people's money to trade.
Philippe

Receive daily trade recommendations - we do the research for you!
Instant Income Guaranteed
♦ SIGN UP TODAY! THIS IS WORTH THE INVESTMENT ♦
© by Joe Ross and Philippe Gautier. Re-transmission or reproduction of any part of this material is strictly prohibited without the prior written consent of Trading Educators, Inc.
Trading Blog - Achieving Self-Esteem
by Professional Trader Andy Jordan
Educator for Spreads, Options, Swing/Day Trading, and
Editor of Traders Notebook Complete and Traders Notebook Outrights
The single most important component of the personality related to personal achievement is self-esteem. Self-esteem is simply how much an individual likes himself and correlates to high achievement on a one-to-one basis. The more an individual likes himself the higher levels of performance he can achieve in any area of his life. Traders should always have at least one physical or mental activity every week that helps them feel good about themselves, like chess or golf.
To reach high performance and personal achievement, understanding the three components of the self-concept is beneficial. The Ideal Self is a mental picture of the trader a person would like to become, a composite of the all positive qualities admired in other traders. Schwager's "Market Wizards" is filled with these admirable characters with their winning personalities. The Self Image is the inner mirror of the person a trader thinks he really is, and relates how he interacts with others on a day-today basis. A person seldom reaches levels of achievement beyond his self-image limitations. The Self-Esteem is how much a person likes himself. The more a person likes himself the higher levels of achievement are possible. These three components of the personality are always changing every moment. The self-aware trader shapes these personality components to compliment his goal achieving efforts to profitably trade the markets.
© by Andy Jordan. Re-transmission or reproduction of any part of this material is strictly prohibited without the prior written consent of Trading Educators, Inc.
Check out our Blog!
To view previous published Chart Scan newsletters, please log in or click on "Join Us,"
shown above, to subscribe to our free "Members Only" section.
A WEALTH OF INFORMATION & EDUCATION:
Joe Ross-Trading Educators' popular free Chart Scan Newsletter has been published since 2004.
Note: Unless otherwise noted, all charts used in Chart Scan commentary were created
by using Genesis Financial Technologies' Trade Navigator (with permission).
Legal Notice and Copyright 2017 Disclaimer - Published by Trading Educators, Inc.
Chart Scan is a complimentary educational newsletter.
© by Trading Educators, Inc. Re-transmission or reproduction of any part of this material is strictly prohibited without prior written consent.

