

Newsletters (208)
Children categories
Edition 640 - September 16, 2016

This is the final day before the Ambush Trading Method goes up in price. Grab a copy at the low current price while you still can!

The Law of Charts with Commentary
by Master Trader Joe Ross
Author, Trader, Trading Mentor, and Founder of Trading Educators, Inc.
TRADABLE MARKETS
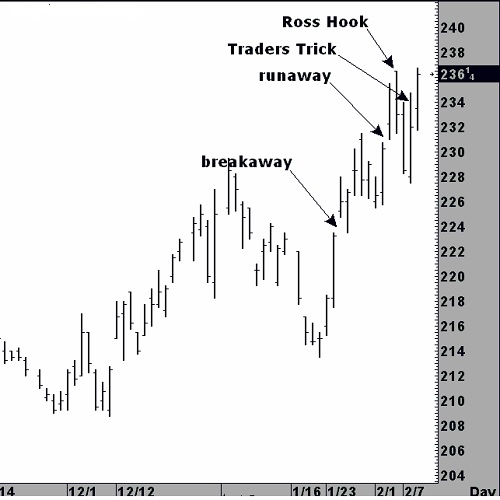
"Joe, would you analyze the attached futures for me?" So, here goes. This chart is easy to analyze using a combination of old-time, classical charting techniques, along with The Law of Charts and the Traders Trick Entry.
I've marked two gaps on the chart: a "breakaway gap" and a "runaway gap." The next gap up on the daily chart will bear the title "exhaustion gap," and should be the beginning of a correction or sideways area of distribution. Taking the Traders Trick Entry ahead of a breakout of the Ross hook is already showing a profit. 2 to 2.5 points should be taken so that you are paid to trade. Using that kind of management takes the pressure off the trade and off yourself as well. Then it is just a matter of where you now want to place your protection. Certainly you should not allow yourself to do any worse than breakeven on the remainder of your position. If I were trading a 10-lot in this situation, I would take 6 lots off at the point of the Ross hook, and move 4 lots to breakeven. However, that's me. You have to come up with your own management within your own financial, mental, and emotional level of comfort.
© by Joe Ross. Re-transmission or reproduction of any part of this material is strictly prohibited without the prior written consent of Trading Educators, Inc.
START OUT STRONG
by Master Trader Joe Ross
Author, Trader, Trading Mentor, and Founder of Trading Educators, Inc.
Trading is a challenging business. Not only is it tough to repeatedly pick one winning trade after another, it is also hard to control our emotions. Our emotions often get the better of us. Our expectations tend to influence how we feel as we trade, and when we doubt our abilities, we may have difficulty maintaining a winning attitude. One good approach to staying optimistic as you battle with the markets is to build up psychological momentum: start off ahead of the game, and build on that success. However, many traders set themselves up for failure. They start off making trading errors, and dig themselves into an emotional hole from which they have trouble climbing out.
The expectations you have regarding a trade can dictate how you approach it. If you feel you are about to make a mistake, then you probably will make a trading error. You might have a perfectly good idea for a trade, for example, but you may feel so on edge that you have trouble taking advantage of it. It often starts out innocently enough. You have a good trading plan, but you make a few little errors. Perhaps you trade under less than ideal market conditions, or you set your stop too close to your exit point and get stopped out. Maybe you don't put up enough capital to make your trading plan work.
Whatever it is, you may make a few poor decisions, end up with a losing trade, and feel disappointed. Making one bad trade isn't a big deal, but what happens when you make another losing trade, and then another losing trade, and so on? At that point, you may feel that it is hard to get out of the minor slump you are in.
How can you set yourself up to win? First, realize that trading can be much like a self-fulfilling prophecy: you secretly believe that your trading plan won't produce a profit, and then you subtly self-sabotage your plan by feeling uptight, overly exacting, and constrained. It is vital to feel relaxed and carefree when you start out the trading day. Think optimistically.
Second, why not cheat a little? When you start the trading day, wait for an ideal trade, a trade you can afford to make which has a high probability of winning. If the first thing you do is make a profitable trade, even a small one, you'll feel good on your first trade, and then you can start building on your solid start.
When you set yourself up to win, you feel good, and this good feeling can help you trade more creatively. Instead of feeling uptight, you will trust your instincts and be more willing to risk capital. You won't make minor mistakes like risking too little capital, or placing your protective stop too tight and getting repeatedly stopped out. If you trade with wavering confidence, these minor errors can happen below your level of awareness, and at that point you may start mounting losses. Why set yourself up for a series of losers? Start off strong. Set yourself up for success, and build up the psychological momentum you need to trade with a winning mental edge.
© by Joe Ross. Re-transmission or reproduction of any part of this material is strictly prohibited without the prior written consent of Trading Educators, Inc.
FMC TRADE
Instant Income Guaranteed
Developer: Joe Ross
Administration and New Developments: Philippe Gautier
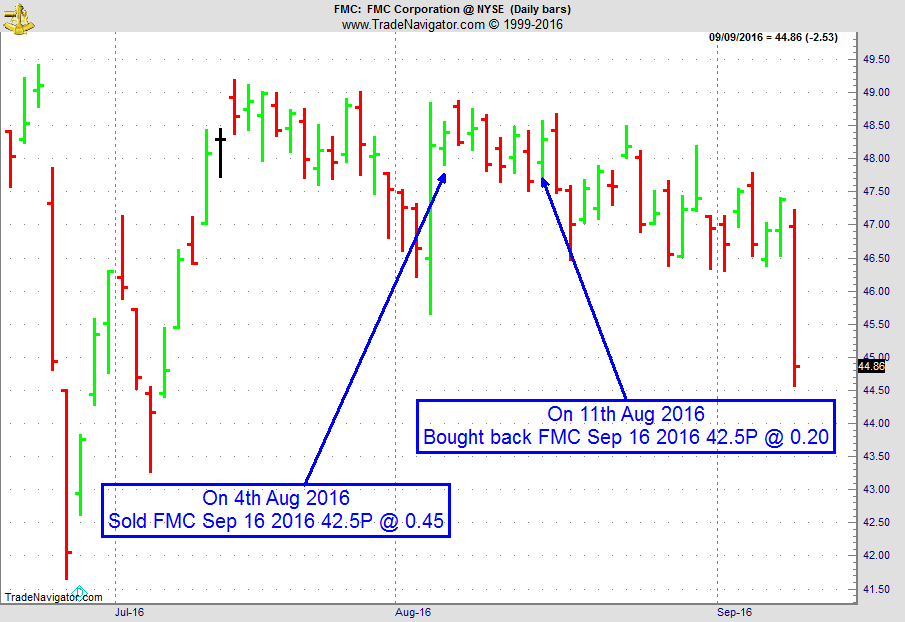
On 3rd August 2016, we gave our IIG subscribers the following trade on FMC, right after a strong move up on earnings. With strong support around $44, we decided to sell price insurance as follows the following day:
- On 4th August 2016, we sold FMC September 16 2016 42.5P @ $0.45, i.e. $45 per option sold, with 42 days to expiration.
- On 11th August 2016, we bought back FMC September 16 2016 42.5P @ $0.20, after 8 days in the trade, for quick premium compounding.
Profit: $25
Margin: $850
Return on Margin Annualized: 134.19%
We have also added new types of trades for our IIG daily guidance, "no loss" propositions with unlimited upside potential, still using other people's money to trade.
Philippe
Receive daily trade recommendations - we do the research for you!
Instant Income Guaranteed
♦ SIGN UP TODAY! THIS IS WORTH THE INVESTMENT ♦
This includes a daily 80+ page report along with a daily podcast!
We review and supply the following:
-
our daily fills (entries, exits)
-
full real-time statistics of our weekly trades, closed trades for the current month, monthly statistics (detail and summary) since the beginning of IIG
-
daily market commentary (indices/sectors, volatility indices, main commodities related to our trade)
-
new trades for the following day
-
comments on our open trades, with all relevant news
-
updated earnings dates for our open positions
-
full details (days in trade, days to expiration, underlying close and price change, etc.) on our open trades (classic trades, complex positions, remaining rolled trades and covered calls)
-
active good till cancelled orders
-
dividends for the stocks owned
We also supply quite a number of extra "slides" in the appendix which are quite useful for new subscribers: recommendations, answers and explanations on the most frequent questions, techniques for entering trades, historical trades and real life examples, broker information, etc.
© by Joe Ross and Philippe Gautier. Re-transmission or reproduction of any part of this material is strictly prohibited without the prior written consent of Trading Educators, Inc.

Trading Idea
by Master Trader Andy Jordan
Educator for Spreads, Options, Swing/Day Trading, and Editor of Traders Notebook
Sorry, no trading idea this week. Root canal is no fun!

© by Andy Jordan. Re-transmission or reproduction of any part of this material is strictly prohibited without the prior written consent of Trading Educators, Inc.
This Week's Blog Post - Markets Tend to Part the Foolish from their Money
by Master Trader Andy Jordan
Educator for Spreads, Options, Swing/Day Trading, and Editor of Traders Notebook
Sometimes you feel that you are able to throw caution to the wind. That is when you must be careful to not spit into it. Read more.
© by Andy Jordan. Re-transmission or reproduction of any part of this material is strictly prohibited without the prior written consent of Trading Educators, Inc.
The price of Ambush Trading Method will increase to $1,299 on September 17, 2016.
Grab a copy at the current price while you still can!
Ambush Trading Method - All-Stars Portfolio
by Master Trader Marco Mayer
Educator for Forex and Futures, Systematic Trader, and
Creator of Ambush Trading Method and AlgoStrats.com
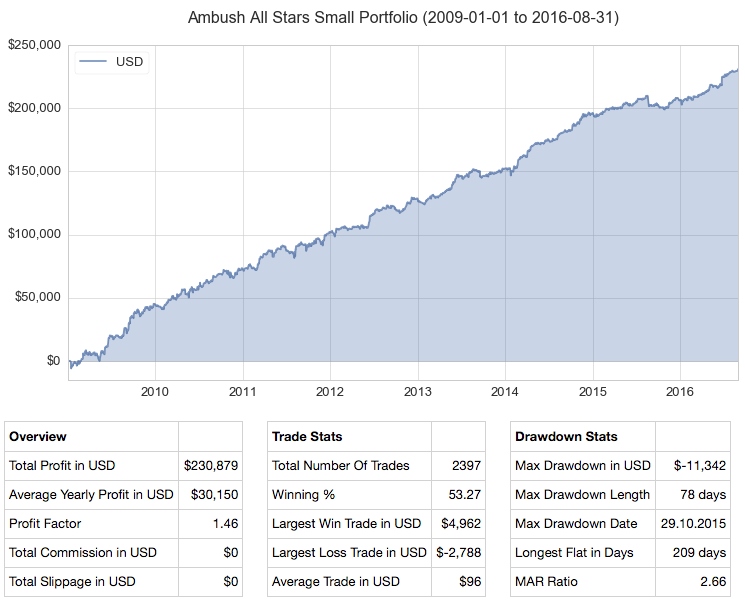
Here's an important update with Ambush Trading Method using the All-Stars Portfolio for small accounts E-Mini S&P 500 (ES), Australian Dollar (6A), Natural Gas (NG), 10 Year US T-Note (ZN)) trading one contract per market, except ZN where we use two contracts. For more information regarding the portfolio and long-term performance, see the Ambush Performance Page.
Last week was a difficult one for many traders, and as Ambush just made new equity highs at the end of August, how did it continue to perform? Here's the answer, play by play, Ambush had another crazy week making almost $5,000 performance in the small portfolio, making new all time equity highs across the board again:
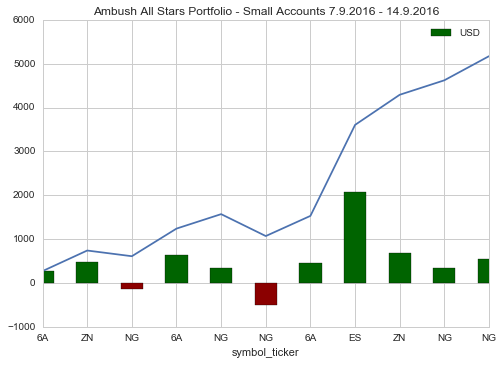
As you can see Ambush killed it again in the markets, in the E-Mini S&P 500 alone there was one trade with a profit of about $2,000. That's also the answer to the question why we're raising the price of Ambush. The old price simply is in no relation to the crazy performance Ambush delivers anymore. This week alone, buying Ambush at the old price, it generated more than 5 times the profits of its costs trading the small Ambush All-Stars portfolio!
So don't miss your chance to get Ambush still at a bargain. Odds are price will increase further in the future and you will never be able to get on board at such a low price again.
The price of Ambush will rise significantly on September 17th, this is your chance to get it at a bargain price!
© by Marco Mayer. Re-transmission or reproduction of any part of this material is strictly prohibited without the prior written consent of Trading Educators, Inc.
On Vacation
by Master Trader Marco Mayer
Educator for Forex and Futures, Systematic Trader, and
Creator of Ambush Trading Method and AlgoStrats.com
I am having a great vacation traveling in South Germany to enjoy the last days of the summer and to visit family and friends. We started in Munich for a weekend, then to Heidelberg, and are now enjoying the last week in Black Forest hiking and mountain biking! Fortunately, we had two weeks of nothing but sunshine! Here's a few of my favorite pictures while on vacation.


Learn all you need to know about AlgoStrats:FX during this presentation by Marco Mayer. What is it, what's the idea behind it, why it is different from other services and how you'd profit from AlgoStrats:FX as a subscriber!
Join AlgoStrats:FX today!

Feel free to email questions to This email address is being protected from spambots. You need JavaScript enabled to view it., or post it in our Blog or Forum. Follow me on Facebook and Twitter!
© by Marco Mayer. Re-transmission or reproduction of any part of this material is strictly prohibited without the prior written consent of Trading Educators, Inc.

Check out our Blog!
To view previous published Chart Scan newsletters, please log in or click on "Join Us,"
shown above, to subscribe to our free "Members Only" section.
A WEALTH OF INFORMATION & EDUCATION:
Joe Ross-Trading Educators' popular free Chart Scan Newsletter has been published since 2004.
Note: Unless otherwise noted, all charts used in Chart Scan commentary were created
by using Genesis Financial Technologies' Trade Navigator (with permission).
Legal Notice and Copyright 2016 Disclaimer - Published by Trading Educators, Inc.
Chart Scan is a complimentary educational newsletter.
© by Trading Educators, Inc. Re-transmission or reproduction of any part of this material is strictly prohibited without prior written consent.
Edition 639 - September 9, 2016
"Wisdom is found on the lips of a Trader who has understanding, but a rod is for the back of a Trader who is devoid of understanding." Master Trader Joe Ross
The Law of Charts with Commentary
by Master Trader Joe Ross
Author, Trader, Trading Mentor, and Founder of Trading Educators, Inc.
MARKET CONDITIONS
Quite often I am asked about what condition a market has to be in to be tradable. Sometimes it is easier to show with a picture when a market is not tradable other than to be a very short-term scalper.
When prices have a "boxy look to them, the market becomes very difficult to trade. What causes a boxy look? If you look closely at the chart, I will attempt to explain.
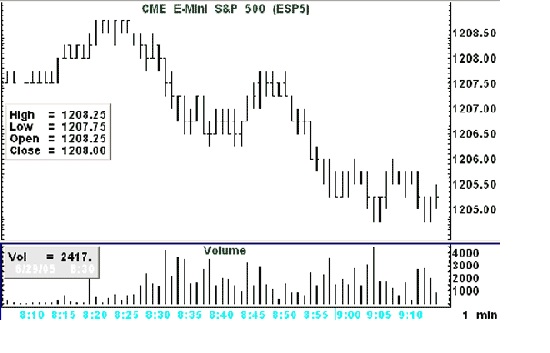
Notice the following:
- Volume at 8:30, the opening minute is only 2,417. 3 minutes later the per minute volume is 4,193, an acceptable amount it would seem. But is it? Volume does not take into consideration liquidity. Liquidity consists of both decent volume and good participation, meaning buyers are hitting the offer and sellers are hitting the bid. The volume of 4,193 might have involved as few as two traders.
- Prices tend to make multiple exact highs and lows, giving the chart a boxy look.
- Opens and Closes tend to cluster at the same level.
- Prices do not look much different from the way they looked in the early morning Globex trading.
If we go to a 5-minute chart things do not look a whole lot better.
Volume in the first 5 minutes of trading was 11,580, which amounts to an average of only 2,316 contract/minute. Not a very healthy volume for doing much of anything. The 5 minute chart displays the same type of problems we saw on the 1 minute chart. Double highs and lows, and clusters of Opens and Closes. The "boxiness" of the 5 minute chart is a sign of lack of liquidity. All this means that traders are not trading. The action that is going on is limited to a few traders who are literally picking each others´ pockets.
The e-mini S&P 500 has often been as you see it on the charts above. The situation goes back on and off for at least 10 years. Is it any wonder that 90% or more of newbies are getting their heads handed to them in this market? Unless you go out to the larger time frames you are facing a very difficult situation.
© by Joe Ross. Re-transmission or reproduction of any part of this material is strictly prohibited without the prior written consent of Trading Educators, Inc.
DON'T CATCH A BAD MOOD
by Master Trader Joe Ross
Author, Trader, Trading Mentor, and Founder of Trading Educators, Inc.
Winning traders are eternal optimists. They must be to survive. Markets are constantly changing. What works in one market doesn't necessarily work in another. You can't complacently expect to perfect a trading strategy or method at a particular point in time and expect it to work forever. But many traders hold these unrealistic expectations. It's common to hear even a seasoned trader complain, "It's all a sham. There's no way to make money in trading anymore. The amateurs have left and there's no way to take profits from professionals." It can shake your confidence to hear such a bleak outlook. It can make you feel as if you might as well just throw in the towel and put your money in a mutual fund. But if you want to master the markets and take home huge profits, you can't let pessimists sway you. Don't catch their bad mood. Stay optimistic, sharpen your skills, and remain ahead of the crowd.
Seasoned traders have seen markets change over and over. They'll warn you that to stay profitable, it's necessary to continually search for new ways to trade profitably. This fact of trading can provide comfort when you hear your friends complain about how "it's all changed" and there's no longer a viable way to make a profit.
Sure, it's not going to be easy, but it's always possible. Acknowledging that trading is hard can actually soothe you. If you know that it's not your fault that market conditions change, then there's no reason to feel pessimistic and beat yourself up. It's not your fault. You didn't do anything wrong. Change is merely the nature of the beast. Your job is to avoid giving into pessimism. Instead, you must continually pick yourself up after being thrown down and courageously face market challenges with a fighting spirit.
An optimistic attitude alone isn't going to guarantee success, but it's an essential prerequisite for continuing to stay profitable. To stay on top, you're going to have to think creatively and you might have to change the way you've been doing things. Maybe you can't make as much profit as you were used to making on merely a few trades. Perhaps, you have to make more trades or just expect less per trade. Maybe you have to move into new sectors or into trading commodities or bonds. Again, it's not going to be simple, but with effort and practice, you can learn to adapt your trading style to new circumstances, instead of catching the pessimism that is rampant when the majority of traders are losing.
So when you hear a novice or old-timer complain, "it's impossible to make a profit," don't let it shake your resolve. Don't catch a bad mood. Everyone is different. You're different from other traders. You have your own resources and your own style. Maybe your friend with a bad attitude is right. Maybe he or she can't trade the markets anymore. Maybe his or her account is too big or too small. Whatever the issue is, don't make it your problem. Just go your own merry way and keep searching for a new set of tools that will make you profitable. They are out there. All you have to do is persistently search until you find them.
© by Joe Ross. Re-transmission or reproduction of any part of this material is strictly prohibited without the prior written consent of Trading Educators, Inc.
CHK Trade
Instant Income Guaranteed
Developer: Joe Ross
Administration and New Developments: Philippe Gautier
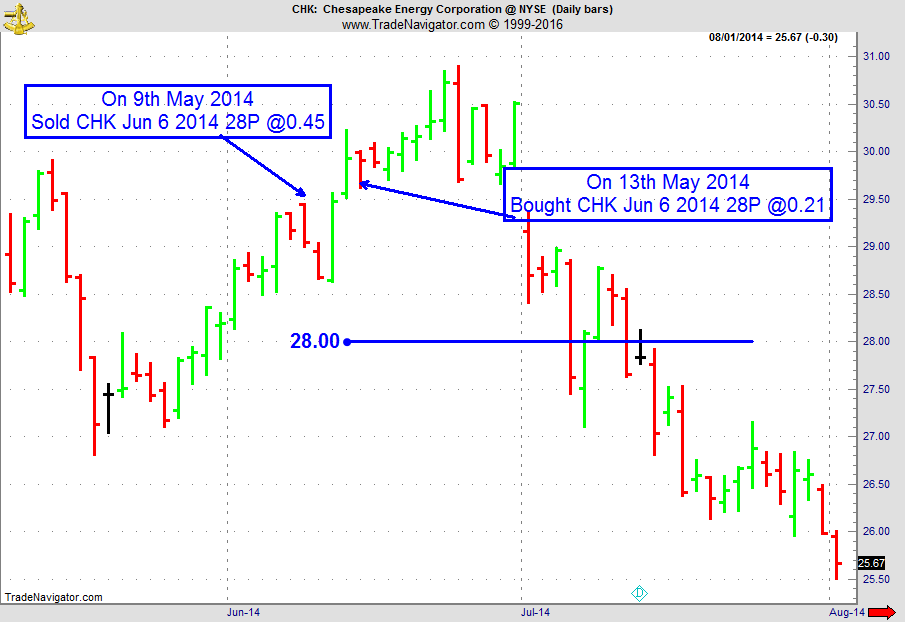
On 8th May 2014, we gave our IIG subscribers the following trade on CHK, which was in an established uptrend. We decided to sell price insurance as follows the following day:
- On 9th May 2014, we sold CHK June 06 2014 28P @ $0.45, i.e. $45 per option sold; the short strike was slightly below price action (4% away) but below the last support level, with only 27 days to expiration.
- On 13th May 2014, we bought back CHK June 06 2014 28P @ $0.21, after 4 days in the trade.
Profit: $24
Margin: $560
Return on Margin Annualized: 391.07%
We have also added new types of trades for our IIG daily guidance, "no loss" propositions with unlimited upside potential, still using other people's money to trade.
Philippe
Receive daily trade recommendations - we do the research for you!
Instant Income Guaranteed
♦ SIGN UP TODAY! THIS IS WORTH THE INVESTMENT ♦
This includes a daily 80+ page report along with a daily podcast!
We review and supply the following:
-
our daily fills (entries, exits)
-
full real-time statistics of our weekly trades, closed trades for the current month, monthly statistics (detail and summary) since the beginning of IIG
-
daily market commentary (indices/sectors, volatility indices, main commodities related to our trade)
-
new trades for the following day
-
comments on our open trades, with all relevant news
-
updated earnings dates for our open positions
-
full details (days in trade, days to expiration, underlying close and price change, etc.) on our open trades (classic trades, complex positions, remaining rolled trades and covered calls)
-
active good till cancelled orders
-
dividends for the stocks owned
We also supply quite a number of extra "slides" in the appendix which are quite useful for new subscribers: recommendations, answers and explanations on the most frequent questions, techniques for entering trades, historical trades and real life examples, broker information, etc.
© by Joe Ross and Philippe Gautier. Re-transmission or reproduction of any part of this material is strictly prohibited without the prior written consent of Trading Educators, Inc.
Trading Idea
by Master Trader Andy Jordan
Educator for Spreads, Options, Swing/Day Trading, and Editor of Traders Notebook
Let's check out a spread trading idea using the Softs at the ICE going long the March 2017 Sugar and short the May 2017 Sugar.
Traders Notebook - Receive Daily Trade recommendations
Sign up today!
© by Andy Jordan. Re-transmission or reproduction of any part of this material is strictly prohibited without the prior written consent of Trading Educators, Inc.
This Week's Blog Post - Becoming a Consistent Winner
by Master Trader Andy Jordan
Educator for Spreads, Options, Swing/Day Trading, and Editor of Traders Notebook
Don't underestimate your time it takes to become a profitable trader! Read more.
© by Andy Jordan. Re-transmission or reproduction of any part of this material is strictly prohibited without the prior written consent of Trading Educators, Inc.
The price of Ambush Trading Method will increase to $1,299 on September 17, 2016.
Use coupon code "ambush10" to get an additional 10% off the current price.
Coupon is valid only through September 16, 2016 on the current price. No exceptions.
Coupon is valid for the Ambush only. It is not valid for the Ambush/Stealth combo.
Grab a copy at the current price while you still can!
Ambush Trading Method - Update
by Master Trader Marco Mayer
Educator for Forex and Futures, Systematic Trader, and
Creator of Ambush Trading Method and AlgoStrats.com
As Ambush continues this years gold rush across many markets, we did another update of our Futures Performance Page.
Additionally to up-to-date reports for each single market, there's three sample baskets of portfolios showing you the power of diversification trading Ambush in multiple markets!
Here's one of them for small account ($25k+) trading ES, 6A, NG and ZN:
The price of Ambush will rise significantly on September 17th, this is your chance to get it at a bargain price!
© by Marco Mayer. Re-transmission or reproduction of any part of this material is strictly prohibited without the prior written consent of Trading Educators, Inc.
AlgoStrats.com - AlgoStrats:FX
by Master Trader Marco Mayer
Educator for Forex and Futures, Systematic Trader, and
Creator of Ambush Trading Method and AlgoStrats.com
Learn all you need to know about AlgoStrats:FX during this presentation by Marco Mayer. What is it, what's the idea behind it, why it is different from other services and how you'd profit from AlgoStrats:FX as a subscriber!
Join AlgoStrats:FX today!
Feel free to email questions to This email address is being protected from spambots. You need JavaScript enabled to view it., or post it in our Blog or Forum. Follow me on Facebook and Twitter!
© by Marco Mayer. Re-transmission or reproduction of any part of this material is strictly prohibited without the prior written consent of Trading Educators, Inc.

Check out our Blog!
To view previous published Chart Scan newsletters, please log in or click on "Join Us,"
shown above, to subscribe to our free "Members Only" section.
A WEALTH OF INFORMATION & EDUCATION:
Joe Ross-Trading Educators' popular free Chart Scan Newsletter has been published since 2004.
Note: Unless otherwise noted, all charts used in Chart Scan commentary were created
by using Genesis Financial Technologies' Trade Navigator (with permission).
Legal Notice and Copyright 2016 Disclaimer - Published by Trading Educators, Inc.
Chart Scan is a complimentary educational newsletter.
© by Trading Educators, Inc. Re-transmission or reproduction of any part of this material is strictly prohibited without prior written consent.
Edition 638 - September 2, 2016
Grab a copy at the current price while you still can. The price of Ambush Trading Method will increase to $1,299 of September 17, 2016. Use coupon code "ambush10" to get an additional 10% off the current price. Coupon is valid only through September 16, 2016 on the current price. No exceptions. Coupon is valid for the Ambush only. It is not valid for the Ambush/Stealth combo.
The Law of Charts with Commentary
by Master Trader Joe Ross
Author, Trader, Trading Mentor, and Founder of Trading Educators, Inc.
CCI
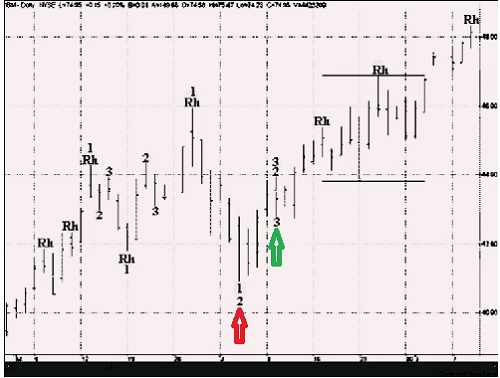
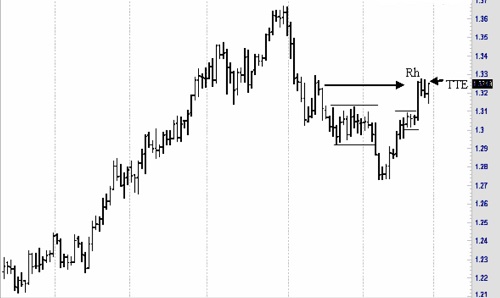
The lesson we want to gain from the chart below is how to anticipate the direction of a breakout from an area of consolidation – in this case a rather sloppy-looking congestion.
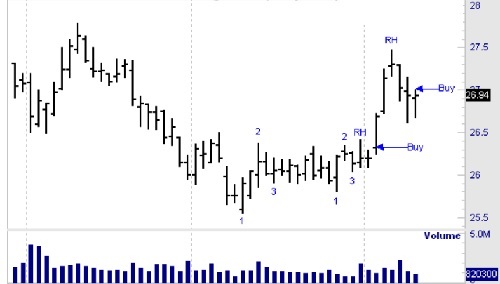
Notice that shortly after prices began to move sideways, at the end of the trend there was a 1-2-3 formation. However prices failed to violate the #2 point. Instead they moved into a tight consolidation containing too many price bars to be considered a ledge (10 bars limit). Within the congested area, a second 1-2-3 formed. This was followed by a Ross hook (Rh).
In anticipation of a breakout to the upside, a buy stop could have been placed as shown. The second 1-2-3 formation defined a trend. The Rh established the trend. A few days later, a second Ross hook formed. The last "buy" involves an ideal Traders Trick Entry, the kind we show people in our recorded Traders Trick webinar. Over the years there have been several refinements to the Traders Trick. In the recorded webinar, we show you how to receive a very high percentage of wins using the Traders Trick with the various refinements.
© by Joe Ross. Re-transmission or reproduction of any part of this material is strictly prohibited without the prior written consent of Trading Educators, Inc.
Does volume figure into your trading?
by Master Trader Joe Ross
Author, Trader, Trading Mentor, and Founder of Trading Educators, Inc.
It didn’t in the past because volume figures, when trading the daily charts, were a day late and a dollar short. But these days, where volume is live, it does count.
At Trading Educators we use both contract volume and tick volume as a guideline and filter for our trading.
Here’s a simple idea that works well for indexes. Most people ignore volume as an indicator. I think it’s overlooked and I will show you here how to use it to figure out possible turns in the market. The concept is that of a volume spike. If you will look at just about any weekly chart of the E-mini S&P 500, you will see what I'm talking about. Note the volume spikes that occur at the turning points in the market. This occurs when large numbers of contracts change hands. Usually it happens when the smaller trader gives up and sells his contracts. If enough traders do this at once and the price is right the professionals will come in and snatch up those contracts.
Therefore you have a large volume that occurs right at the bottom of a decline as the market is churning. The contracts move from the weak hands (the man on the street) to the strong hands (professionals).You need to look for volume that is larger than the last 10 bars´ volume. This is not cast in stone but is generally a good average to go by. You might decide that 8 bars are enough, it´s up to you. It also helps if the volume is substantially larger than the previous volume and is accompanied by a large downward move in price. I wouldn’t necessarily trade this as a standalone indicator but use it as a general warning of a possible change in Market direction. Does this work with intraday charts?
Absolutely. Volume is important.
© by Joe Ross. Re-transmission or reproduction of any part of this material is strictly prohibited without the prior written consent of Trading Educators, Inc.
WYNN Trade
Instant Income Guaranteed
Developer: Joe Ross
Administration and New Developments: Philippe Gautier
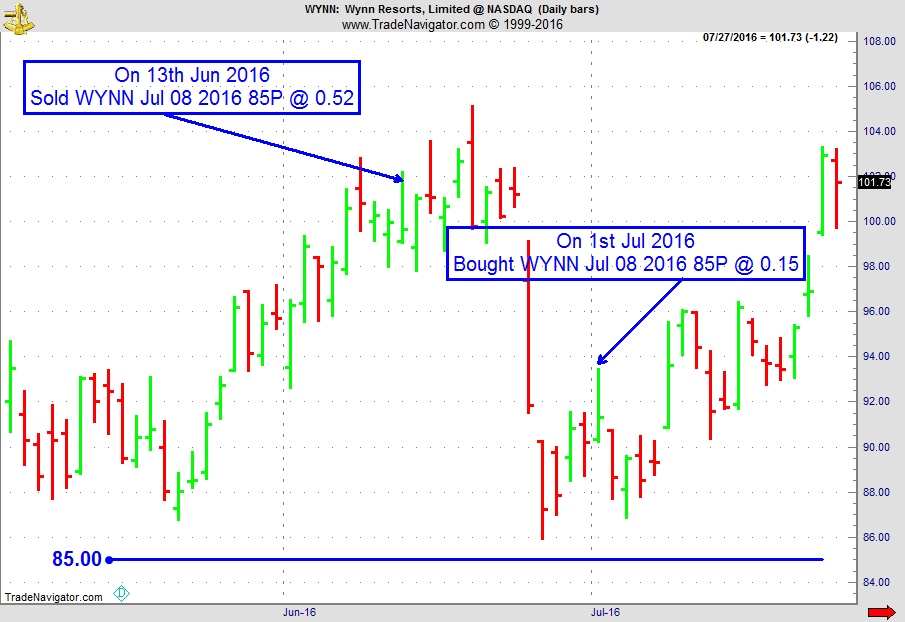
On 12th June 2016, we gave our IIG subscribers the following trade on WYNN, which was in an established uptrend, and was still under accumulation. We decided to sell price insurance as follows the following day:
- On 13th June 2016, we sold WYNN July 08 2016 85P @ $0.52, i.e. $52 per option sold; the short strike was well below price action (15% away) and below a major support level, so that the trade was safe, with only 25 days to expiration.
- On 1st July 2016, we bought back WYNN July 08 2016 85P @ $0.15, after 18 days in the trade; we easily "survived" the strong down move which happened 9 trading days after our entry, thanks to quick the time decay and our safely placed short strike.
Profit: $37
Margin: $1,700
Return on Margin Annualized: 44.13%
We have also added new types of trades for our IIG daily guidance, "no loss" propositions with unlimited upside potential, still using other people's money to trade.
Philippe
Receive daily trade recommendations - we do the research for you!
Instant Income Guaranteed
♦ SIGN UP TODAY! THIS IS WORTH THE INVESTMENT ♦
This includes a daily 80+ page report along with a daily podcast!
We review and supply the following:
-
our daily fills (entries, exits)
-
full real-time statistics of our weekly trades, closed trades for the current month, monthly statistics (detail and summary) since the beginning of IIG
-
daily market commentary (indices/sectors, volatility indices, main commodities related to our trade)
-
new trades for the following day
-
comments on our open trades, with all relevant news
-
updated earnings dates for our open positions
-
full details (days in trade, days to expiration, underlying close and price change, etc.) on our open trades (classic trades, complex positions, remaining rolled trades and covered calls)
-
active good till cancelled orders
-
dividends for the stocks owned
We also supply quite a number of extra "slides" in the appendix which are quite useful for new subscribers: recommendations, answers and explanations on the most frequent questions, techniques for entering trades, historical trades and real life examples, broker information, etc.
© by Joe Ross and Philippe Gautier. Re-transmission or reproduction of any part of this material is strictly prohibited without the prior written consent of Trading Educators, Inc.
Trading Idea
by Master Trader Andy Jordan
Educator for Spreads, Options, Swing/Day Trading, and Editor of Traders Notebook
On August 22nd our method “Stealth Trader” generated an entry signal for the next trading day. We got short with 2 contracts: September Copper (first red arrow), and we reached our first target on the third day (first blue arrow). We trailed the stop for the second lot at the high of each daily bar, and got stopped out on August 26th with a nice profit (second blue arrow).
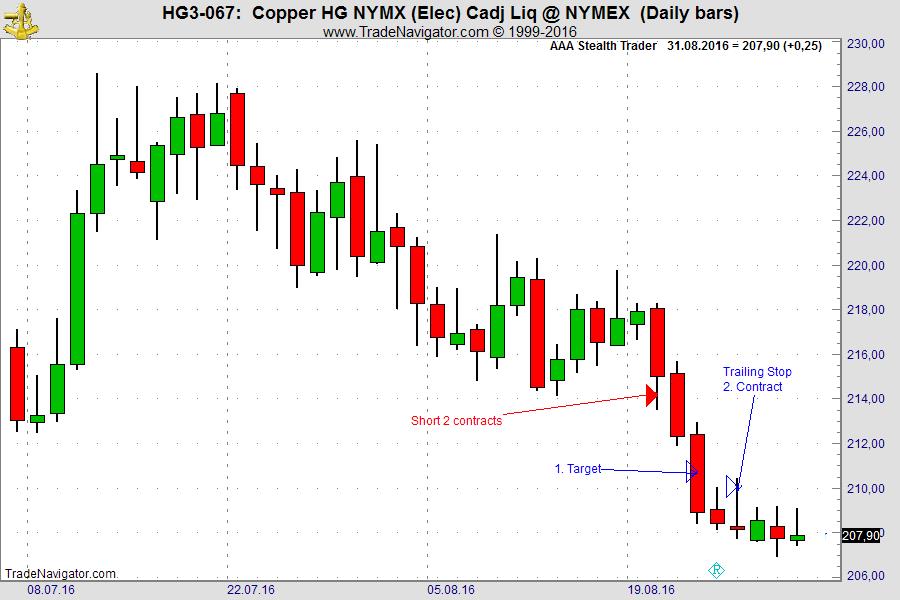
With an initial risk of approx. $840 per contract, the method generated a profit of $1,843 (trading two contracts).
Learn more about Stealth Trading!
© by Andy Jordan. Re-transmission or reproduction of any part of this material is strictly prohibited without the prior written consent of Trading Educators, Inc.
This Week's Blog Post - Learning from Mistakes
by Master Trader Andy Jordan
Educator for Spreads, Options, Swing/Day Trading, and Editor of Traders Notebook
If you make mistakes during trading, go back in your mind to see what you could have done better, or differently. There is usually something to learn from each...read more.
© by Andy Jordan. Re-transmission or reproduction of any part of this material is strictly prohibited without the prior written consent of Trading Educators, Inc.
This Week's Blog Post - Trading on Vacation: Good or Bad Idea?
by Master Trader Marco Mayer
Educator for Forex and Futures, Systematic Trader, and
Creator of Ambush Trading Method and AlgoStrats.com
Should you take your laptop to the beach to trade, or just close out all positions and forget about the markets for two weeks? Marco is just leaving for vacation, he'll let you know how he handles this as a systematic trader. Read more to find out!
© by Marco Mayer. Re-transmission or reproduction of any part of this material is strictly prohibited without the prior written consent of Trading Educators, Inc.
AlgoStrats.com - AlgoStrats:FX
by Master Trader Marco Mayer
Educator for Forex and Futures, Systematic Trader, and
Creator of Ambush Trading Method and AlgoStrats.com
Learn all you need to know about AlgoStrats:FX during this presentation by Marco Mayer. What is it, what's the idea behind it, why it is different from other services and how you'd profit from AlgoStrats:FX as a subscriber!
Join AlgoStrats:FX today!
Feel free to email questions to This email address is being protected from spambots. You need JavaScript enabled to view it., or post it in our Blog or Forum. Follow me on Facebook and Twitter!
© by Marco Mayer. Re-transmission or reproduction of any part of this material is strictly prohibited without the prior written consent of Trading Educators, Inc.
Check out our Blog!
To view previous published Chart Scan newsletters, please log in or click on "Join Us,"
shown above, to subscribe to our free "Members Only" section.
A WEALTH OF INFORMATION & EDUCATION:
Joe Ross-Trading Educators' popular free Chart Scan Newsletter has been published since 2004.
Note: Unless otherwise noted, all charts used in Chart Scan commentary were created
by using Genesis Financial Technologies' Trade Navigator (with permission).
Legal Notice and Copyright 2016 Disclaimer - Published by Trading Educators, Inc.
Chart Scan is a complimentary educational newsletter.
© by Trading Educators, Inc. Re-transmission or reproduction of any part of this material is strictly prohibited without prior written consent.
Edition 637 - August 26, 2016
Time, after time, after time we hear from traders who are ready to throw in the towel, call it quits, or hang up their trading hat. There's a common misconception that trading is easy, a fast way to earn money (a fast way to lose money too), or a program that has unbelievable returns. It takes years for your trading skills to reach a consistent level of gains. You should consider investing in yourself before walking away. Our traders have years of experience and have been through the good, the bad, and the ugly. Be smart and use the best resources which are right in front of you, our traders are here to help. It could be a simple tweak, major overhaul, or needing to trade in a different market. Whatever it may be, we are here to help. Invest in yourself!
The Law of Charts with Commentary
by Master Trader Joe Ross
Author, Trader, Trading Mentor, and Founder of Trading Educators, Inc.
1-2-3
Quite often I am asked to give an example of a #2 and a #1 point occurring on the same bar. While it doesn’t happen often, it does happen. My friend and superb trader, Marshall Sass, sent me this one. Here’s what he said:
“Here's an interesting situation on a chart. In 10 years of IBM daily data, it came up once. The bar of interest is pointed to by the black arrow. A 123 low and a 123 high both get their full correction by this same bar. This bar is 2 bars after the 3 point for both cases.”
If you look carefully, you will see a 1-2 on the same bar as well as a 2-3 on the same bar.
© by Joe Ross. Re-transmission or reproduction of any part of this material is strictly prohibited without the prior written consent of Trading Educators, Inc.
An Interesting Problem
by Master Trader Joe Ross
Author, Trader, Trading Mentor, and Founder of Trading Educators, Inc.
An example:
Trade 1: Buy 3 Dec Corn at 200.
Trade 2: Buy 2 Dec Corn at 210.
Trade 3: Sell 4 Dec Corn at 220.
What is your position?
Are you long 1 Dec Corn at 200 or at 210?
Do you randomly select which one or is there a generally accepted selection at the brokerage? - first in first out or last in first out...
Answer: You are long at 200. Last-in First-out (LIFO).
By the way, trading in the FOREX is different: They use First in First Out (FIFO).
© by Joe Ross. Re-transmission or reproduction of any part of this material is strictly prohibited without the prior written consent of Trading Educators, Inc.
POM Trade
Instant Income Guaranteed
Developer: Joe Ross
Administration and New Developments: Philippe Gautier
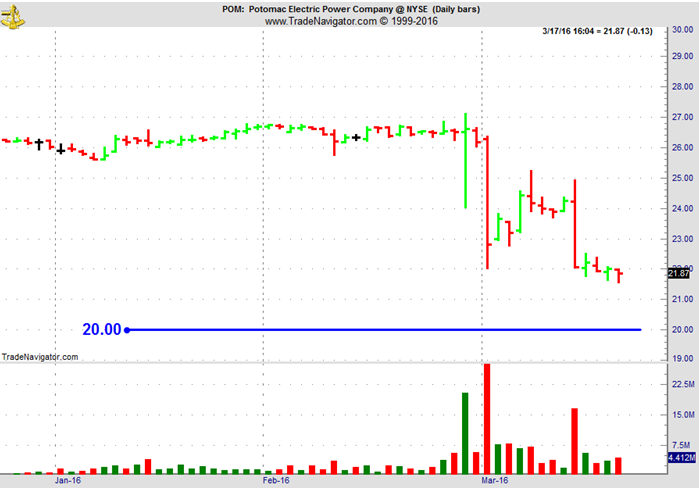
On 17th March 2016, we gave our IIG subscribers the following trade on POM, a natural gas and electricity company which had been in a take over deal with EXC (Excelon) for nearly 2 years at $27.25 per share. We advised to take only a position we would be comfortable being assigned:
- On 18th March 2016, we sold POM April 15 2016 20P @ $0.50, ie. $50 per option sold, with 27 days to expiration.
- On 23rd March 2016, we bought back POM April 15, 2016 20P @ $0.20, after 5 days in the trade, for quick premium compounding, as D.C. regulators approved Exelon-Pepco deal and the stock shot up 27.7% on the news.
Profit: $30
Margin: $400
Return on Margin Annualized: 547.50%
We have also added new types of trades for our IIG daily guidance, "no loss" propositions with unlimited upside potential, still using other people's money to trade.
Philippe
Receive daily trade recommendations - we do the research for you!
Instant Income Guaranteed
♦ SIGN UP TODAY! THIS IS WORTH THE INVESTMENT ♦
This includes a daily 80+ page report along with a daily podcast!
We review and supply the following:
-
our daily fills (entries, exits)
-
full real-time statistics of our weekly trades, closed trades for the current month, monthly statistics (detail and summary) since the beginning of IIG
-
daily market commentary (indices/sectors, volatility indices, main commodities related to our trade)
-
new trades for the following day
-
comments on our open trades, with all relevant news
-
updated earnings dates for our open positions
-
full details (days in trade, days to expiration, underlying close and price change, etc.) on our open trades (classic trades, complex positions, remaining rolled trades and covered calls)
-
active good till cancelled orders
-
dividends for the stocks owned
We also supply quite a number of extra "slides" in the appendix which are quite useful for new subscribers: recommendations, answers and explanations on the most frequent questions, techniques for entering trades, historical trades and real life examples, broker information, etc.
© by Joe Ross and Philippe Gautier. Re-transmission or reproduction of any part of this material is strictly prohibited without the prior written consent of Trading Educators, Inc.
Trading Plan Series - Part 7
by Master Trader Andy Jordan
Educator for Spreads, Options, Swing/Day Trading, and Editor of Traders Notebook
In Part 7 of the Trading Plan Series, Andy talks about Risk and Money Management. Probably the most important part of the whole Trading Plan!
View other videos in Andy's trading plan series:
Trading Plan Part 1 - The trading plan.
Trading Plan Part 2 - Who needs a trading plan? What will a trading plan do for you?
Trading Plan Part 3 - It is important to know yourself and your purpose.
Trading Plan Part 4 - How to set the right trading goals.
Trading Plan Part 5 - Explains the markets, time frames, trading vehicle, brokers, software, and much more.
Trading Plan Part 6 - What to do each day before the real trading activity starts.
This Week's Blog Post - Do I Deserve To Win
by Master Trader Andy Jordan
Educator for Spreads, Options, Swing/Day Trading, and Editor of Traders Notebook
The world's most successful traders believe in themselves and their ability to win. In fact, many of them feel that they “own” the market. They are not necessarily being...read more.
© by Andy Jordan. Re-transmission or reproduction of any part of this material is strictly prohibited without the prior written consent of Trading Educators, Inc.

AlgoStrats.com - AlgoStrats:FX Update
by Master Trader Marco Mayer
Educator for Forex and Futures, Systematic Trader, and
Creator of Ambush Trading Method and AlgoStrats.com
I’d like to give you an update on what happened trading AlgoStrats:FX during this week.
Or what didn't happen as we hardly got any signals this week. Sort of funny considering I wrote an article about why trading actually is quite boring. This week was especially true in the FX markets and, looking at some charts, this isn’t very surprising. On the daily chart of the US Dollar Index, we can see a really tight consolidation going on for days, with most days closing almost unchanged. Until Wednesday, literally nothing had happened, and most other currency markets looked pretty much the same:
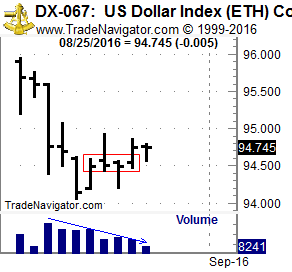
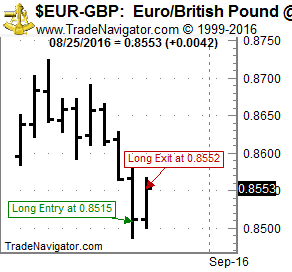
Because of this, we got no signals for three days in a row which doesn’t happen too often. Finally, on Wednesday the markets, especially the EUR and GBP pairs, moved and we got into 4 trades which we could all close with profits on Thursday. One of these trades happened in EUR/GBP (see chart). Yesterday, again no signals, so we finish this dull week with a profit of about 0.5% on the live trading account which isn’t too bad!
Learn all you need to know about AlgoStrats:FX during this presentation by Marco Mayer. What is it, what's the idea behind it, why it is different from other services and how you'd profit from AlgoStrats:FX as a subscriber!
Join AlgoStrats:FX today!
Feel free to email questions to This email address is being protected from spambots. You need JavaScript enabled to view it., or post it in our Blog or Forum. Follow me on Facebook and Twitter!
© by Marco Mayer. Re-transmission or reproduction of any part of this material is strictly prohibited without the prior written consent of Trading Educators, Inc.
This Week's Blog Post - (Good) Trading Happens Outside of Your Comfort Zone
by Master Trader Marco Mayer
Educator for Forex and Futures, Systematic Trader, and
Creator of Ambush Trading Method and AlgoStrats.com
In his latest blog post "(Good) Trading happens outside of your comfort zone," Marco challenges another misconception about trading. Does trading have to feel good, should you always do what feels comfortable? Or do the best trades actually happen outside of your comfort zone? Read more to find out!
© by Marco Mayer. Re-transmission or reproduction of any part of this material is strictly prohibited without the prior written consent of Trading Educators, Inc.
Check out our Blog!
To view previous published Chart Scan newsletters, please log in or click on "Join Us,"
shown above, to subscribe to our free "Members Only" section.
A WEALTH OF INFORMATION & EDUCATION:
Joe Ross-Trading Educators' popular free Chart Scan Newsletter has been published since 2004.
Note: Unless otherwise noted, all charts used in Chart Scan commentary were created
by using Genesis Financial Technologies' Trade Navigator (with permission).
Legal Notice and Copyright 2016 Disclaimer - Published by Trading Educators, Inc.
Chart Scan is a complimentary educational newsletter.
© by Trading Educators, Inc. Re-transmission or reproduction of any part of this material is strictly prohibited without prior written consent.
Edition 636 - August 19, 2016
We were recently asked just what are commodities? This is how we replied. Enjoy!
The Law of Charts with Commentary
by Master Trader Joe Ross
Author, Trader, Trading Mentor, and Founder of Trading Educators, Inc.
Exchange Traded Fund also known as "ETFs" or IShares
This was written awhile ago, but a good one to share with you. The Australian dollar had been rising against the U.S. dollar. I had been in the Aussie dollar for at least 3 years. In addition to dollar deposits using Australian interest bearing notes I had begun trading IShares. IShares are an index of some of the top companies in Australia. It is through ETFs that a trader can trade in another nation and still have the convenience of trading in the U.S. using U.S. dollars. Australian companies had been doing quite well supplying China with foodstuffs and raw materials. But in addition to the fat profits these companies were making, their stocks were rising because of the gain at the time of the Aussie Dollar against the U.S. currency. Trading or investing this way is a great way to hedge against a falling U.S. dollar.
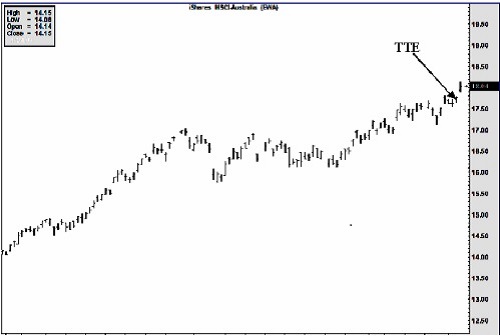
One day, EWA offered up a Traders Trick for entry on March 3rd at a price of 17.74, 1 tick above the high of March 2nd. Entry was possible at that price and the shares Closed on March 4th at 18.04 for a gain of 30 cents, or $300 on 1,000 shares.
The Law of Charts and the Traders Trick work in all markets, even markets as little known as Exchange Traded Funds.
© by Joe Ross. Re-transmission or reproduction of any part of this material is strictly prohibited without the prior written consent of Trading Educators, Inc.
DISCIPLINE
by Master Trader Joe Ross
Author, Trader, Trading Mentor, and Founder of Trading Educators, Inc.
I received the following question:
"When you were teaching us at our forex office in Florida, you stressed discipline. Our head trader stresses discipline. What I want to know is if discipline can be acquired or is it just something you are born with? I’m having trouble finding it in myself."
Personally, I believe discipline can be learned, although at times it is very painful. When I began trading, I was an undisciplined person. But trading and the markets forced me to become disciplined. Was the discipline already there and just needed to be extracted? Or did I actually learn it? I can’t really be sure. I was a delinquent as a boy. I was in rebellion against all authority. I hated teachers and I hated school. I was really struggling with life as a young man.
One of the largest private trading firms, 1,500 S&P day traders, kept their offices near yeshivas. A yeshiva is a rabbinical school, which produces rabbis of the Jewish religion. The students coming out of the yeshiva were highly disciplined and made excellent traders. Was the discipline innate in those yeshiva students? Or did they learn it under the strict supervision of the rabbis who controlled their lives? I think they learned it.
I’ve mentioned previously that it can help to keep a journal if you want to learn discipline. The journal I kept was very basic and included what trades I made during the day and my reasons for getting into the trade. It is what I did with the journal that helped me to be disciplined. Anyone can make entries into a journal. I let the contents of my journal keep me in line. It became my supervisor. I took to heart what I wrote there. I no longer keep that kind of journal because it has served its purpose in making discipline into a habit in the way I trade.
© by Joe Ross. Re-transmission or reproduction of any part of this material is strictly prohibited without the prior written consent of Trading Educators, Inc.
DAL Trade
Instant Income Guaranteed
Developer: Joe Ross
Administration and New Developments: Philippe Gautier
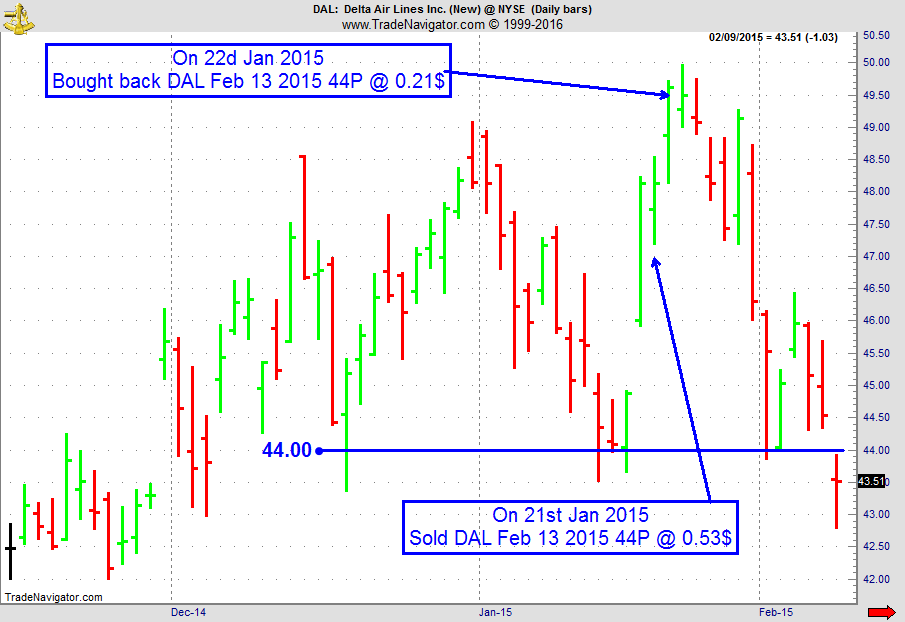
On 20th January 2015, we gave our IIG subscribers the following trade on DAL, which was moving strongly to the upside. As there was short term support around $44, we decided to sell price insurance as follows the following day:
- On 21st January 2015, we sold DAL February 13, 2015 44P @ $0.53, ie. $53 per option sold; with 22 days to expiration.
- On 22nd January 2015, we bought back DAL February, 13 2015 44P @ $0.27, after 1 day in the trade, for quick premium compounding.
Profit: $26
Margin: $880
Return on Margin Annualized: 1,099.15%
We have also added new types of trades for our IIG daily guidance, "no loss" propositions with unlimited upside potential, still using other people's money to trade.
Philippe
Receive daily trade recommendations - we do the research for you!
Instant Income Guaranteed
© by Joe Ross and Philippe Gautier. Re-transmission or reproduction of any part of this material is strictly prohibited without the prior written consent of Trading Educators, Inc.
This Week's Blog Post - Best Way
by Master Trader Andy Jordan
Educator for Spreads, Options, Swing/Day Trading, and Editor of Traders Notebook
Is there a best way of how to enter or exit spread trades? Read my latest blog post to get the answer. Read more.
© by Andy Jordan. Re-transmission or reproduction of any part of this material is strictly prohibited without the prior written consent of Trading Educators, Inc.
This Week's Blog Post - (Good) Trading is Boring
by Master Trader Marco Mayer
Educator for Forex and Futures, Systematic Trader, and
Creator of Ambush Trading Method and AlgoStrats.com
When you start out trading, it’s pretty much all about the excitement. You watch every trade tick by tick, gazing at a chart ticking up and down together your P&L. You’re long. When it goes up, you feel excited because...read more.
AlgoStrats.com - AlgoStrats:FX
by Master Trader Marco Mayer
Educator for Forex and Futures, Systematic Trader, and
Creator of Ambush Trading Method and AlgoStrats.co
![]()
Learn all you need to know about AlgoStrats:FX during this presentation by Marco Mayer. What is it, what's the idea behind it, why it is different from other services and how you'd profit from AlgoStrats:FX as a subscriber!
Join AlgoStrats:FX today!
Feel free to email questions to This email address is being protected from spambots. You need JavaScript enabled to view it., or post it in our Blog or Forum. Follow me on Facebook and Twitter!
© by Marco Mayer. Re-transmission or reproduction of any part of this material is strictly prohibited without the prior written consent of Trading Educators, Inc.
Check out our Blog!
To view previous published Chart Scan newsletters, please log in or click on "Join Us,"
shown above, to subscribe to our free "Members Only" section.
A WEALTH OF INFORMATION & EDUCATION:
Joe Ross-Trading Educators' popular free Chart Scan Newsletter has been published since 2004.
Note: Unless otherwise noted, all charts used in Chart Scan commentary were created
by using Genesis Financial Technologies' Trade Navigator (with permission).
Legal Notice and Copyright 2016 Disclaimer - Published by Trading Educators, Inc.
Chart Scan is a complimentary educational newsletter.
© by Trading Educators, Inc. Re-transmission or reproduction of any part of this material is strictly prohibited without prior written consent.
Edition 635 - August 12, 2016
"Price is what you pay. Value is what you get." ~ Warren Buffett
The Law of Charts with Commentary
by Master Trader Joe Ross
Author, Trader, Trading Mentor, and Founder of Trading Educators, Inc.
EURO/USD
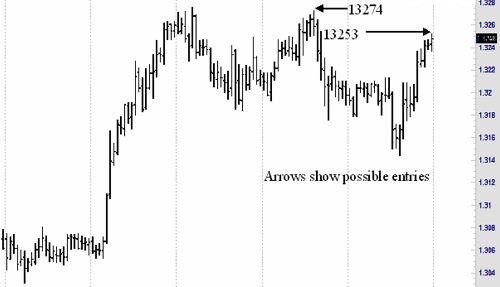
Euro had formed a Ross hook with a Traders Trick entry on the daily chart. Implementation of The Law of Charts teaches that entry signals from a larger time frame can be entered and managed on a lesser time frame. So let’s look first at the daily chart and then see how we might have managed a trade on the chart of a lesser time frame.
We see on the chart a set of matching congestions. Matching congestions are described in my book “Day Trading” and also in my book “Trading Is a Business.”
The Law of Charts states that a Ross hook is the first failure of prices to move higher following a breakout from congestion. The Law also states that one of the best ways to enter such a trade is from a Traders Trick entry. In this case entry would be at 1.3253.
Now let’s go to a lesser time frame for actual entry and management. We’ll use a 60-minute chart.
© by Joe Ross. Re-transmission or reproduction of any part of this material is strictly prohibited without the prior written consent of Trading Educators, Inc.
INTELLECT
by Master Trader Joe Ross
Author, Trader, Trading Mentor, and Founder of Trading Educators, Inc.
Recently, I wrote: "As a human being there is a component working in you that is comprised of the following elements: Your intellect, your emotions, your memory, your imagination, and your will. These elements work together to determine who you are and how you will behave in the market -- actually, in anything and everything you undertake to do." This week we are going to look at "Intellect" to see how this element can defeat you as a trader.
Over decades of trading and teaching others how to trade one of the greatest problem areas that regularly comes up is that of intellect. You might want to think about that for a moment (no pun intended). A component of intellect is "logic." How can logic undermine a trader?
Being intelligent, being a logical thinker, having a high degree of intellect is often the worst thing that can happen to a trader, yet it is those persons having these gifts who are most often attracted to the business of trading.
The problem for these aspiring traders is that there is little to do with logic when it comes to trading in the markets. Markets are driven by emotions, the two most prominent being fear and greed. There is not a shred of logic in either of those emotions. On a purely intellectual level the markets consists of a place to buy and sell. They are places, where to the best of man's ability, a somewhat fair price may be discovered. Finding out a price at which buyers are willing to buy and sellers are willing to sell, seems altogether a logical pursuit. Indeed, this process is called price discovery. Although price discovery is often corrupted by those who are able to manipulate prices it is the best method man has come up with.
On the surface markets appear to be logical and intellectually solvable. However, the truth is that because they are driven by emotions they are actually confusing and chaotic, and anyone trying to put the movement of prices into a box is doomed to failure.
Sadly, the majority of people who are attracted to trading are those who want everything about price movement to make sense. Their attempts at setting boundaries for price movement are truly tragic. They talk about support and resistance as though somehow, magically, those price levels will contain prices. They draw trendlines and defy prices to cross them. They draw angles and pitchforks, speak knowledgeably about Fibonacci ratios, Elliott Waves, MACDs, and so forth as if these concepts had any logic behind them at all.
I'm not saying that any of the above are not tools that can be used in trading, but they must be used with full knowledge of their weaknesses and with full knowledge of what they can actually show. Any and all tools used for trading can fail, and unless a trader is willing to be flexible, there will be little chance for success.
There is no end to knowledge and understanding that must be acquired by a trader. There are no rigid lines, no boxes, no be-all to end-all models that will always work. There are no perfect systems and no perfect methods. The problem with intellect is that its logical element wants safety and assurances. Intellect wants a perfect fit every time. But anyone who has traded with real money, soon finds out that trading simply isn't logical. Prices cannot be confined. Markets are like the proverbial 600 pound gorilla. They go wherever they want to go.
© by Joe Ross. Re-transmission or reproduction of any part of this material is strictly prohibited without the prior written consent of Trading Educators, Inc.
SBUX Trade
Instant Income Guaranteed
Developer: Joe Ross
Administrator: Philippe Gautier
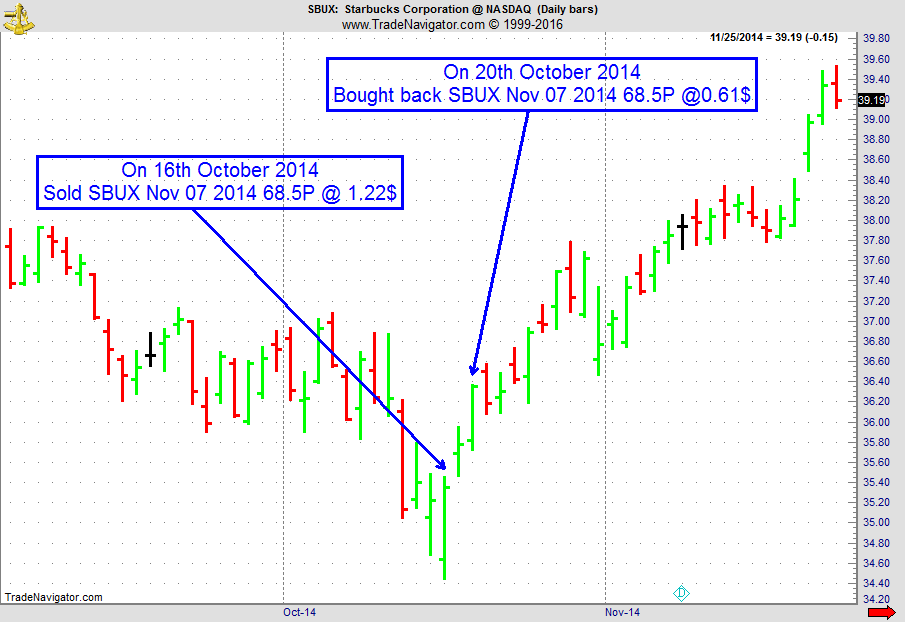
On 15th October 2014 we gave our IIG subscribers the following trade on SBUX. As the stock was bouncing back up around a major support level, we decided to sell price insurance as follows the following day:
- On 16th October 2014, we sold SBUX November 07 2014 68.5P @ $1.22, ie. $122 per option sold; the short strike was below support level, with only 21 days to expiration.
- On 20th October 2014, we bought back SBUX November 07 2014 68.5P @ $0.61, after only 3 days in the trade.
Profit: $61
Margin: $1,370
Return on Margin annualized: 541.73%
Another trade with quick premium compounding.
Philippe
Receive daily trade recommendations - we do the research for you!
Instant Income Guaranteed
© by Joe Ross and Philippe Gautier. Re-transmission or reproduction of any part of this material is strictly prohibited without the prior written consent of Trading Educators, Inc.
This Week's Blog Post - Feeling Neutral
by Master Trader Andy Jordan
Educator for Spreads, Options, Swing/Day Trading, and Editor of Traders Notebook
Some traders unconsciously ratchet their emotions up a notch each time they avoid a trade when the market is not in their favor. So their emotions build, like steam pressure, to higher and higher levels. You can see the anger growing... Read more.
© by Andy Jordan. Re-transmission or reproduction of any part of this material is strictly prohibited without the prior written consent of Trading Educators, Inc.
AlgoStrats.com - AlgoStrats: FX Update
by Master Trader Marco Mayer
Educator for Forex and Futures, Systematic Trader, and
Creator of Ambush Trading Method and AlgoStrats.com
![]()
I’d like to give you an update on what happened trading AlgoStrats:FX during the second week after the Free Trial. We had a quite bumpy start in the first week, see my video from last week, the second week was quite a good one considering that most FX markets barely moved.
Here’s what happened in the live trading account this week (showing close equity balance including open trades):
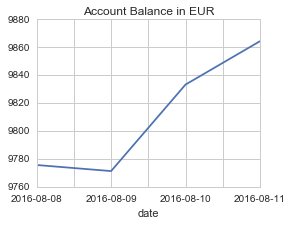
After capturing a profit in EUR/USD on Wednesday we also got into a short trade in USD/CAD which turned out as a nice winning trade:
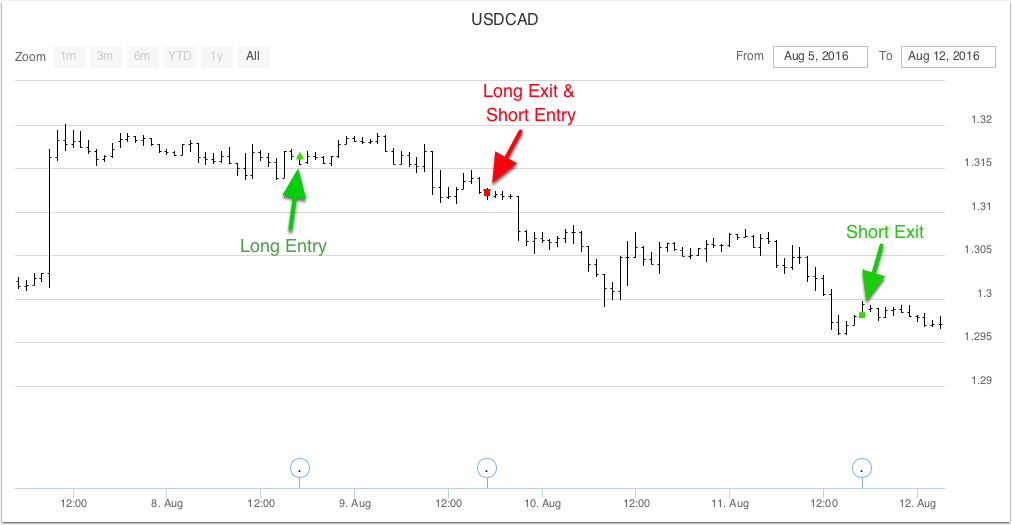
What’s interesting about this trade is that on Monday, we actually got a long signal for USD/CAD speculating for a continuation of last week's move. As this didn’t happen, another system kicked in specialized on capturing such failures on Tuesday, and we reversed the position. This turned out to be a nice trade that we closed out yesterday. One of the big advantages of trading systematically as we do with AlgoStrats:FX is the flexibility that is so hard to have as a discretionary trader. We all know how hard it is to not only close out a trade that doesn’t work out, but to actually reverse it. Luckily, our trading systems don‘t have that issue.
Join AlgoStrats:FX
Feel free to email questions to This email address is being protected from spambots. You need JavaScript enabled to view it., or post it in our Blog or Forum. Follow me on Facebook and Twitter!
© by Marco Mayer. Re-transmission or reproduction of any part of this material is strictly prohibited without the prior written consent of Trading Educators, Inc.
Check out our Blog!
To view previous published Chart Scan newsletters, please log in or click on "Join Us,"
shown above, to subscribe to our free "Members Only" section.
A WEALTH OF INFORMATION & EDUCATION:
Joe Ross-Trading Educators' popular free Chart Scan Newsletter has been published since 2004.
Note: Unless otherwise noted, all charts used in Chart Scan commentary were created
by using Genesis Financial Technologies' Trade Navigator (with permission).
Legal Notice and Copyright 2016 Disclaimer - Published by Trading Educators, Inc.
Chart Scan is a complimentary educational newsletter.
© by Trading Educators, Inc. Re-transmission or reproduction of any part of this material is strictly prohibited without prior written consent.
Edition 634 - August 5, 2016
Trading Educators was founded by Joe Ross and we hold true to his philosophy:
"Teach our students the truth in trading - teach them how to trade,"
and
"Give them a way to earn while they learn - realizing that it takes time to develop a successful trader."
For those new to our company, it's important that you understand this and we are here to help you. We offer quality products and services that assist and create independent traders which is our #1 goal. Feel free to contact any one of our traders. We hope that you have success in your trading, and are always striving to educate and improve yourself.
The Law of Charts with Commentary
by Master Trader Joe Ross
Author, Trader, Trading Mentor, and Founder of Trading Educators, Inc.
Failed Entry?
Consider this week's chart below. On this chart you see what some would call "a failed Traders Trick Entry" following a breakout of the number two point of what at the time was a 1-2-3 high formation. Does this mean that 1-2-3 formations are not valid? The Law of Charts describes a concept, not a method for trading. The 1-2-3 high was there at the time. There is no undoing that fact.
The Traders Trick describes one implementation of The Law of Charts. There are other implementations, and we teach them in our books, at our seminars, and in private one-on-one training sessions.
Does the fact that the Traders Trick seemingly failed mean the Traders Trick is no longer a viable implementation of a 1-2-3 high?
The answer to both questions posed above is trade management — at which point do you realize the trade isn't working out and extract yourself from a bad trade? Believe me, after trading countless thousands of times, I know and know that I know — I will have losses from failed trades.
Now consider this: Entry using the Traders Trick was at 8719. A position trader using only a daily chart for entry and exit could have sustained a loss. I say could have because there is no way for me to know the risk tolerance of another trader.
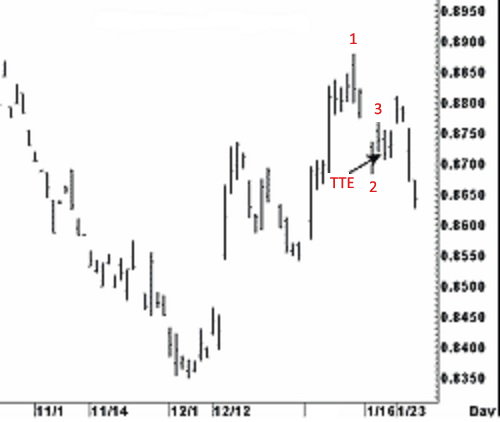
There were 11 possible profit-taking ticks in that trade, ($137.50) as prices move to 8708. Trading a ten-lot in most markets is not going to move the market, and taking 10 ticks offers a high percentage trade. If trade management were correct on a ten lot in a currency futures, $1,375 would have been available.
Let's say a daily position trader placed a first objective to buy back half the position at 10 ticks, with a second order to move the remaining portion of the position to breakeven, contingent upon the first objective being reached. Now, was that a bad trade? Can you see that once you are in a trade, success depends almost entirely on management beyond the initial fill?
In our seminars and one-on-one tutoring, we do not hand you a fish, we teach you how to fish. After that you will no longer need us, other than that we remain friends and mutually successful and profitable traders.
© by Joe Ross. Re-transmission or reproduction of any part of this material is strictly prohibited without the prior written consent of Trading Educators, Inc.
How should you feel about losses? I once read somewhere that you are supposed to love losses. Does that make sense to you? It doesn't to me.
by Master Trader Joe Ross
Author, Trader, Trading Mentor, and Founder of Trading Educators, Inc.
The worst aspect of losing is that it tends to create pessimism. Traders should feel bad when they lose money only if they fought the market trend, or violated their own trading strategies. The best traders have a healthy "so what, big deal!" attitude that maintains a sense of humor about losses. There is no reason to feel bad about losses if the trading discipline was correctly used. On the other hand, there is no reason to learn to love them either.
Analyze losses, learn from them, and then let them go; move on, that's the best thing to do.
Understanding man's relationship to time is one of life's most important challenges. When man becomes free of time's constraints, he lives life to the fullest and achieves goals on his own terms. Pessimism traps traders in the past, destroys their present, and robs them of the future. Imagine a world without time where the thought of death is not a finality of existence. If money were not the reason for your work-related behavior, then who are you? Where are you, and what are you doing? Who shares this existence with you? In the philosophical sense, man creates himself and his existence when he takes responsibility for his actions and his time. Think how any individuals create order, structure, and discipline in their lives. How will you allow a trading loss today affect your life five years from today?
Thinking the wrong way can become self-fulfilling. The trouble with self-fulfillment is that many people have a self-destructive streak. Accident-prone drivers keep destroying their cars, and self-destructive traders keep destroying their accounts. Markets offer unlimited opportunities for self-sabotage, as well as for self-fulfillment. Acting out your internal conflicts in the marketplace is a very expensive proposition.
Traders who are not at peace with themselves often try to fulfill their contradictory wishes in the market. If you do not know where you are going, you will wind up somewhere you never wanted to be.
Every business has losses. I cannot think of any that don't. Shoplifting, embezzlement, internal pilferage, lawsuits, bad debts, spoilage, etc., I'm sure you can think of even more. You name it and businesses have one or more of the many ways to experience losses. Most businesses expect and accept such losses as part of doing business. Why, then, is it such a big deal when you have a loss in trading? If you know the answer to that, please let me know.
The way I handle a loss is this: I examine it, make every attempt to learn from it, and ascertain whether I had the loss by straying from my trading plan. If I have strayed, I reinforce my resolve to stick with my plan. If I have not strayed, then I learn from it what I can, and shrug it off as a cost of business. It is not an expense, it is a cost, and if you don't know the difference you need to take a course or read a book on the basics of accounting.
© by Joe Ross. Re-transmission or reproduction of any part of this material is strictly prohibited without the prior written consent of Trading Educators, Inc.
ABBV Trade
Instant Income Guaranteed
Developer: Joe Ross
Administrator: Philippe Gautier
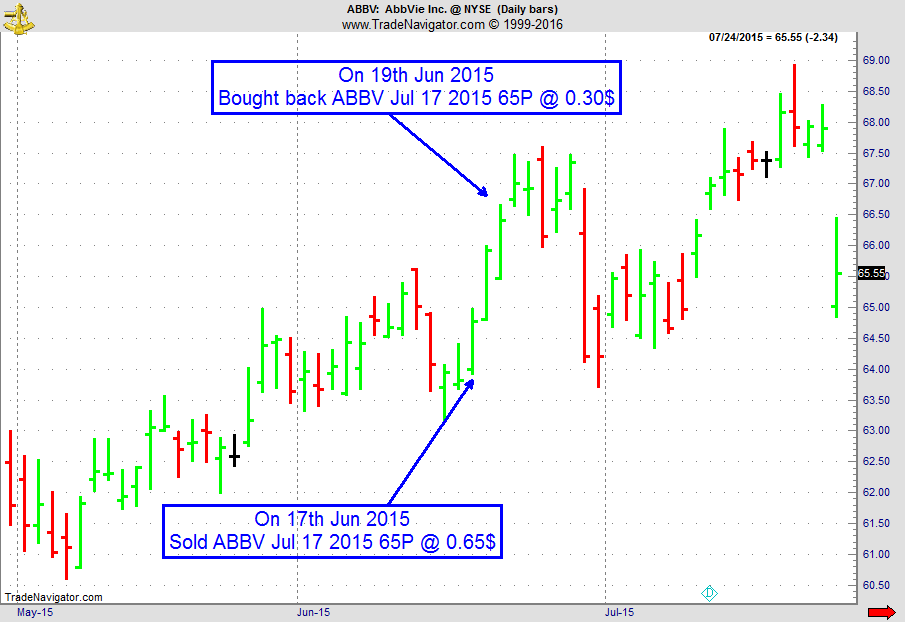
On 16th June 2015, we gave our IIG subscribers the following trade on ABBV, a strong stock in a strong sector. As momentum was back in our favor, we decided to sell price insurance as follows the following day:
- On 17th June 2015, we sold ABBV July 17 2015 65P @ 0.65$, ie. $65 per option sold; the short strike was below support level, with only 29 days to expiration.
- On 19th June 2015, we bought back ABBV July 17 2015 65P @ $0.30, after only 2 days in the trade
Profit: $35
Margin: $1,300
Return on Margin annualized: 491.35%
Another trade with quick premium compounding.
We have also added new types of trades for our IIG daily guidance, "no loss" propositions with unlimited upside potential, still using other people's money to trade.
Philippe
Receive daily trade recommendations - we do the research for you!
Instant Income Guaranteed
© by Joe Ross and Philippe Gautier. Re-transmission or reproduction of any part of this material is strictly prohibited without the prior written consent of Trading Educators, Inc.
Trading Plan Series Part VI
by Master Trader Andy Jordan
Educator for Spreads, Options, Swing/Day Trading, and Editor of Traders Notebook
In Part 6 of the Trading Plan Series, I'll explain what to do each day before the real trading activity starts.
© by Andy Jordan. Re-transmission or reproduction of any part of this material is strictly prohibited without the prior written consent of Trading Educators, Inc.
This Week's Blog Post - Is Trading a Clean Way to Earn Money?
by Master Trader Andy Jordan
Educator for Spreads, Options, Swing/Day Trading, and Editor of Traders Notebook
Many wannabe traders have trouble following their trading plans when they are seemingly in conflict with their basic beliefs. Read more.
© by Andy Jordan. Re-transmission or reproduction of any part of this material is strictly prohibited without the prior written consent of Trading Educators, Inc.
AlgoStrats.com - AlgoStrats: FX
by Master Trader Marco Mayer
Educator for Forex and Futures, Systematic Trader, and
Creator of Ambush Trading Method and AlgoStrats.com
The free trial week of AlgoStrats:FX is almost over, so I decided to create a video giving you a summary of the first week. Thank you to everyone who participated in the free trial and I really appreciated your feedback!
Feel free to email with questions at This email address is being protected from spambots. You need JavaScript enabled to view it., or post it in our Blog or Forum. Follow me on Facebook and Twitter!
Ambush Method Trade and Performance Report
by Master Trader Marco Mayer
Educator for Forex and Futures, System Trader, and Creator of Ambush Trading Method
After Ambush had a tough start into 2016, during the last couple of months it literally took off in pretty much every market.
Let’s look at the performance of a typical Ambush-Basket with you:
- Henry Hub Natural Gas Futures (NG)
- E-Mini S&P 500 (ES)
- Dollar Index (DX)
- Australia Dollar (6A)
As you can see, Ambush managed to make a total of over $20,000 trading one contract in each of the markets (including $10 for commissions and slippage round-turn).
What makes Ambush so unique is that it achieved these results without holding any positions over-night. So these are day trades - but the only time you need to take action is at the market close each day!
Here’s the Equity-Curve, showing a rough start into 2016 but a really strong rally for the rest of the year so far:
Ambush didn’t just perform well in these markets. It did so across the board, and there are markets that did even better like Gas Oil for example.
Actually looking at the performance of all Futures markets, Ambush is trading at new all time equity highs again! We’d like to celebrate this with you and are offering you a special discount with 10% off this week! Use coupon code ambush10 when you check out. Offer valid until August 10, 2016.
Please look at the long-term performance of all other markets supported by Ambush. Check out the reports on the Ambush page.
Happy Trading!
Marco Mayer
© by Marco Mayer. Re-transmission or reproduction of any part of this material is strictly prohibited without the prior written consent of Trading Educators, Inc.
Check out our Blog!
To view previous published Chart Scan newsletters, please log in or click on "Join Us,"
shown above, to subscribe to our free "Members Only" section.
A WEALTH OF INFORMATION & EDUCATION:
Joe Ross-Trading Educators' popular free Chart Scan Newsletter has been published since 2004.
Note: Unless otherwise noted, all charts used in Chart Scan commentary were created
by using Genesis Financial Technologies' Trade Navigator (with permission).
Legal Notice and Copyright 2016 Disclaimer - Published by Trading Educators, Inc.
Chart Scan is a complimentary educational newsletter.
© by Trading Educators, Inc. Re-transmission or reproduction of any part of this material is strictly prohibited without prior written consent.
Edition 631 - July 15, 2016
Who doesn't want extra income guaranteed? Follow along with our "Instant Income Guaranteed" examples that will be highlighted after Joe's trading article. Here's what one subscriber has to say!
"Its been around a year since I enrolled in the IIG program. Probably the best "trading" decision I have ever made. It is amazing the annualized return you can produce if you keep flipping your money. I have taken shares on a couple of stocks because I chose to do so, I don't consider that a loss. Thanks, Randy C. (July 2016)"
The Law of Charts with Commentary
by Master Trader Joe Ross
Author, Trader, Trading Mentor, and Founder of Trading Educators, Inc.
Matching Congestions
A few years ago I was asked about the chart below. The question was: "What do you think about what you see there?" The daily bond chart was showing a very interesting formation as I write this. It is a formation known in the Law of Charts as "matching congestions." Matching congestions are usually a prelude to a significant move. In this instance, the matching congestions were also taking place along with a formation known as a "cup with handle." Not all matching congestions are also cup with handle formations. The cup with handle, when seen as on the chart below, typically breaks out the upside. With the underlying economy weakening as of the reports at that time, it seemed likely that we would see an up move on the chart. The matching congestion are seen in the left and right boxes.
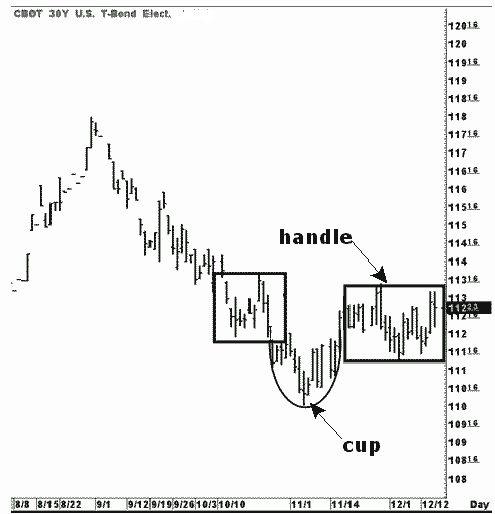
Matching congestions are discussed in my book Trading Is a Business.
© by Joe Ross. Re-transmission or reproduction of any part of this material is strictly prohibited without the prior written consent of Trading Educators, Inc.
Question from a letter I received
by Master Trader Joe Ross
Author, Trader, Trading Mentor, and Founder of Trading Educators, Inc.
"Joe! You keep saying the markets have changed. But when I look at a chart of 50 years ago, it looks the same as a chart does today. Would you explain?"
Sure! Charts look the same. They look the same because a price chart reflects the action and interaction of traders as they view events that affect prices. Since human nature has not changed since Adam and Eve in the garden, a chart from before Noah’s flood would look the same then as it does today. But how the chart looks is not what I’m talking about when I say the markets have changed. What I am referring to is the way they trade throughout the day. Also I am referring to the fact of many new markets, and a multitude of time frames in which you can trade all markets.
Let’s look at only a few of the things that have caused these changes. The first major change that I noticed occurred soon after Richard Nixon took the U.S. off the gold standard. This led to a need to trade currencies. The dollar was based on a fixed price for gold, and most other currencies were based on the dollar.
The need to hedge in the currency markets brought about the need for currency futures and increased Forex trading. Additionally, this began to affect virtually all the commodity markets. Commodities that trade internationally now had to be adjusted for constantly fluctuating monetary exchange valuations. Trading interests who never before had to think about how much it would cost to buy commodities from other countries now had to hedge. Trading interests that sold commodities to other countries also now had to hedge. The effect of having a need to trade currencies has affected virtually every known market.
The next major event that caused vast changes in the marketplace was the advent of the personal computer and day trading. Over a relatively brief period of time, the markets have turned into giant casinos with people trading time frames all the way down to tick charts. Suddenly there was a tremendous amount of noise in the markets that was never previously there. Computers and advances in electronic technology have brought the world of trading to the point of a single global marketplace. No longer is trading confined to mostly the U.S. Trading is now a global phenomenon with millions of participants.
Of course, there are many more things I could mention that have changed the way the markets trade. But this is not the place for writing a new book. The impact for the trader of all the changes that have taken place is that the way you manage trades is in a constant state of flux. In general, no one method works forever; no one system can be relied on for very long. The trader must constantly adjust either his system, his method, or himself to the ever-changing market dynamics.
© by Joe Ross. Re-transmission or reproduction of any part of this material is strictly prohibited without the prior written consent of Trading Educators, Inc.
NUS Trade
Instant Income Guaranteed
Developer: Joe Ross
Administrator: Philippe Gautier
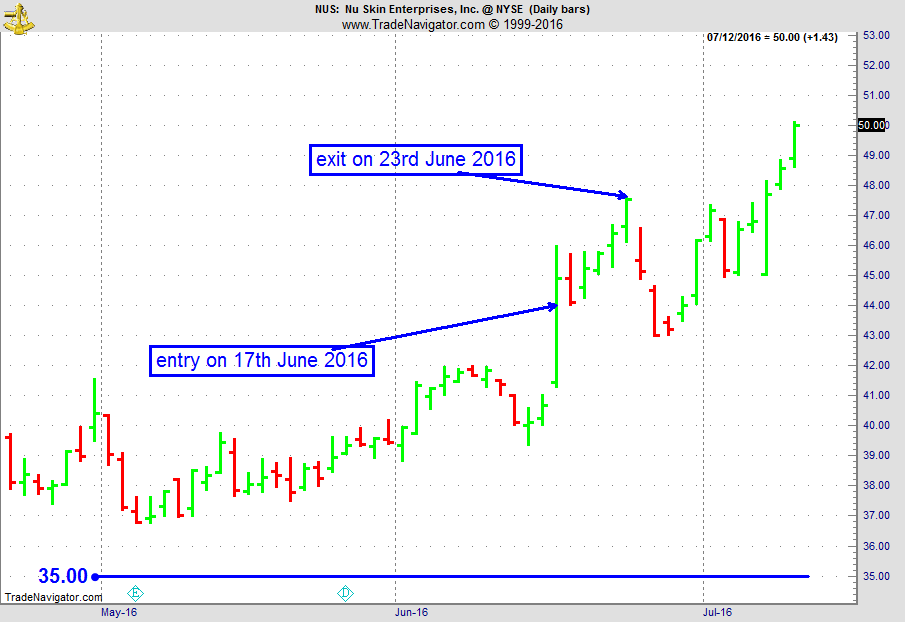
On 16th June 2016, we gave our IIG subscribers the following trade on NUS, which was in an established uptrend, and had a sharp move up on that day after winning a $210M investment from China. As the move was sustained by professional accumulation, we decided to sell price insurance as follows the following day:
-
On 17th June 2016, we sold NUS July 29 2016 35P @ 0.40$, ie. 40$ per option sold; the short strike was well below price action (22%away) and below a major support level, so that the trade was very safe, with 42 days to expiration.
- On 23rd June 2016, we bought back NUS July 29 2016 35P @ 0.20$, after 6 days in the trade.
$Profit: 20$
$Margin: 700
Return on Margin annualized: 173.81%
Philippe
 Receive daily trade recommendations - we do the research for you!
© by Joe Ross and Philippe Gautier. Re-transmission or reproduction of any part of this material is strictly prohibited without the prior written consent of Trading Educators, Inc.
Stealth Trading Method
by Master Trader Andy Jordan
Educator for Spreads, Options, Swing/Day Trading, and Editor of Traders Notebook
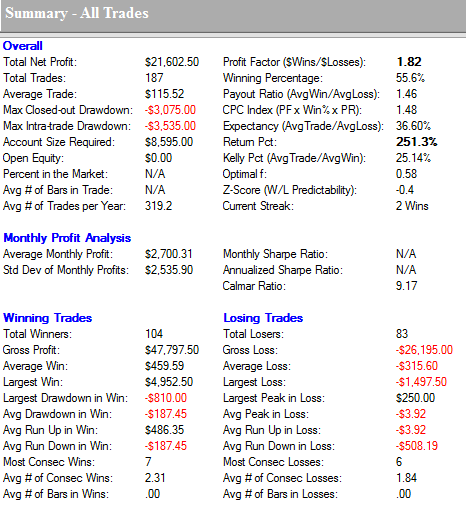
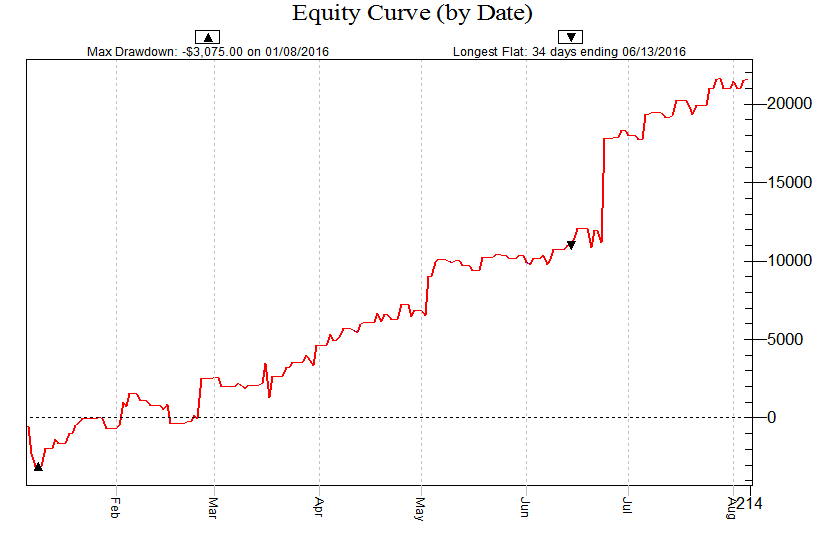
Andy gives you a 2016 update on how well Stealth Trading Method, break-out method, is handling the markets. Net profit while trading in 25 markets, and an equity curve with impressive upward movement.
© by Andy Jordan. Re-transmission or reproduction of any part of this material is strictly prohibited without the prior written consent of Trading Educators, Inc.
This Week's Blog Post - Go to the Exchanges for the Best Basic Information
by Master Trader Andy Jordan
Educator for Spreads, Options, Swing/Day Trading, and Editor of Traders Notebook
Did you know that you can get good, free information at the exchanges web sites? Andy explains why. Read more.
© by Andy Jordan. Re-transmission or reproduction of any part of this material is strictly prohibited without the prior written consent of Trading Educators, Inc.
AlgoStrats.com - FX Free Trail starts July 25th
by Master Trader Marco Mayer
Educator for Forex and Futures, Systematic Trader, and
Creator of Ambush Trading Method and AlgoStrats.com
AlgoStrats:FX Free Trial will start on July 25th.
- On Friday, July 22nd registration begins to create your accounts, take time to look around, read through the help section, and ask questions.
- Live trading starts on Tuesday, July 26th.
- Follow Marco on Facebook and Twitter.
If you have any questions, feel free to This email address is being protected from spambots. You need JavaScript enabled to view it., or post it in our Blog or Forum.

© by Marco Mayer. Re-transmission or reproduction of any part of this material is strictly prohibited without the prior written consent of Trading Educators, Inc.
Check out our Blog!
To view previous published Chart Scan newsletters, please log in or click on "Join Us,"
shown above, to subscribe to our free "Members Only" section.
A WEALTH OF INFORMATION & EDUCATION:
Joe Ross-Trading Educators' popular free Chart Scan Newsletter has been published since 2004.
Note: Unless otherwise noted, all charts used in Chart Scan commentary were created
by using Genesis Financial Technologies' Trade Navigator (with permission).
Legal Notice and Copyright 2016 Disclaimer - Published by Trading Educators, Inc.
Chart Scan is a complimentary educational newsletter.
© by Trading Educators, Inc. Re-transmission or reproduction of any part of this material is strictly prohibited without prior written consent.
Edition 630 - July 8, 2016
Extra, Extra, read all about it! Ambush Trading Method is on sale for 20% off until July 13th, use coupon code: ambush20
The Law of Charts with Commentary
by Master Trader Joe Ross
Author, Trader, Trading Mentor, and Founder of Trading Educators, Inc.
Trading from a Ledge
Aluminum prices had been soaring. But aluminum futures were too thin to trade and, besides, the futures are dangerous when thinly traded. One way to get into aluminum was to trade shares in Alcoa Inc. (AA)
AA had formed a ledge. The Law of Charts describes a ledge as being two matching or almost matching highs and two matching or almost matching lows. The two matching highs must be separated by at least one price bar, and the two matching lows must be separated by at least one price bar. A ledge always begins with a Ross hook, but then prices form a consolidation. A ledge occurs only within a trend or swing. The breakout of a ledge is traded only in the direction of the former trend or swing. The chart shows two almost matching highs at 28.74 & 28.75, and two almost matching lows at 28.20 & 28.21. Entry would be made long at 28.76, 1 tick above the high of the ledge.
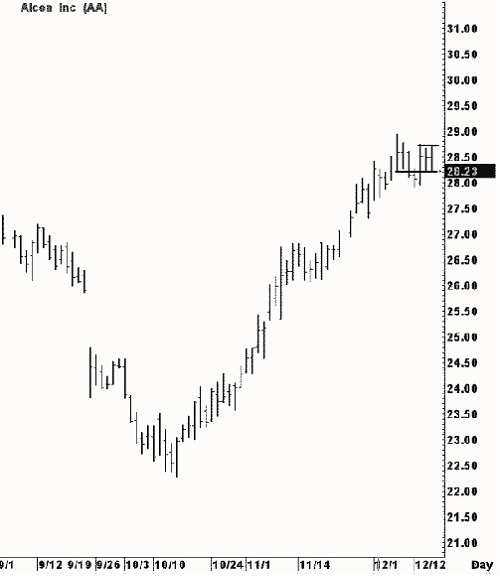
© by Joe Ross. Re-transmission or reproduction of any part of this material is strictly prohibited without the prior written consent of Trading Educators, Inc.
Question from a Subscriber:
by Master Trader Joe Ross
Author, Trader, Trading Mentor, and Founder of Trading Educators, Inc.
"I read about a Monday Morning Bull Market Entry Technique. Do you know anything about something like that?"
I’ve run across a few in my many years of trading. Of course, the first step is to be certain that you are in a bull market. Once you know for sure, buy Monday's opening — risk half the range of the previous trading day; price objective is 80% of the three-week average weekly range.
If the previous week had a higher high; higher low; and close above the open, mid-range, and previous week's close, then use this strategy. This is even better on Monday with a lower opening that does not violate the previous day's low, since it should retrace back to the previous close a high percentage of the time. Monday's price action should ideally exceed Friday's or the last week's high. If this happens and Tuesday or any following day makes new intra-week lows, then a short term reversal has occurred.
Watch to see if the new intra-week low closes below the previous intra-week low for confirmation. Tuesday is technically known as "the reversal day," so watch its afternoon price action carefully. Tuesday's relationship to Monday's range points to the direction of the remaining weekly range. Many technicians buy the S&P on early Monday morning weakness to sell a rally on Tuesday afternoon.
Of course, you have to check this technique to see if it is working now in the markets you want to trade.
© by Joe Ross. Re-transmission or reproduction of any part of this material is strictly prohibited without the prior written consent of Trading Educators, Inc.
New Blog Posts
by Master Trader Andy Jordan
Educator for Spreads, Options, Swing/Day Trading, and Editor of Traders Notebook
This week, Andy has two new blog posts for you:
Trading is Not Scientific
Trading is not an exact science. It is more of an art.
Why So Many Traders "Don't Make It"
The majority of traders end up losing their accounts. Why? There are many factors that go into becoming a successful trading that most traders don't even consider.
© by Andy Jordan. Re-transmission or reproduction of any part of this material is strictly prohibited without the prior written consent of Trading Educators, Inc.
Andy Jordan's Trading Plan Series:
Trading Plan Part 1 - The trading plan.
Trading Plan Part 2 - Who needs a trading plan? What will a trading plan do for you?
Trading Plan Part 3 - It is important to know yourself and your purpose.
Trading Plan Part 4 - How to set the right trading goals.
Trading Plan Part 5 - Explains the markets, time frames, trading vehicle, brokers, software, and much more.
© by Andy Jordan. Re-transmission or reproduction of any part of this material is strictly prohibited without the prior written consent of Trading Educators, Inc.
Ambush Performance Update and Brexit
by Master Trader Marco Mayer
Educator for Forex and Futures, Systematic Trader, and
Creator of Ambush Trading Method and AlgoStrats.com
Marco answers the question "How did Ambush make it through the BREXIT" and includes the latest Ambush perfomance in his blog post. He is also giving 20% off of Ambush through July 13th. Enter the coupon code ambush20 when you check out. Enjoy! If you have any questions, feel free to This email address is being protected from spambots. You need JavaScript enabled to view it., or post it in our Blog or Forum.
© by Marco Mayer. Re-transmission or reproduction of any part of this material is strictly prohibited without the prior written consent of Trading Educators, Inc.
Experience AlgoStrats.com today! Marco Mayer's (Systematic and Forex Expert) newest development. AlgoStrats:FX Free Trials will start this month, stay tuned! Follow Marco on Facebook and Twitter.
Check out our Blog!
To view previous published Chart Scan newsletters, please log in or click on "Join Us,"
shown above, to subscribe to our free "Members Only" section.
A WEALTH OF INFORMATION & EDUCATION:
Joe Ross-Trading Educators' popular free Chart Scan Newsletter has been published since 2004.
Note: Unless otherwise noted, all charts used in Chart Scan commentary were created
by using Genesis Financial Technologies' Trade Navigator (with permission).
Legal Notice and Copyright 2016 Disclaimer - Published by Trading Educators, Inc.
Chart Scan is a complimentary educational newsletter.
© by Trading Educators, Inc. Re-transmission or reproduction of any part of this material is strictly prohibited without prior written consent.
Edition 629 - July 1, 2016
"If you are going to trade, try to learn something about everything and everything about something." ~ Joe Ross
The Law of Charts with Commentary
by Master Trader Joe Ross
Author, Trader, Trading Mentor, and Founder of Trading Educators, Inc.
Trading Range
The chart below shows a typical trading range on the crude oil chart. The range shown was defined in my manuscript “Trading by the Book.”
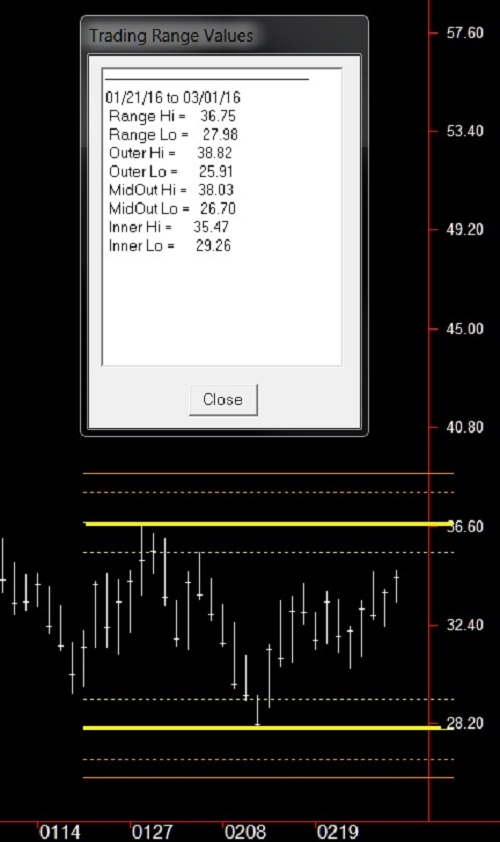
Let´s take a look at the various horizontal lines you see on the chart, which form a trading envelope.
The high and low of the range are defined by the bright yellow bars. The high is set at 36.75, and the low at 27.98.
The dotted white lines above and below the yellow range lines are set at a fixed distance .146 above the low of the range (29.26), and below the high of the range (35.47). These form an inner envelope. Prices that enter into the inner envelope have a high propensity to bounce and move opposite to the direction from which they came.
The dotted orange lines below (26.70), and above (38.03) the yellow range lines are set at a fixed distance .146 outside of the range, and form an intermediate external envelope. Prices that enter into the intermediate envelope offer a warning to be cautious of a possible breakout coming.
The solid orange lines above and below the yellow range lines are set at fixed distance .236 above the range high at (38.82), and below the low at (25.91). These form the outer limits of the trading envelope. If prices violate the outer limits of the envelope, prices are probably trending, and will have formed a 1-2-3 high or low within the envelope, and possibly have formed a Ross Hook as well.
The trading envelope has proven to be excellent for trading option boxes, and for trading within the general limits of the envelope.
© by Joe Ross. Re-transmission or reproduction of any part of this material is strictly prohibited without the prior written consent of Trading Educators, Inc.

The Future is Never Certain
by Master Trader Joe Ross
Author, Trader, Trading Mentor, and Founder of Trading Educators, Inc.
When trading the markets, uncertainty is often a fact of life. Consider the plight of Jack who tried to add as much certainty into his trading as possible. He decided to invest in a solid retailer. Consumer confidence was high and sales had been high at the retail stores for the past two years. He looked closely at the five-year chart and noticed a clear, upward trend. When the price did temporarily drop, the most it had ever fallen in the past five years was about $3. It was currently trading at $40. He decided to buy 2000 shares and protected himself by placing a stop at $37. He reasoned that the past five years would be a good indicator of what might happen in the next year: the stock price should continue to rise and should only fall by $3 at the most.
There was something psychologically pleasing about studying the fundamentals of the company and its past stock performance. He felt assured. Even though his risk was almost 8% of his trading capital, he decided the risk was worth the reward.
Unfortunately, history only repeats itself when it does. A month after entering the trade, the stock price fell to $35. Jack couldn't believe what happened. He thought, "How could I have been so wrong? I had considered all possibilities." Many novice traders think like Jack. They seek out a level of consistency in the financial markets that just does not exist. They believe that the markets follow natural laws and falsely believe that there are some magical mathematical principles that underlie it all. Big time institutional investors may be able to forecast the market action in the long term, but they have mountains of capital and can attempt to hedge risk, and even they have great difficulty merely matching the yearly increases of the indexes. For the smaller investor or trader, there are no secret mathematical formulas. The past is the past, and what happened in the past may not forecast the future.
Don't falsely think that you can forecast market action with the same precision a physicist can program a satellite to reach Mars. The markets don't follow natural laws. There are many unknown factors that underlie the price action. The best you can do is study all available information and make an educated guess. As long as you manage risk, you can make trade after trade and get the odds to work in your favor. You won't be right all the time, but you'll be right enough of the time to make a profit. It may be pleasing to think that you can add certainty to trading, but you can't. You'll feel better in the long run and trade more profitably if you accept the fact that the future is uncertain.
Whether you are a long-term investor or a short-term trader, you might be looking through reams of information, such as charts, analyst commentaries, and financial statements, to arrive at a wise decision. You may have to sift through it all, weigh it appropriately, and use your intuition to make the most informed decision possible.
Usually, it's merely an educated guess in the end. Traders are hardly objective, logical processors of information. They suffer from what decision-making theorists call confirmation bias. When devising a trading plan, there is strong pressure to reach a decision and implement a plan. The consequences of a wrong decision can be financially disastrous. The added pressure can get to us. Rather than look at each piece of information objectively, we tend to pay closer attention to information that confirms our initial decision while ignoring contrary information.
If you want to make sound trading decisions, you must fight the urge to seek out information that supports your initial expectations. As a basic rule of thumb, when trying to arrive at a sound decision, you should spend most of your time looking for information that goes against your initial hunches than information that confirms it.
© by Joe Ross. Re-transmission or reproduction of any part of this material is strictly prohibited without the prior written consent of Trading Educators, Inc.
Trading Idea
by Master Trader Andy Jordan
Educator for Spreads, Options, Swing/Day Trading, and Editor of Traders Notebook
This week, Andy is looking at the 30 Year T-Bonds and he explains an interesting trading idea using Options.
© by Andy Jordan. Re-transmission or reproduction of any part of this material is strictly prohibited without the prior written consent of Trading Educators, Inc.
This Week's Blog Post - Risk Management - Over-Trading
by Master Trader Andy Jordan
Educator for Spreads, Options, Swing/Day Trading, and Editor of Traders Notebook
Winners learn more from losses than from profits. When a profit is taken, there may be little room for improvement. When a loss is taken, a trader's self-discipline is the first thing to be examined. Read more.
© by Andy Jordan. Re-transmission or reproduction of any part of this material is strictly prohibited without the prior written consent of Trading Educators, Inc.
Watch Andy Jordan's Trading Plan Series:
Trading Plan Part 1 - The trading plan.
Trading Plan Part 2 - Who needs a trading plan? What will a trading plan do for you?
Trading Plan Part 3 - It is important to know yourself and your purpose.
Trading Plan Part 4 - How to set the right trading goals.
Trading Plan Part 5 - Explains the markets, time frames, trading vehicle, brokers, software, and much more.
© by Andy Jordan. Re-transmission or reproduction of any part of this material is strictly prohibited without the prior written consent of Trading Educators, Inc.
Q&A Series - Episode 4
by Master Trader Marco Mayer
Educator for Forex and Futures, Systematic Trader, and
Creator of Ambush Trading Method and AlgoStrats.com
In his new Episode of his Questions & Answers Series, Marco answers the questions you sent in. Including a follow-up question of last week's video related to Pinbars, recommendations on Forex brokers, and why it's so hard to trade successfully on a 5-minute chart. Enjoy! If you have any questions, feel free to This email address is being protected from spambots. You need JavaScript enabled to view it., or post it in our Blog or Forum.
© by Marco Mayer. Re-transmission or reproduction of any part of this material is strictly prohibited without the prior written consent of Trading Educators, Inc.
AlgoStrats.com, Marco Mayer's (Systematic and Forex Expert) newest development is live and ready for you to experience it. AlgoStrats:FX Free Trials will start soon in early July, stay tuned! Follow Marco on Facebook and Twitter.
Check out our Blog!
To view previous published Chart Scan newsletters, please log in or click on "Join Us,"
shown above, to subscribe to our free "Members Only" section.
A WEALTH OF INFORMATION & EDUCATION:
Joe Ross-Trading Educators' popular free Chart Scan Newsletter has been published since 2004.
Note: Unless otherwise noted, all charts used in Chart Scan commentary were created
by using Genesis Financial Technologies' Trade Navigator (with permission).
Legal Notice and Copyright 2016 Disclaimer - Published by Trading Educators, Inc.
Chart Scan is a complimentary educational newsletter.
© by Trading Educators, Inc. Re-transmission or reproduction of any part of this material is strictly prohibited without prior written consent.
More...
Edition 627 - June 17, 2016
Joe Ross' "Money Master Plus" webinar is scheduled for June 25th at 10:00 a.m. to 1:00 p.m., US CST. This informative, wealth building, and motivating three hour webinar is led by a master trader who has gained invaluable knowledge and techniques by trading over 50 years within all markets. Become a "Master" of your money and learn a way to trade with no losses. Let us put you on a money making path that will greatly change your life. Don't wait another minute and sign up today!
Marco Mayer, Systematic and Forex Expert, is proud to announce that his newest development is live and ready for you to experience it. Traders, we invite you to visit AlgoStrats.com. AlgoStrats:FX Free Trials will start soon in early July, stay tuned!
The Law of Charts with Commentary
by Master Trader Joe Ross
Author, Trader, Trading Mentor, and Founder of Trading Educators, Inc.
Market Manipulation
The chart below was sent in by one of our students. It showed a manipulation in March Soybeans.

March Soybeans had been struggling to get above the $8.85 level for quite some time, so it is reasonable to assume that a fair number of buy stops had accumulated just above that level. The day marked with an arrow, was options expiration day. When the market closed that day, there were eight thousand 880 puts that expired 1 ¾ cents in the money. This probably wasn’t nearly enough to recover the premium that was paid for them, and the person that wrote them had been working his tail off to make sure of it. The put owner decided to just let them expire instead of exercising his right to sell the position at 880. The Trade took notice, and took this as a very bullish sign, as can be seen by the gap open the following Monday. With all of the buy orders accumulated up above, both traders were easily able to liquidate their longs at a higher price and get short for the subsequent move down. Did they plan this move together, or was it mere chance that both sides were able to profit? Always remember that there are people out there with the ability to push the market around, and they will do so at every opportunity.
© by Joe Ross. Re-transmission or reproduction of any part of this material is strictly prohibited without the prior written consent of Trading Educators, Inc.
Staying on Target
by Master Trader Joe Ross
Author, Trader, Trading Mentor, and Founder of Trading Educators, Inc.
After carefully studying the fundamentals of a tech stock, Jack decided to buy 1,000 shares at $60 a share. After a recent product announcement it traded at $64. Although it was higher than he had preferred, he felt it was still a good investment and figured he might as well buy at the higher price before it went even higher.
As is often the case after a product announcement jump in prices, prices fell to $60 a share a few days later. Jack started to kick himself, "Why couldn't I wait. I knew it would fall. I should have waited. I could have saved $4,000." Jack plans to hold the position for six months and he still thinks the stock has the potential to hit $70, but he can't seem to stop berating himself for buying too soon and spending an extra $4,000. His feelings are understandable, but it's distractions like these that often throw traders off target. It's vital to continue to focus on your trading plan and not be stifled by self-reproach.
Depending on your personality, you may be prone to kick yourself for making trading mistakes. In Jack's case, he may have bought a stock at a higher price than he had hoped, but it isn't a disaster. According to his trading plan, he can reach his objective of selling at $70 in six months, and making $6,000 as he had anticipated. Many traders have a tendency to be perfectionists. They can't stop obsessing about how they could have entered and exited a trade more skillfully.
Striving for high ideals is noble, but when it distracts you from focusing on your ongoing experience, it can be detrimental. For example, if Jack continues to berate himself for buying too high on this trade, he may not be able to focus on studying the next trade and developing a sound, new trading plan. He may also feel less spontaneous and creative. His mind may become filled with self-doubt and his thinking may become clouded. Striving for perfection can be much more of a distraction than a benefit in the long term.
At times of self-reproach, it's essential to talk yourself out of it. It's necessary to move from a mental state that concerns obsessing about errors to a calm, focused mindset concerned with thinking creatively. Although they may sound trite, repeating a few common sayings about trading the markets may be quite helpful: "I'm going to trade my plan and stick with it." "I'm going to go where the markets take me." "I'm a mere mortal; I can't control the markets." "I need to accept the fact that I'm human and may make mistakes."
You don't have to trade perfectly. You just have to trade profitably. Put a single trade in perspective. It's just one trade of the many trades you will make in your lifetime. You may lose or you may win, but the outcome of a single trade does not matter. What matters are your overall profits across a series of trades, not just a single trade. Rather than beat yourself up for minor mistakes, stay on target. You may make a mistake here and there, but it's all right. All traders make mistakes.
© by Joe Ross. Re-transmission or reproduction of any part of this material is strictly prohibited without the prior written consent of Trading Educators, Inc.
Trading Idea
by Master Trader Andy Jordan
Educator for Spreads, Options, Swing/Day Trading, and Editor of Traders Notebook
This week, Andy is looking into a Cotton butterfly spread and explains why the butterfly looks good at the beginning, but might be difficult to trade.
© by Andy Jordan. Re-transmission or reproduction of any part of this material is strictly prohibited without the prior written consent of Trading Educators, Inc.
Andy's Blog Post - Ego-less Trading
by Master Trader Andy Jordan
Educator for Spreads, Options, Swing/Day Trading, and Editor of Traders Notebook
The majority of traders might think it would be impossible to trade in an "ego-less state", but this is not the case. To trade in an ego-less state means simply to not let the ego and emotions get involved. While trading in an ego-less state, winning or losing on a single trade become almost meaningless when the focus lies only on the whole picture. Read more.
© by Andy Jordan. Re-transmission or reproduction of any part of this material is strictly prohibited without the prior written consent of Trading Educators, Inc.
Manual Backtesting Pitfalls
by Master Trader Marco Mayer
Educator for Forex and Futures, Systematic Trader, and
Creator of Ambush Trading Method and AlgoStrats.com
In his new video, Marco talks about some of the most common pitfalls when doing manual backtesting. So if you ever wondered why your actual trading results don't match with the manual backtest you did, this is for you! If you have any questions, feel free to This email address is being protected from spambots. You need JavaScript enabled to view it., or post it in our Blog or Forum.
Marco's new site is now live!
AlgoStrats.com
(Be sure to also follow Marco on Facebook and Twitter)
© by Marco Mayer. Re-transmission or reproduction of any part of this material is strictly prohibited without the prior written consent of Trading Educators, Inc.
Check out our Blog!
To view previous published Chart Scan newsletters, please log in or click on "Join Us,"
shown above, to subscribe to our free "Members Only" section.
A WEALTH OF INFORMATION & EDUCATION:
Joe Ross-Trading Educators' popular free Chart Scan Newsletter has been published since 2004.
Note: Unless otherwise noted, all charts used in Chart Scan commentary were created
by using Genesis Financial Technologies' Trade Navigator (with permission).
Legal Notice and Copyright 2016 Disclaimer - Published by Trading Educators, Inc.
Chart Scan is a complimentary educational newsletter.
© by Trading Educators, Inc. Re-transmission or reproduction of any part of this material is strictly prohibited without prior written consent.
Edition 626 - June 10, 2016
Joe Ross sent out a letter earlier this week. In case you missed it, you can read it on his blog and have an opportunity to sign up for his "Money Master Plus" webinar on June 25th (take advantage of the early bird special).
The Law of Charts with Commentary
by Master Trader Joe Ross
Author, Trader, Trading Mentor, and Founder of Trading Educators, Inc.
Sugar Trade
This week we look at a daily sugar chart. We need to learn something here about the Traders Trick Entry (TTE). March Sugar prices reached a high of 10.94 and then retraced for two days. Those two days made identical highs [at 10.90]. Prices then dropped again, and again we had two identical highs [at 10.69]. The TTE rules say that after 4-bars of correction you are no longer to enter a trade based on the TTE. However, the rules also state that when expecting a continuation towards the upside, equal highs count as only one bar of correction (retracement). So, although we have 4-bars in the correction, because of the equal highs we count this as only two bars of correction. Now you can see why we made an entry 1-tick above 10.69. What happened afterwards is of no consequence to the rule I am showing you here. In accordance with your money and trade management, you made a little, or took a loss, or made a lot on this trade. I will tell you only that we made a little. ;-)
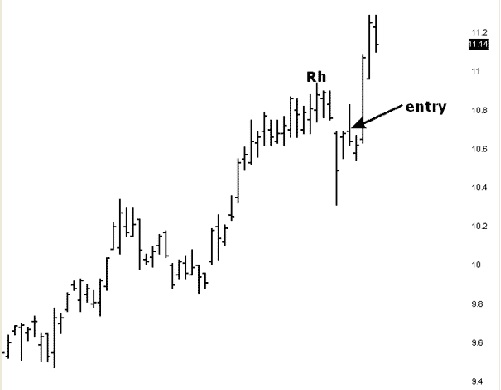
© by Joe Ross. Re-transmission or reproduction of any part of this material is strictly prohibited without the prior written consent of Trading Educators, Inc.
Seeking Out Protection
by Master Trader Joe Ross
Author, Trader, Trading Mentor, and Founder of Trading Educators, Inc.
Making a profit in the trading world is hardly a sure thing. How you deal with this fact of trading, though, depends on your personality. Some people take risks in stride, while others obsess over them. Which type of person are you - a natural born risk taker, or an obsessive, fearful seeker of safety?
Life is a matter of taking risks, but some people embrace it while others superstitiously try to avoid it. For example, have you ever seen an extremely ineffective car theft device called "The Club?" You are fooled into believing that by putting a massive metal bar on your car's steering wheel, you are protected. It seems it would work, until you realize it takes merely a few minutes to cut the steering wheel with a hacksaw to pull it off. Similarly, why do car stereos have removable faceplates? Do you think thieves are actually unaware that there isn't an expensive stereo beneath a removed faceplate?
These kinds of "protective" devices make us feel better, at least until we realize that they don't work. At that point, we think, "How could I have been so stupid?" That said, feeling protected helps take the edge off. Even if it is just superstitious behavior, like wearing your lucky shirt on the day of a big trade, you feel better when you do it. There's a psychological benefit to it.
We can alleviate some of the uneasiness of taking risks through risk control. By risking a small percentage of your trading capital on a single trade, and looking at the big picture, you will feel more at ease. From a psychological viewpoint, it is to your advantage to make a potential trading loss so insignificant that you may start thinking "Why am I even bothering making this trade?" There is no universal rule for how to limit risk. Some experts suggest risking merely 2% of your capital, while others suggest 5%, and still others suggest using past market action to determine the amount of loss you can afford to take (for example, if the market is bullish with many opportunities for profit, then you can take a little more risk.)
The best way to control risk is to set a protective stop, but whether or not you set a stop loss or how you do it depends on your personality and attitude toward risk. If you are a natural born risk taker, you may not set a formal stop loss at all. You may keep an informal stop loss point in mind, and close your position when the stock price reaches that point. At the other extreme, the obsessive-compulsive worrier trader may set the stop loss too close to the entry price, and end up getting stopped out too early. The middle ground seems to be reasonable for most traders. Again, it depends on your personality, but if you are afraid to take a loss, a stop loss can help. If you don't have a stop loss and hate taking a loss, you may not close out a position when the price falls hard. You may be prone to hope against hope that the trade will turn around, and watch your losses mount as you fail to take action. The stop loss order, however, guarantees that you will be out of the trade should prices move against you.
© by Joe Ross. Re-transmission or reproduction of any part of this material is strictly prohibited without the prior written consent of Trading Educators, Inc.
Trading Idea
by Master Trader Andy Jordan
Educator for Spreads, Options, Swing/Day Trading, and Editor of Traders Notebook
This week, Andy is looking into a Natural Gas calendar spread going long the April and short the March 2017 Natural Gas.
© by Andy Jordan. Re-transmission or reproduction of any part of this material is strictly prohibited without the prior written consent of Trading Educators, Inc.
Andy's Blog Post - The Best Trader in the World
by Master Trader Andy Jordan
Educator for Spreads, Options, Swing/Day Trading, and Editor of Traders Notebook
If you had to describe the best trader in the world, who would that person be? What qualities would he have? Take a moment to envision him. This is important because this is the person you want to be, so you need to have an exact picture of him and what his qualities are. Read more.
© by Andy Jordan. Re-transmission or reproduction of any part of this material is strictly prohibited without the prior written consent of Trading Educators, Inc.
Forex vs. Futures
by Master Trader Marco Mayer
Educator for Forex and Futures, Systematic Trader, and
Creator of Ambush Trading Method and AlgoStrats.com.
In his new video, Marco talks about the major differences between trading Futures and Forex from his point of view. Find out what the advantages and disadvantages of both trading instruments are! If you have any questions, feel free to This email address is being protected from spambots. You need JavaScript enabled to view it., or post it in our Blog or Forum.
Marco's new site is now live!
AlgoStrats.com
(Be sure to also follow Marco on Facebook and Twitter)
© by Marco Mayer. Re-transmission or reproduction of any part of this material is strictly prohibited without the prior written consent of Trading Educators, Inc.
Check out our Blog!
To view previous published Chart Scan newsletters, please log in or click on "Join Us,"
shown above, to subscribe to our free "Members Only" section.
A WEALTH OF INFORMATION & EDUCATION:
Joe Ross-Trading Educators' popular free Chart Scan Newsletter has been published since 2004.
Note: Unless otherwise noted, all charts used in Chart Scan commentary were created
by using Genesis Financial Technologies' Trade Navigator (with permission).
Legal Notice and Copyright 2016 Disclaimer - Published by Trading Educators, Inc.
Chart Scan is a complimentary educational newsletter.
© by Trading Educators, Inc. Re-transmission or reproduction of any part of this material is strictly prohibited without prior written consent.
Edition 625 - June 3, 2016
The Law of Charts with Commentary
by Master Trader Joe Ross
Author, Trader, Trading Mentor, and Founder of Trading Educators, Inc.
Tradable Markets
Regardless of what you trade, or where you live, the price of crude oil is going to affect your life. We are receiving many emails asking us about crude oil prices. Will they go higher? Will they go lower? Will the release of export restrictions bring down the price of crude oil and thus the price of gasoline?
My friends, I do not have the answers. When they passed out crystal balls, they somehow overlooked me. However, I think this might be a good opportunity to see what the daily chart was telling us some years ago. While we discuss the daily chart, please realize that as I wrote this the weekly and monthly charts show crude still in an uptrend, with the monthly chart indicating that the rise may have been be a bit too steep. On my charts oil prices had become increasingly parabolic.
Now to the daily October crude oil futures chart, on which I will show only prices since June in order to conserve space.
Clearly, the dotted uptrend line had been broken. I drew a solid horizontal line at the base of what was officially a trading range in accordance with The Law of Charts. The arrow points to a price bar which typifies the vertical midpoint of the trading range. Inclusive of that bar, prices had been consolidating for 21 days. The Law of Charts states a probability of a breakout of the trading range is most likely to occur on days 21-29.
We can also see the left shoulder and head of what might have become a classical "Head and Shoulders" formation.
What does all this mean? I can tell you only what it meant to me - you are, of course, entitled to your own opinion. Keeping in mind that I have trained myself to trade only what I see and not what I think, I extracted myself from anything to do with short-term crude oil futures, and was standing aside at the time. Short-term conclusion was: get out of any short-term long crude oil positions. Prepare for the eventuality that a right shoulder may form. Prepare for further consolidation. Wait to see what develops.
What did I think? I thought crude oil had a very good chance of going much higher - perhaps even hitting the $100/bbl mark, which it eventually did. But obviously, not just yet. So for long-term stock holdings, I was willing to run my trend line along the weekly chart, but quite frankly, the monthly chart seemed to be a bit overdone. Long-term conclusion? Crude oil price will consolidate here for awhile, perhaps go a bit lower. This was a good opportunity for getting long and holding on for higher prices.
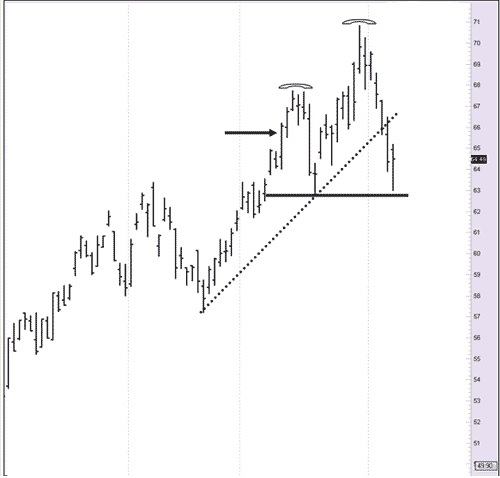
© by Joe Ross. Re-transmission or reproduction of any part of this material is strictly prohibited without the prior written consent of Trading Educators, Inc.
Passion for Trading
by Master Trader Joe Ross
Author, Trader, Trading Mentor, and Founder of Trading Educators, Inc.
After months of trading in a slump, Jake tells his best friend, "I think I want to quit the trading business. Why am I doing it? There must be a better way to make a living."
Have you ever felt like Jake? Trading is stressful and demanding. It's understandable to feel like “throwing in the towel” at times. If you are ready to find a new job, or if you just don't seem to have the same passion for trading that you used to, there is a lot you can do to reignite your desire to trade the markets.
Trading is a tough business. If you lose your passion for trading, all it means is that you are human. Here's an obvious cure. Why not take the rest of the month off? Maybe you're just stressed out. A little rest will help put things back in perspective. Once you are rested, relaxed, and re-energized, you'll be ready to tackle the markets with zeal.
Here's another strategy. Remind yourself of how great trading really is. You work for yourself (unless you are an institutional trader). You can work at your own pace, and feel that you have freedom. Remember what it was like to work a 9-to-5 job?
"Absence makes the heart grow fonder." Maybe you could arrange to visit a friend for a day at a regular 9-to-5 job. Or, when it is the holiday season, you could take time off from trading and find a part-time holiday job. It's not forever. It's just a way to rebuild your passion. Sometimes we forget why we trade. It’s like having a thrilling sports car, we start to see the “thrilling” job of trading as mundane. Drive a compact car for a week and you'll see how great your sports car drives. Work at a regular 9-to-5 job for a few weeks, and you will quickly rediscover your passion for trading. It may sound extreme, but it works. Maybe even after the first day, you'll think, "Oh, now I remember why I became a trader."
It's hard to trade successfully day in and day out. Some traders never lose their passion, but many forget just how exciting the markets can be. If you lose your passion, don't sit around sulking about how boring life can be. Go out to see how the other-half lives. You'll remember why trading is a great profession. And you will trade with renewed passion.
© by Joe Ross. Re-transmission or reproduction of any part of this material is strictly prohibited without the prior written consent of Trading Educators, Inc.
Trading Plan Series - Part 3
by Master Trader Andy Jordan
Educator for Spreads, Options, Swing/Day Trading, and Editor of Traders Notebook
In part 3 of our Trading Plan Series, we talk about how important it is to know yourself and to know your purpose.
© by Andy Jordan. Re-transmission or reproduction of any part of this material is strictly prohibited without the prior written consent of Trading Educators, Inc.
Trading Plan Series - Part 4
by Master Trader Andy Jordan
Educator for Spreads, Options, Swing/Day Trading, and Editor of Traders Notebook
In part 4 of our Trading Plan Series, Andy explains how to set the right trading goals.
© by Andy Jordan. Re-transmission or reproduction of any part of this material is strictly prohibited without the prior written consent of Trading Educators, Inc.
Andy's Blog Post - Controlling Emotions
by Master Trader Andy Jordan
Educator for Spreads, Options, Swing/Day Trading, and Editor of Traders Notebook
Winning traders cannot afford to be influenced by their emotions. The nature of trading demands an objective, logical approach. If you experience extreme excitement after a win and extreme disappointment after a loss, you will be living on an emotional roller coaster: up and down, up and down. Read more.
© by Andy Jordan. Re-transmission or reproduction of any part of this material is strictly prohibited without the prior written consent of Trading Educators, Inc.
Trading Error: Trading Your P&L
by Master Trader Marco Mayer
Educator for Forex and Futures, Systematic Trader, and
Creator of Ambush Trading Method and AlgoStrats.com.
In this week's video, Marco talks about another very common trading mistake: trading your P&L instead of the actual market action. If you're struggling to become a winning trader, this might be an eye-opener, especially if you're a breakeven trader right now. If you have any questions, feel free to This email address is being protected from spambots. You need JavaScript enabled to view it., or post it in our Blog or Forum.
(AlgoStrats.com - Coming Soon!)
© by Marco Mayer. Re-transmission or reproduction of any part of this material is strictly prohibited without the prior written consent of Trading Educators, Inc.
Check out our Blog!
To view previous published Chart Scan newsletters, please log in or click on "Join Us,"
shown above, to subscribe to our free "Members Only" section.
A WEALTH OF INFORMATION & EDUCATION:
Joe Ross-Trading Educators' popular free Chart Scan Newsletter has been published since 2004.
Note: Unless otherwise noted, all charts used in Chart Scan commentary were created
by using Genesis Financial Technologies' Trade Navigator (with permission).
Legal Notice and Copyright 2016 Disclaimer - Published by Trading Educators, Inc.
Chart Scan is a complimentary educational newsletter.
© by Trading Educators, Inc. Re-transmission or reproduction of any part of this material is strictly prohibited without prior written consent.
Edition 623 - May 20, 2016

The Law of Charts with Commentary
by Master Trader Joe Ross
Author, Trader, Trading Mentor, and Founder of Trading Educators, Inc.
Forex Trade
We’re referencing an older dollar-yen forex pair at a time that the Yen was making strong moves. There is a lesson to be learned from this older chart.
The move began with a 1-2-3 low formation. The number 2 point was violated, and then followed by three Ross hooks - two of them being the double-high kind. The Law of Charts states that following the breakout of the #2 point of a 1-2-3 low, every failure by prices to move higher constitutes a Ross hook.
On Monday, the 26th of September, prices failed to move higher, thereby giving us a Ross hook. The question then was: should we take a Traders Trick Entry with only a 2-tick difference between the highs of Friday the 23rd and Monday the 26th? I can only tell you what my own decision was, and why I decided to take the Traders Trick with only 2-tick’s clearance between Friday's high and Monday's high.
As I looked to the left of the chart, I saw that traders probably have stops just above 112.87. Contrary to the popular belief that there is no stop-running in forex, the truth is exactly the opposite: there is plenty of stop-running - but that's a story for another day. I figured if they took out Monday's high of 112.59, there was a good chance they would take a shot at 112.87, giving me enough pips on a day trade to take in the money I wanted to achieve from the trade. As you can see, they more than met my expectations, taking prices all the way to 113.51. I have often said that every trader needs to have rules, but there are times when common sense tells you to break those rules. That's what I did on Tuesday, September 27.
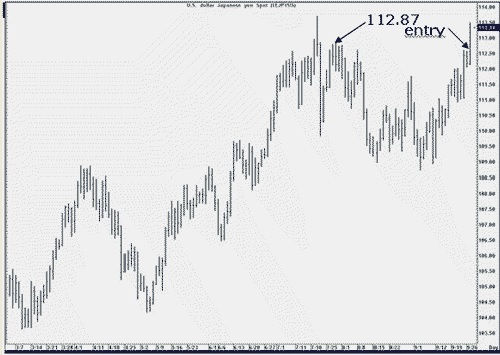
© by Joe Ross. Re-transmission or reproduction of any part of this material is strictly prohibited without the prior written consent of Trading Educators, Inc.
Can exchanges change the rules any time they want to?
by Master Trader Joe Ross
Author, Trader, Trading Mentor, and Founder of Trading Educators, Inc.
Yes, they certainly can, and do. In 2015-16 NASDAQ eliminated all types of orders other than limit orders. Following shortly after, NYSE did the same thing. The thought of not being able to place a stop-loss order in the market was mentally devastating to many traders. The same was true for eliminating “Good 'til Canceled” orders (GTC). This action by the exchanges threatened to seriously reduce trading volume, and to force traders into becoming day traders, having to sit in front of a screen all day long simply to monitor their positions. The only other choice would have been to trade stocks only through mutual funds and exchange-traded funds.
Fortunately, most, if not all, stock brokers changed their software to handle these, and even more kinds of orders than the exchanges had ever allowed.
In 1980, few who were trading at the COMEX at the time the Hunt brothers tried to corner the silver market, will ever forget that the exchange forbid the Hunt's from buying silver futures.
Federal commodities regulators introduced special rules to prevent any more long-position contracts from being written or sold for silver futures. This stopped the Hunts from increasing their positions by temporarily suspending the fundamental rules of the commodities markets.
© by Joe Ross. Re-transmission or reproduction of any part of this material is strictly prohibited without the prior written consent of Trading Educators, Inc.
Trading Idea
by Master Trader Andy Jordan
Educator for Spreads, Options, Swing/Day Trading, and Editor of Traders Notebook
This week Andy is looking at a Crude Oil calendar spread going long the December and short the July Crude Oil.
© by Andy Jordan. Re-transmission or reproduction of any part of this material is strictly prohibited without the prior written consent of Trading Educators, Inc.
Trading Error: Stop Trading At the Worst Time
by Master Trader Marco Mayer
Educator for Forex and Futures, Systematic Trader, and Creator of Ambush Trading Method
Marco talks about one of the most common mistakes traders do: stopping following their strategy just at the worst time possible. He also gives you some insights on why that is, and why methods have drawdowns at all. With this understanding you can learn to better deal with drawdowns which are simply part of the trading business. If you have any questions, feel free to This email address is being protected from spambots. You need JavaScript enabled to view it., post it in our Blog or Forum.
( Stay tuned while Mayer Marco puts on the finishing touches to: AlgoStrats.com. )
© by Marco Mayer. Re-transmission or reproduction of any part of this material is strictly prohibited without the prior written consent of Trading Educators, Inc.
Don't miss out! Sale ends this Sunday for Andy Jordan's Traders Notebook. Click Here for more details, and watch Andy's video that gives you a sneak peek to the Traders Notebook Campus.
Check out our Blog!
To view previous published Chart Scan newsletters, please log in or click on "Join Us,"
shown above, to subscribe to our free "Members Only" section.
A WEALTH OF INFORMATION & EDUCATION:
Joe Ross-Trading Educators' popular free Chart Scan Newsletter has been published since 2004.
Note: Unless otherwise noted, all charts used in Chart Scan commentary were created
by using Genesis Financial Technologies' Trade Navigator (with permission).
Legal Notice and Copyright 2016 Disclaimer - Published by Trading Educators, Inc.
Chart Scan is a complimentary educational newsletter.

