

Newsletters (208)
Children categories
Edition 712 - February 2, 2018


Exciting News - Forex Best Awards 2018
by Professional Trader Marco Mayer
Educator for Forex and Futures, Systematic Trader, and
Creator of Ambush Trading Method, Ambush Signals, and AlgoStrats.com
Marco has been nominated at FxStreet for the "Forex Best Awards 2018" in the category "Best Educational Article" for his article "5 Tips to improve your day trading" (link to http://www.tradingeducators.com/blog-page/5-tips-to-improve-your-day-trading). If you also liked the article which of course was published on Chart Scan first and have a minute, help Marco win the Award by voting for his article at https://goo.gl/forms/Z3K8LIjtr6RYz0z62. You'll find Marco's article in the category "Best Educational Article" and can simply select "Don't know" on all of the other categories.
Kind regards
Marco
Feel free to email Marco Mayer with any questions, This email address is being protected from spambots. You need JavaScript enabled to view it..
© by Marco Mayer. Re-transmission or reproduction of any part of this material is strictly prohibited without the prior written consent of Trading Educators, Inc.

Trading Blog - What should I do after closing out a trade?
by Professional Trader Andy Jordan
Educator for Spreads, Options, Swing/Day Trading, and
Editor of Traders Notebook Complete and Traders Notebook Outrights
You must be disciplined in following the plan of your trade religiously. Once you have closed your position, you should...read more.
Andy Jordan is the editor for Traders Notebook which shows you Futures Trading Strategies in Spreads, Options, and Swing Trades. Learn step-by-step how to trade successfully.
Click Here - Traders Notebook
Yes, I want additional information!
© by Andy Jordan. Re-transmission or reproduction of any part of this material is strictly prohibited without the prior written consent of Trading Educators, Inc.

Chart Scan with Commentary - Trading Sugar off the COT Report
by Master Trader Joe Ross
Author, Trader, Trading Mentor, and Founder of Trading Educators, Inc.
Developer of Instant Income Guaranteed
If you want to see how to make a contrarian long-term trade, you might consider looking at the positions on the COT report.
As of November 2017, sugar was really down, and way oversold, but had begun to rally. Sugar prices were down nearly 60% from 2010 and 29% from the previous year. The Commitment of Traders (COT) report revealed that traders were more negative on sugar than ever before.
COT details the real-money bets of futures traders. It tells us whether traders are excited about or disinterested in a commodity market.
That means it's a useful contrarian tool... When traders all agree on an outcome, it's a good idea to bet against them.
And futures traders have become extremely bearish on sugar in recent months. Take a look...

The COT report hit its most negative level ever in August, -77,495. It has rebounded slightly to 34,270 since then.
The negativity is a good thing for traders looking for big opportunity, based on history.
You want to be in sugar when the COT is this negative. Historically, sugar prices have soared when the COT fell below and then rose back above -35,000. Being in sugar when it is this negative has led to dramatically high returns. As I write this, sugar prices have rebounded recently. There are a number of ways you can trade this, here are a few suggestions.
Via the stock market:
- Long the iPath Sugar Subindex Total Return ETN (SGG)
- Buy a CALL LEAP option (long-dated option)
- Buy SGG and sell a CALL LEAP option
- Sell a PUT LEAP option to gain a lot of premium
Via the futures market:
- Go long July, or October 2018 futures
- Buy a CALL LEAP option
- Sell a PUT LEAP option to gain a lot of premium

© by Joe Ross. Re-transmission or reproduction of any part of this material is strictly prohibited without the prior written consent of Trading Educators, Inc.
Trading Article - Seeing what you want to See
by Master Trader Joe Ross
Author, Trader, Trading Mentor, and Founder of Trading Educators, Inc.
Developer of Instant Income Guaranteed
Some people live in a world of delusion and fantasy. They see what they want to see and ignore what they don't want to see. Traders are especially prone to this ailment. When your money is on the line, you are consumed with avoiding loss. Trading is a competitive business where few make it in the long term. This fact always lurks in the back of your mind, putting added pressure on you. In the back of your mind, you wonder, "How am I going to make it?" Sure, you know that you must make it and that allowing pessimism to take hold will do nothing more than throw you off track, but the possibility of failure is always there, working behind the scenes to thwart your efforts. With all this psychological pressure it's hard to stay objective. There's a powerful need to see what you want to see.
staying objective is difficult It's important to distinguish between the data and your interpretations of the data. View as neutral both the events and your inclination to impose your interpretations on them. Enter the market without expectations, surrendering to it rather than struggling with it for personal gain.
How can you stay objective? The first thing you must do is trade with money you can afford to lose and manage your risk. If your entire financial future is on the line on a single trade, you will be consumed with anxiety, self-doubt, and frustration. But if you risk relatively little on a single trade, you'll know deep down that you can live with the negative consequences should the trade be a loser. It's useful to follow the old trading adage, "Risk so little capital on a trade that you ask yourself, 'Why am I even bothering to put on this trade?”
The second thing you must do to stay objective is to take your ego out of the trade. You cannot control the markets, so why put your ego on the line with your money? Don't make winning or losing a personal issue? Why put your ego on the line with each trade? Why gloat when you are lucky enough to have the odds work in your favor and sulk when the odds go against you? It's not personal in the end. There's little you can do but stay calm, try your best, and accept where the markets take you. Ironically, if you can identify and control what you can (such as risk management and a sound trading strategy), and accept what you cannot (the outcome of a trade), you will feel calm and be able to trade in a peak performance mindset. And the calmer you feel, the more open you will be to seeing the markets as they are, rather than what you want them to be.
© by Joe Ross. Re-transmission or reproduction of any part of this material is strictly prohibited without the prior written consent of Trading Educators, Inc.

Trading Example: Instant Income Guaranteed
Philippe Gautier: Administration and New Developments
Developer: Joe Ross
TRADE WITH NO LOSSES
Here's our latest example!
GDX Trade
On 9th January 2018 we gave our Instant Income Guaranteed subscribers the following trade on Market Vectors Gold Miners ETF (GDX). Price insurance could be sold as follows:
- On 10th January 2018, we sold to open GDX Mar 16 2018 21.5P @ 0.265$ (average price), with 66 days until expiration and our short strike about 7% below price action.
- On 16th January 2018, we bought to close GDX Mar 16 2018 21.5P @ 0.12$, after 6 days in the trade for quick premium compounding.
Profit: 14.50$ per option
Margin: 430$
Return on Margin annualized: 205.14%
Philippe

Receive daily trade recommendations - we do the research for you.
♦ SIGN UP TODAY! THIS IS WORTH THE INVESTMENT ♦
Learn More!
Instant Income Guaranteed
© by Joe Ross and Philippe Gautier. Re-transmission or reproduction of any part of this material is strictly prohibited without the prior written consent of Trading Educators, Inc.
To view previous published Chart Scan newsletters, please log in or click on "Join Us,"
shown above, to subscribe to our free "Members Only" section.
A WEALTH OF INFORMATION & EDUCATION:
Joe Ross-Trading Educators' popular free Chart Scan Newsletter has been published since 2004.
Note: Unless otherwise noted, all charts used in Chart Scan commentary were created
by using Genesis Financial Technologies' Trade Navigator (with permission).
Legal Notice and Copyright 2018 Disclaimer - Published by Trading Educators, Inc.
Chart Scan is a complimentary educational newsletter.
© by Trading Educators, Inc. Re-transmission or reproduction of any part of this material is strictly prohibited without prior written consent.
Edition 711 - January 26, 2018
Chart Scan with Commentary - The Law of Charts
by Master Trader Joe Ross
Author, Trader, Trading Mentor, and Founder of Trading Educators, Inc.
Developer of Instant Income Guaranteed
I am often challenged with regard to the Law of Charts. "How do you know it's a law?" The answer is that TLOC can be seen on any chart that has a range of values.
As I have often stated, the impetus for TLOC is the human action and reaction to the movement of prices. However, it is possible to see TLOC in action due to a variety of causes. The chart below shows what I mean.

This chart was produced by a random number generator using MS Excel. It really would have been nice for trading. In the future I want to show you another chart that proves TLOC is real. However, for now, please realize that TLOC is not a method or a system; it is a law. As with any law or precept, it is up to you as the trader to come up with a way to make money from the fact that TLOC will make patterns of consolidation, 1-2-3s, and Ross hooks.
Joe Ross knows trading!
Click on the links below to learn about his trading method!
Trading the Ross Hook
The Law of Charts
Traders Trick Entry
© by Joe Ross. Re-transmission or reproduction of any part of this material is strictly prohibited without the prior written consent of Trading Educators, Inc.
Trading Article - Stress and Vulnerability
by Master Trader Joe Ross
Author, Trader, Trading Mentor, and Founder of Trading Educators, Inc.
Developer of Instant Income Guaranteed
Many traders underestimate the influence of stress. Stress is not only a psychological reaction, but a biological response as well. When you are stressed, your body reacts instinctively. You are agitated, on edge, and ready to lash out. Your attention is restricted. Your mind is closed and inflexible. The stress response has a specific biological, adaptive function: Your energy is channeled into making the simple response of fighting an opponent or running away. Not only is your energy channeled, but your perceptions are limited. Trading requires a more complicated skill set, though, and when you feel stressed out, you are bound to make a trading error.
It's surprising how stress can impact your ability to trade effectively. What's there to impact? Trading isn't that complicated, is it? Actually, there's a great deal that can happen. You can have a very complete trading plan, where every aspect is spelled out clearly, and you may have a wealth of experience executing such plans, but when you are stressed out, even the simplest task can be difficult to complete. You may not see an obvious signal to take action. And even when you see the signal, you can make a small mistake when you're stressed. Again, you are agitated and your psychological perceptions and intuition are restricted and closed off. You miss little things and have a tendency to respond quickly without thinking. While trading, we often do things automatically, without thinking, but stress can cause us to act so quickly that we miss something. We may forget to place an order according to plan or we may misread a signal and close out a position too early. These little errors can add up to disaster.
How can you beat stress? The most effective stress control strategies prevent stress before it happens. It is useful to minimize potential stressors. Getting into an argument with your spouse, for example, can put you in a bad mood that can escalate into an intense, distracting mood later in the day. Minor hassles can build up. For example, you may get cut off on the way to work, or the police may wrongly give you a traffic ticket. It can all add up, and set the stage for an incapacitating stress response. It’s important to acknowledge the power of these stressors, and when you feel agitated by them, you may want to stand aside until you feel better. Your trading environment can also impact your ability to handle stress. In many ways, trading is an art. You wouldn't try to create art in a noisy, chaotic environment, and you may not want to trade in such an environment either.
Trading requires an optimal mindset. When you are upset, tired, and emotionally distracted, you will have trouble following your trading plan. You must return to a calm, focused mindset, a mindset where you are attentive and alert, and can trade like a winner.
© by Joe Ross. Re-transmission or reproduction of any part of this material is strictly prohibited without the prior written consent of Trading Educators, Inc.
Performance Track Record: Instant Income Guaranteed
Philippe Gautier: Administration and New Developments
Developer: Joe Ross
TRADE WITH NO LOSSES
HERE'S THE PROOF!
Check out our Performance Track Record page!

Check out our Performance Track Record page!
Receive daily trade recommendations - we do the research for you.
♦ SIGN UP TODAY! THIS IS WORTH THE INVESTMENT ♦
Learn More!
Instant Income Guaranteed
© by Joe Ross and Philippe Gautier. Re-transmission or reproduction of any part of this material is strictly prohibited without the prior written consent of Trading Educators, Inc.
Trading Idea - Short Euro FX (or long on a strong break above 1.2500)
by Professional Trader Andy Jordan
Educator for Spreads, Options, Swing/Day Trading, and
Editor of Traders Notebook Complete and Traders Notebook Outrights
Today, I want to have a closer look at the Euro FX, especially at the all time net short position of the Commercials. While the COT report can give a trader some kind of “road map”, it is not meant to be a timing tool, as you can see on the chart below. The market did NOT turn around at the low levels of the COT Commercials chart (red line on the chart below), it took the market more time until it finally turned to the down-side. But not only the COT chart with the extreme levels look interesting, also the 1.2500 level is an interesting level because very often old support levels turn into resistance and vise versa. As I said before, I would not time my trades using COT (or seasonal) charts, but with possible resistance at 1.2500 we might see a lower Euro FX soon. On the other hand, if we move strongly above 1.2500 and the Commercials get caught on the wrong foot, we might easily see 1.4000.

Receive daily guidance from Andy Jordan! Traders Notebook Complete shows you Futures Trading Strategies in Spreads, Options, and Swing Trades. Learn step-by-step how to trade successfully.
Click Here - Traders Notebook Complete
Yes, I want additional information!
© by Andy Jordan. Re-transmission or reproduction of any part of this material is strictly prohibited without the prior written consent of Trading Educators, Inc.
Trading Article - Trading Bitcoin and other Cryptocurrencies
by Professional Trader Marco Mayer
Educator for Forex and Futures, Systematic Trader, and
Creator of Ambush Trading Method, Ambush Signals, and AlgoStrats.com
After I mentioned that I’ve been doing trading the crypto currencies last year there’s been quite some feedback from you with questions about these new markets.
So I thought I’d share my thoughts about the crypto markets, my experiences regarding trading these and hopefully give you some useful tips on how to get started.
First of all, these crypto currency markets are still quite in the early stages of development. Volatility is often crazy, exchanges and brokers are still not fully established in terms of stability and features and every now and then there’s still something crazy happening like bitcoins getting stolen, exchanges going bust and so forth. It kind of reminds of the early days of retail forex trading even though the actual markets are completely different of course.
There’s Bitcoin Futures trading at the CME now but the liquidity isn’t really there yet. After having tried different crypto exchanges, I’m now using gdax.com which is quite well regulated and so far I’m having no issues at all trading there. Liquidity usually is very good and even when the markets go a bit crazy the platform works just fine. Another one that I didn’t try personally as it’s for US citizens only but that I’ve heard is good too is gemini.com.
Personally I still avoid having large sums of money at any of the crypto exchanges. To invest in a coin I do the trade at the exchange and then sent the actual coins to my electronic wallet instead of leaving them at the exchange. If I want to get out I sent the coins to the exchange, do the trade and withdraw the money back to my bank account. This way the risk of losing money when an exchange goes under is minimized.
New markets also have many advantages though, especially for us private traders. The biggest is that there’s less competition as the professionals aren’t in there yet. Even though there’s bitcoin futures trading at the CME now, hardly any of the very tough competitors you have in the currency or stock future markets are there yet.
This makes is quite easy to trade these markets if you’re used to trading much more difficult markets. They’re mostly driven by private investors and many well known strategies that stopped working in most markets long ago work very well in the crypto currency markets. One example are simple breakout and momentum strategies. When these markets start moving, they often do so in a very nice and "clean" way.
Happy Crypto-Trading!
Marco
Feel free to email Marco Mayer with any questions, This email address is being protected from spambots. You need JavaScript enabled to view it..
© by Marco Mayer. Re-transmission or reproduction of any part of this material is strictly prohibited without the prior written consent of Trading Educators, Inc.
To view previous published Chart Scan newsletters, please log in or click on "Join Us,"
shown above, to subscribe to our free "Members Only" section.
A WEALTH OF INFORMATION & EDUCATION:
Joe Ross-Trading Educators' popular free Chart Scan Newsletter has been published since 2004.
Note: Unless otherwise noted, all charts used in Chart Scan commentary were created
by using Genesis Financial Technologies' Trade Navigator (with permission).
Legal Notice and Copyright 2018 Disclaimer - Published by Trading Educators, Inc.
Chart Scan is a complimentary educational newsletter.
© by Trading Educators, Inc. Re-transmission or reproduction of any part of this material is strictly prohibited without prior written consent.
Edition 710 - January 19, 2018
Blog Post - Keeping a Trading Journal
by Professional Trader Andy Jordan
Educator for Spreads, Options, Swing/Day Trading, and
Editor of Traders Notebook Complete and Traders Notebook Outrights
I keep one of sorts, it is part of my monthly homework. The journal is very basic and includes...read more.
Receive daily guidance from Andy Jordan! Traders Notebook Complete shows you Futures Trading Strategies in Spreads, Options, and Swing Trades. Learn step-by-step how to trade successfully.
Click Here - Traders Notebook Complete
Yes, I want additional information!
© by Andy Jordan. Re-transmission or reproduction of any part of this material is strictly prohibited without the prior written consent of Trading Educators, Inc.
Chart Scan with Commentary - Enter a Position in Gold or Silver
by Master Trader Joe Ross
Author, Trader, Trading Mentor, and Founder of Trading Educators, Inc.
Developer of Instant Income Guaranteed
When economic times become volatile times, investors run to hard assets. Gold is a favorite hard asset in which to run, but keep in mind that gold loves to swing, even when it is trending. Recently, we've seen perfect setups for attempting to enter positions in gold based on the setups we teach at Trading Educators. The chart below shows exactly what I mean. The Law of Charts made it clear. I have shown where there were entry opportunities in gold. Three were short setups and two were long setups for short-term scalps. Trading gold, or silver should be obvious in times where people are looking for safe havens.
There are essentially two ways to "play" gold. One: Trade the swings in gold. Two: Buy and hold. Gold is most likely on its way to at least $5,000, and if we get the much anticipated “global currency reset,” we could easily see $10,000.

© by Joe Ross. Re-transmission or reproduction of any part of this material is strictly prohibited without the prior written consent of Trading Educators, Inc.
Trading Article - Mastering Yourself
by Master Trader Joe Ross
Author, Trader, Trading Mentor, and Founder of Trading Educators, Inc.
Developer of Instant Income Guaranteed
If we had a crystal ball, trading would just be a matter of buying at a bottom, holding the stock as the price continued to rise, and selling near a top, right before the public sells in a state of panic. But we don't have a crystal ball, and there is no foolproof way to forecast the markets. Sure, if you have enough capital, are willing to wait long enough for a stock price to increase, and will be satisfied with a small profit, you can identify a few key stocks that will pay off handsomely with a buy-and-hold strategy. But that isn't what you're looking for. If you are like most traders, you are trying to capitalize on short-term moves to make big gains over and over again, and in the long run, mount a series of impressive wins. To accomplish this goal, you need to control your impulses and emotions. You need to cultivate enough energy to study the markets and search for profitable setups. But the work doesn't end there. You also need to execute your trading plan with smoothness and agility.
A cursory review of history reveals a host of people who have fallen victim to self-sabotage. They range from presidents Ulysses S. Grant to Bill Clinton, from Charles M. Schwab of U.S. Steel to Dennis Kozlowski of Tyco International. These individuals rose from humble beginnings to accumulate wealth, fame, and power. Yet in the end, they took extreme risks and paid a steep price. Upon hearing their stories, it's tempting to think they had a motive for self-sabotage, a hidden demon ready to undermine all that they had accomplished.
Most of the articles in Chart Scan are about gaining a mental edge, and when you trade with a mental edge, you increase your odds of winning. This sentiment is expressed by the many trading experts. By understanding your motives and setting goals, as well as consciously controlling your state of mind, you can manage anxieties, focus concentration, and enhance our confidence as traders. In addition, by using specific psychological skills you can greatly improve your performance. These skills will increase your level of personal enjoyment and fulfillment.
At Trading Educators, we try to bring you knowledge from our own journey through life as a trader. We would like this opportunity to thank you for reading, and allowing us to help you master the markets and be the best trader that you can be. If you set realistic goals, work hard to gain market experience, and manage your mental state, you will be one of the few who become a winning trader.
© by Joe Ross. Re-transmission or reproduction of any part of this material is strictly prohibited without the prior written consent of Trading Educators, Inc.
Trading Example: Instant Income Guaranteed
Philippe Gautier: Administration and New Developments
Developer: Joe Ross
SSYS TRADE
On 10th January 2018 we gave our Instant Income Guaranteed subscribers the following trade on Stratasys Inc (SSYS). Price insurance could be sold as follows:
- On 11th January 2018, we sold to open SSYS Feb 23 2018 18.5P @ 0.30$, with 42 days until expiration and our short strike about 14% below price action.
- On 12th January 2018, we bought to close SSYS Feb 23 2018 18.5P @ 0.15$, after 1 day in the trade for very quick premium compounding.
Profit: 15$ per option
Margin: 370$
Return on Margin annualized: 1479.73%
Philippe

Receive daily trade recommendations - we do the research for you.
TRADE WITH NO LOSSES!
♦ SIGN UP TODAY! THIS IS WORTH THE INVESTMENT ♦
© by Joe Ross and Philippe Gautier. Re-transmission or reproduction of any part of this material is strictly prohibited without the prior written consent of Trading Educators, Inc.
Trading Video - Why having a view on a market isn't enough.
by Professional Trader Marco Mayer
Educator for Forex and Futures, Systematic Trader, and
Creator of Ambush Trading Method, Ambush Signals, and AlgoStrats.com
In this video, Marco Mayer talks about why having a view on the direction of a market isn't enough. The reason is that just having a directional view doesn't make a trade...find out why!
Happy Trading!
Marco Mayer
© by Marco Mayer. Re-transmission or reproduction of any part of this material is strictly prohibited without the prior written consent of Trading Educators, Inc.
To view previous published Chart Scan newsletters, please log in or click on "Join Us,"
shown above, to subscribe to our free "Members Only" section.
A WEALTH OF INFORMATION & EDUCATION:
Joe Ross-Trading Educators' popular free Chart Scan Newsletter has been published since 2004.
Note: Unless otherwise noted, all charts used in Chart Scan commentary were created
by using Genesis Financial Technologies' Trade Navigator (with permission).
Legal Notice and Copyright 2018 Disclaimer - Published by Trading Educators, Inc.
Chart Scan is a complimentary educational newsletter.
© by Trading Educators, Inc. Re-transmission or reproduction of any part of this material is strictly prohibited without prior written consent.
Edition 709 - January 12, 2018

~ Use Coupon Code During Checkout ~
newyear
Trading is a Business
Trading the Ross Hook
Life Index
Recorded Webinars:
The Law of Charts In-Depth
Traders Trick - Advanced Concepts
Blog Post - The "Now Trap"
by Professional Trader Andy Jordan
Educator for Spreads, Options, Swing/Day Trading, and
Editor of Traders Notebook Complete and Traders Notebook Outrights
There is a great attraction in all aspects of the modern age to immediacy. Likewise, most of the trouble in trading occurs through...read more.
Receive daily guidance from Andy Jordan! Traders Notebook Complete shows you Futures Trading Strategies in Spreads, Options, and Swing Trades. Learn step-by-step how to trade successfully.
Click Here - Traders Notebook Complete
Yes, I want additional information!
© by Andy Jordan. Re-transmission or reproduction of any part of this material is strictly prohibited without the prior written consent of Trading Educators, Inc.
Chart Scan with Commentary - Trading the Obvious
by Master Trader Joe Ross
Author, Trader, Trading Mentor, and Founder of Trading Educators, Inc.
Developer of Instant Income Guaranteed
I can't recall how many times I have said or written, "Trade what you see, not what you think." In fact, those very words have become my motto. In this week's Chart Scan, let's look at the obvious — an easy trade that requires nothing more than the willingness to take a look. So many traders have their noses buried in indicators that it is a wonder they don't suffocate. If you look at the daily chart shown below, you will see that once prices violate a #2 point and then violate a Ross Hook, you can expect at least one more hook violation and often two. However, be careful about expectations once prices have violated a third Ross Hook. The violation of a third hook is generally very near the end of a move. From there prices make a 1-2-3 formation at least temporarily ending the trend, or simply consolidate for a while. In the case below, prices made the 1-2-3 after a violation of the fourth hook.

© by Joe Ross. Re-transmission or reproduction of any part of this material is strictly prohibited without the prior written consent of Trading Educators, Inc.
Trading Article - Are You Sabotaging Yourself?
by Master Trader Joe Ross
Author, Trader, Trading Mentor, and Founder of Trading Educators, Inc.
Developer of Instant Income Guaranteed
People come from humble beginnings to achieve wealth, status, or fame. But to get ahead, successful people often had to break conventional rules. This readiness to break the rules is often associated with an affinity toward risk. Although they may achieve success, they may also have a shaky self-image. Sure they achieved a lot, but a voice deep inside their psyche still questions their self-worth or competence. They don't have the birthright and the psychological security that matches their current status in life. They beat the odds and they know it, but they never quite feel secure. Their demons lurk in the back of their mind, ready to take over.
Everyone has his or her talents. Some people are intelligent. Other people are natural born athletes while others have physical attractiveness that turns heads. The identity you form early in life can give you an ego boost when you need it, but may throw you off when you are under pressure. Bill Clinton, for example, described himself as an unattractive dork in his autobiography, "My Life." His early self-image didn't match his later success, and his hidden demon lurked below the surface. His need to validate his attractiveness and desirability led to his downfall.
Many people have insecurities and demons that can come out when they least expect them. If you question your intellectual ability, for example, you may be prone to question your trading decisions while under stress. A voice in the back of your mind may say, "Who do you think you are? You're not smart enough to completely trust your decisions." Your ability to combat these self-statements depends on your life experiences. Some people conquer their demons while other people try to ignore them. If you pretend they are not there, however, they can catch you off guard.
How do demons exert their power? Many demons have a common core. People with hidden insecurities feel that you don't belong and that they’re identify can collapse at any minute. In contrast, people who have conquered their demons may feel "natural" in whatever they do. Nothing is a big deal. For example, a person raised in the trading environment is more likely to see trading events as commonplace. Trading is natural. It's no big deal. Trading events are not imbued with emotional significance.
Other people have demons that may impact their trading. What are some popular ones? Consider the imposter demon. Imposters feel they don't belong in the trading profession. They feel that they are just faking it. They assume that they are going to get caught at any minute, so they might as well not take anything seriously. Then there is the gambler demon. Gamblers believe that they are just having fun. They like the risk. They like the rush. It's all about living in the moment and getting high. Some demons aren't as deep seated. Consider the slacker demon. Slackers spent most of their early life blowing off responsibility. They didn't do well in school and ended up a success later in life. Because they spent their early life avoiding structure and discipline, they easily entertain the idea of breaking the rules. They are likely to throw out their trading plan while under stress.
How do you fight your demons? First, gain awareness. Demons only impact you when you are not conscious of them. When you are aware of your secret demons, you can neutralize their power. Second, change your self-talk. When you feel unworthy or uncertain, remind yourself that you are worthy. Remind yourself that your effort will pay off eventually and that you should protect yourself and keep working hard. Don't let your demons sabotage your efforts. Gain awareness of them and fight them. You'll stay profitable in the long run if you do.
© by Joe Ross. Re-transmission or reproduction of any part of this material is strictly prohibited without the prior written consent of Trading Educators, Inc.
2017 Activity Summary: Instant Income Guaranteed
Philippe Gautier: Administration and New Developments
Developer: Joe Ross
In 2017, conditions were particularly hostile for premium selling, with especially low implied volatility levels. We still managed to reach our objectives.
- Safety
- With implied volatility particularly low during the whole year, we had to widen our choice of candidates again, to keep maximum safety. We managed to maintain, on all our trades, a safe distance between price action and our short strikes (see AA and BPOP examples below).

We only had to roll 3 times in 2017 (and all these newly rolled trades are now closed for a profit), as a result of our safety policy. The way we roll now takes a lot of research and is better avoided. This releases more time for back testing, improving Instant Income Guaranteed, etc.
- We banked profits on many of our new long term spread trades with unlimited upside potential, always using other people’s money. We recently closed a trade on BHP for instance, which lasted 556 days in total, giving us annualized returns on margin of 179.73% and on principal of 35.95%. This is a very low stress way of yielding 35.95%/year on your cash, maximizing your profits along the way. The only “risk” in this trade was to acquire BHP for a net price of 16.50$ (BHP was quoting 48.84$ on 9th Jan 2018).

As of the 9th January 2018, we have completely closed 8 of these trades and we have 25 of them still opened (out of these 25 trades, 12 have no more margin requirements as we bought to close for a profit the short legs).
- In the last few months of the year, I put my efforts on 2 main topics:
- Enter our trades closer to the beginning of a daily uptrend, which allowed us to get higher capital efficiencies and returns, in spite of a particularly low implied volatility (see TIF and CSX examples below):


Refining a new promising spread trade type, much shorter term than the initial one, with excellent annualized returns; after back testing, we entered our first live trade of this type the last trading day of the year.
Wishing you all a great trading year,
Philippe
Receive daily trade recommendations - we do the research for you!
♦ SIGN UP TODAY! THIS IS WORTH THE INVESTMENT ♦
© by Joe Ross and Philippe Gautier. Re-transmission or reproduction of any part of this material is strictly prohibited without the prior written consent of Trading Educators, Inc.
Trading Video - Outside Bars in the Russell 2000 Mini Future
by Professional Trader Marco Mayer
Educator for Forex and Futures, Systematic Trader, and
Creator of Ambush Trading Method, Ambush Signals, and AlgoStrats.com
Marco Mayer explains the "Outside Bars" pattern as an entry signal. He shows you how if it works as an entry signal in the Russell 2000 Mini Future and how to evaluate entry signals in general by using a systematic approach.
Happy Trading!
Marco Mayer
© by Marco Mayer. Re-transmission or reproduction of any part of this material is strictly prohibited without the prior written consent of Trading Educators, Inc.
~ Use Coupon Code During Checkout ~
newyear
Trading is a Business
Trading the Ross Hook
Life Index
Recorded Webinars:
The Law of Charts In-Depth
Traders Trick - Advanced Concepts
Check out our Blog!
To view previous published Chart Scan newsletters, please log in or click on "Join Us,"
shown above, to subscribe to our free "Members Only" section.
A WEALTH OF INFORMATION & EDUCATION:
Joe Ross-Trading Educators' popular free Chart Scan Newsletter has been published since 2004.
Note: Unless otherwise noted, all charts used in Chart Scan commentary were created
by using Genesis Financial Technologies' Trade Navigator (with permission).
Legal Notice and Copyright 2018 Disclaimer - Published by Trading Educators, Inc.
Chart Scan is a complimentary educational newsletter.
© by Trading Educators, Inc. Re-transmission or reproduction of any part of this material is strictly prohibited without prior written consent.
Edition 708 - January 5, 2018
Chart Scan with Commentary - Wedges
by Master Trader Joe Ross
Author, Trader, Trading Mentor, and Founder of Trading Educators, Inc.
Developer of Instant Income Guaranteed
Once in a while I have a longing for the old “geometrical” ways of trading, which for some are still the best ways for trading. What I will show you incorporates the Law of Charts, but it does so while answering a question I received: “What is a bullish descending wedge pattern?” While I’m at it, I’ll show you a bearish ascending wedge.
As you can see in the first chart below, the wedge has grown increasingly narrow. Of course, where to begin drawing the wedge is somewhat in the eye of the beholder. I could have drawn the lower line from the May low (dotted line), and I could have gone way back to the high that occurred in November (not shown). I think you get the idea. The interesting thing is that as the wedge has narrowed, we see the beginning of what may turn out to be a 1-2-3 low. If I had room (I don’t’) I could also show you that from a technical point of view there is a rising trend line on MACD, indicating divergence.

The next chart below shows a narrowing rising wedge. Amazingly, prices have been trading at 300 times earnings! It stubbornly resisted the forces of gravity until just this week, when it formed a 1-2-3 high. Could we see more selling ahead? Could the descent be severe? It will be interesting to find out. But at least now you know what the old-timers called ascending and descending wedges. To make money out of these still requires good management. It is always challenging to see some traders make money from a trade while some traders lose money from the very same trade.

© by Joe Ross. Re-transmission or reproduction of any part of this material is strictly prohibited without the prior written consent of Trading Educators, Inc.
Trading Article - It’s not the Money, It's the Challenge
by Master Trader Joe Ross
Author, Trader, Trading Mentor, and Founder of Trading Educators, Inc.
Developer of Instant Income Guaranteed
Why do you trade? Most people would think it's obvious. It's for the money, right? What many winning traders know, however, is that money is a poor motivator in the end. It's much more satisfying to pursue trading for the pure joy of mastering the markets, regardless of how much money you make. Winning traders are motivated more by the process of trading than by the profits they are making. It's common to hear traders say, "I love trading so much that I would do it for free if I had to." Indeed, when one looks into the backgrounds of top traders, the story seems to be the same: They all tried to get a job in the trading industry as soon as possible, any job as long as it involved trading in some way. The markets fascinated them. The money was either secondary or not an issue at all. Successful traders love the challenges the market offers and view their work as meaningful.
Consider what Ben, a successful trader, said about money to our TE staff, "Money doesn't make a person happy. Trading is what I do and I enjoy doing it. The money aspect of it is obviously cool and everybody wants that, but I don't know how to do anything else." Staying detached and apathetic towards money can help put you in the proper mindset. Curt, a successful winning trader wrote in to say, "One of the reasons I was successful was because money wasn't the reason I wanted to trade. Because the allure of money wasn't the reason I was trading, it was a lot easier for me to withstand the ups and downs of the market, and to execute without that affecting the way I was executing." When you aren't worried about the money, you can take a more carefree approach to trading. You feel that you don't have to win, and knowing you can make a mistake here and there allows you to relax and trade more creatively.
In modern society, we are pushed to make money. We think we need money, and see trading as a way to make a lot of it. Ironically, if you are focused only on the money, you will become disappointed and eventually fail. Pursuing trading as a passion is a more satisfying way to trade. It's more useful to focus on pursuing goals that are intrinsically interesting and personally meaningful. One should pursue trading because he or she enjoys the intellectual challenge. Market action is intrinsically interesting. It is a rewarding intellectual challenge to devise innovative new trading strategies and to see how well your ideas pan out, just for the fun of it. Viewing trading from this perspective can powerfully motivate you.
Whether it's art, sports, or business, the folks at the top are not primarily motivated by fame, glory, respect, or status. They are driven by the pure love of the game. Winning traders, similarly, have strong interests in the markets, and this passion is the driving force that puts them at the top, year after year. Those who find trading intrinsically satisfying, enjoyable, and meaningful will put in the necessary hard work and achieve high performance levels. So don't focus on the money and status that successful trading may bring. Enjoy the process of trading. Seek out challenges and the satisfaction of meeting them. You'll end up more profitable by doing so.
© by Joe Ross. Re-transmission or reproduction of any part of this material is strictly prohibited without the prior written consent of Trading Educators, Inc.
Trading Idea: Instant Income Guaranteed
Philippe Gautier: Administration and New Developments
Developer: Joe Ross
Trade with No Losses
WDC Trade
On 12th December 2017 we gave our Instant Income Guaranteed subscribers the following trade on Western Digital Corporation (WDC). Price insurance could be sold a few days later on temporary weakness:
-
On 15th December 2017, we sold to open WDC Jan 19 2018 72.5P @ 0.65$ (average price), with 34 days until expiration and our short strike about 11% below price action.
-
On 18th December 2017, we bought to close WDC Jan 19 2018 72.5P @ 0.25$, after 3 days in the trade for quick premium compounding.
Profit: 40$ per option
Margin: 1450$
Return on Margin annualized: 335.63%
Kind regards,
Philippe

Receive daily trade recommendations - we do the research for you!
♦ SIGN UP TODAY! THIS IS WORTH THE INVESTMENT ♦
© by Joe Ross and Philippe Gautier. Re-transmission or reproduction of any part of this material is strictly prohibited without the prior written consent of Trading Educators, Inc.
Trading Example: KEK18 – ZWK18
by Professional Trader Andy Jordan
Educator for Spreads, Options, Swing/Day Trading, and
Editor of Traders Notebook Complete and Traders Notebook Outrights
This week, we're looking at KEK18 – ZWK18: long May 2018 Kansas Wheat and short May 2018 Chicago Wheat (KCBT on Globex).

Today we consider a Wheat Inter-Market spread: long May 2018 Kansas Wheat and short May 2018 Chicago Wheat. This trade is simply based on the seasonal statistic. With 22 winning trades in a row it looks promising. This trade should work out immediately because the seasonal time window (01/04 – 01/17) is really small.
Learn how we manage this trade and how to get detailed trading instructions every day by subscribing to Traders Notebook!
Click Here!
Yes, I want additional information!
© by Andy Jordan. Re-transmission or reproduction of any part of this material is strictly prohibited without the prior written consent of Trading Educators, Inc.
Trading Video - Trading Error: Averaging into a Losing Position
by Professional Trader Marco Mayer
Educator for Forex and Futures, Systematic Trader, and
Creator of Ambush Trading Method, Ambush Signals, and AlgoStrats.com
In this video, Marco talks about one of the most common, and also one of the most deadly mistakes traders can make, and that's averaging into a losing position. He also gives you some insights as to why this is so tempting, and shows you why you should avoid it at all costs.
Happy Trading!
Marco Mayer
© by Marco Mayer. Re-transmission or reproduction of any part of this material is strictly prohibited without the prior written consent of Trading Educators, Inc.
Check out our Blog!
To view previous published Chart Scan newsletters, please log in or click on "Join Us,"
shown above, to subscribe to our free "Members Only" section.
A WEALTH OF INFORMATION & EDUCATION:
Joe Ross-Trading Educators' popular free Chart Scan Newsletter has been published since 2004.
Note: Unless otherwise noted, all charts used in Chart Scan commentary were created
by using Genesis Financial Technologies' Trade Navigator (with permission).
Legal Notice and Copyright 2018 Disclaimer - Published by Trading Educators, Inc.
Chart Scan is a complimentary educational newsletter.
© by Trading Educators, Inc. Re-transmission or reproduction of any part of this material is strictly prohibited without prior written consent.
Edition 707 - December 29, 2017
HAPPY NEW YEAR!
2018

Happy New Year Traders
by Master Trader Joe Ross
Author, Trader, Trading Mentor, and Founder of Trading Educators, Inc.
Developer of Instant Income Guaranteed
With 2018 upon us, it's time to make plans for having a fruitful and productive new year. We have only a few days left before a new year of trading starts. It is a time to rejuvenate and re-energize, and one of the best ways to do that is to clean out all the old stuff you have littering your workstation. Organizing your workspace can make you feel in control, as if you are ready to tackle new challenges.
Clutter, full email inboxes and stacks of old paperwork can be distracting. Saved online articles and piles of newspapers you'll never read can make you feel as if the clutter is closing in on you, cramping your style and stressing you out a little. Removing some of the clutter often symbolically gives you increased psychological space and renewed creative vigor. You'll literally have more room to breathe. Some traders may prefer a messy workspace or unorganized files on their computer, but most people associate untidiness with confusion, chaos, and ultimately, stress. An organized workspace, in contrast, is less distracting. When you are trading, it's essential to focus on your screens. Clutter and disarray can grab your attention and shift it away from monitoring the trade of the moment. A clean, sparse and organized workspace is often refreshing.
It may take a little time and effort, but organizing your workspace pays off. And if you do it systematically, you'll get the job done in no time. The first step in organization is to delete old and throw out worthless information. This is the hardest part. We collect saved documents, books and papers because we think we will need them. Yet many times we accumulate so much stuff that its actual contribution is minimal. We'll never find the time to read all of it, and it will just take up valuable workspace. But it's hard to delete it or throw it away. It took time and energy to assemble these items, and throwing them out subtly suggests that you wasted your time collecting the stuff. But most of it can be tossed out. Make tough decisions and commit yourself to throwing out and deleting anything you don't really need.
For those who still have a love for paper copies, developing an informal filing system can be helpful. It doesn't have to be formal with folders for each topic and precise categories labeling each folder. Sometimes you can merely place documents for a particular task or project in a large attractive looking box. You can then pile the boxes in a corner of your office, or if it is still a distraction, you can stack the boxes in the garage. But it's important to get them off your desk and prevent them from encroaching on your workspace, and more importantly, on your mind.
Get a fresh start on 2018. The first trading day of the New Year is on Tuesday. Spend the rest of the week cleaning things out. You'll feel refreshed and invigorated, and ready to tackle the challenges of the New Year.
© by Joe Ross. Re-transmission or reproduction of any part of this material is strictly prohibited without the prior written consent of Trading Educators, Inc.
End of the Year with No Losses
Philippe Gautier: Administration and New Developments
Developer: Joe Ross
Another year of price insurance selling is coming to an end. Another year of trading without losses. This is the time for us to stop trading in this low liquidity environment during the last trading week of the year and spend more time with our families and friends. But time decay is still working for us on our existing positions, rewarding us for doing nothing.
We wish you a Happy New Year 2018.
Kind regards,
Philippe
© by Joe Ross and Philippe Gautier. Re-transmission or reproduction of any part of this material is strictly prohibited without the prior written consent of Trading Educators, Inc.
Start the New Year Healthy
by Professional Trader Andy Jordan
Educator for Spreads, Options, Swing/Day Trading, and
Editor of Traders Notebook Complete and Traders Notebook Outrights
2017 was for sure a very interesting year. Because of the missing volatility and direction it was very tough for me to swing trade on the daily chart. Selling options was difficult as well because the Implied Volatility stayed at the lower side of the range in most markets throughout the entire year. Not only trading was tough, I had to fight health issues as well at the last quarter of 2017. But we learn only during tough times and this year I learn a lot. What have I learned? I learned not to take things like money, work, or in general all material things so important and to concentrate much more on health than on anything else. And on family of course. At the end, that’s all that matters!
Regarding trading, I want to concentrate more on spreads again. 2018 will be the 15th year I am recommending spread trades in Traders Notebook and during all these years spreads have been an important part. In 2018, I want to push spread trading even more especially under these trading conditions we are in right now. Hopefully you will join the Traders Notebook Family in 2018!
I wish you and your loved ones a happy and healthy 2018!
Andy Jordan
© by Andy Jordan. Re-transmission or reproduction of any part of this material is strictly prohibited without the prior written consent of Trading Educators, Inc.
New Year Outlook
by Professional Trader Marco Mayer
Educator for Forex and Futures, Systematic Trader, and
Creator of Ambush Trading Method, Ambush Signals, and AlgoStrats.com
Dear Traders,
I'd like to thank all of you for a great year 2017! Like every year I feel like I’m the one who learned from you or by looking into topics that interested you about trading. It’s amazing how there’s always a new level of depth when it comes to trading that you couldn’t imagine before.
When it comes to actually trading, 2017 surely was a mixed year for me. While Ambush took off to new highs throughout the year in many markets, AlgoStrats:FX drifted into quite a drawdown that surely isn’t what I had expected starting into the year. This lead me to day trade more actively again which happily helped a lot.
I also did my first trades in the crypto currency markets this year and luckily that worked out quite well. Being long the equity markets wasn’t hurting either. But hey, you hardly could fail with that in 2017!
I'll spend the next week over Christmas with my family and friends, far away from the markets. That's what I strongly suggest to do during these days of low liquidity. Just do what everyone else does and relax. After the holidays I’ll go and travel for almost a month and decided to pull the plug completely this time and simply don’t trade at all. This is the first time I’m doing this for many years so I’m really looking forward to this.
So I'd like to wish all of you a Merry Christmas and a Happy New Year! Enjoy the holidays with your family and friends, and I'm looking forward to a great trading year 2018 with you.
Happy Trading!
Marco Mayer
© by Marco Mayer. Re-transmission or reproduction of any part of this material is strictly prohibited without the prior written consent of Trading Educators, Inc.
Happy New Year from “Behind the Scenes”
While we don’t write articles for the Chart Scan, many of you may recognize us from e-mails and phone calls over the past year as we have had the pleasure of working with students with orders, general questions and guidance. We wish everyone a very successful 2018 and beyond.
Denise Ross and Martha Ross-Edmunds
Check out our Blog!
To view previous published Chart Scan newsletters, please log in or click on "Join Us,"
shown above, to subscribe to our free "Members Only" section.
A WEALTH OF INFORMATION & EDUCATION:
Joe Ross-Trading Educators' popular free Chart Scan Newsletter has been published since 2004.
Note: Unless otherwise noted, all charts used in Chart Scan commentary were created
by using Genesis Financial Technologies' Trade Navigator (with permission).
Legal Notice and Copyright 2017 Disclaimer - Published by Trading Educators, Inc.
Chart Scan is a complimentary educational newsletter.
© by Trading Educators, Inc. Re-transmission or reproduction of any part of this material is strictly prohibited without prior written consent.
Edition 706 - December 22, 2017
Chart Scan with Commentary - The Importance of the Big Picture
by Master Trader Joe Ross
Author, Trader, Trading Mentor, and Founder of Trading Educators, Inc.
Developer of Instant Income Guaranteed
When prices on a daily chart remain contained, traders can become complacent, and vulnerable to emotional breakouts.
When prices trade in a range for an extended time, the market begins to depend on those prices. Traders make assumptions and plans about such markets, and tend to trade accordingly. Sometimes those plans can extend well into the future, in turn generating other plans contingent on a certain level of continuing price containment.
But what if prices break out of that range? Complacency gives way first to surprise, then to denial, sometimes to desperation. The latter can eventually induce panicky behavior, driving prices even further.
The chart below shows a currency spread (line chart overlay) long Soymeal (upper bar chart) and short Soy beans (lower bar chart). As you can see, each of the two markets is in a trading range, and so is the spread.

© by Joe Ross. Re-transmission or reproduction of any part of this material is strictly prohibited without the prior written consent of Trading Educators, Inc.
Trading Article - It Can Look Good in Hindsight
by Master Trader Joe Ross
Author, Trader, Trading Mentor, and Founder of Trading Educators, Inc.
Developer of Instant Income Guaranteed
The human mind is capable of extreme optimism. We have a strong need to win. This need can be so strong that everything looks rosy. For example, you may look backward at old charts and think, “It’s easy to see winning patterns.” Behavioral economists call this optimism, ‘hindsight bias.’ When we know how a stock price moved in the past, we think it all seemed inevitable when we look backward. For example, if you looked at a rise in stock price over the past few years, you may think in hindsight that it was inevitable. People have been positive about stocks.
Profits have been good, and of course, stock prices went up. You may have also seen the decline at times as being inevitable as well. If too many investors buy, prices were bound to go down a little eventually. The patterns all make sense in hindsight. The problem, however, is that people have difficulty seeing these patterns in foresight.
People are, indeed, too optimistic. Our thinking can be biased and self-serving. We can falsely believe that good quality setups are easy to spot, and we can convince ourselves that success is assured. But our expectations don’t always match reality.
The mind is prone to bias and unrealistic optimism. That’s why it is crucial to cultivate a healthy sense of skepticism. Skepticism isn’t the same thing as pessimism. A pessimist falsely distorts reality to the point that he or she believes that even a reasonable plan is doomed. A skeptic is optimistic yet is also realistic. No trading plan is foolproof. You may look back at old charts and see a foolproof way to make money. But history only repeats itself when it does (and sometimes it does not), and the mind can make it all look so obvious in hindsight. The markets don’t always cooperate with you. The winning trader is the person who questions a trading plan before executing it. He or she tries to anticipate what could go wrong, and thinks of ways to work around these potential setbacks. Being a healthy skeptic can be difficult at times, but the cautious optimist usually ends up making the most profits in the end.
© by Joe Ross. Re-transmission or reproduction of any part of this material is strictly prohibited without the prior written consent of Trading Educators, Inc.
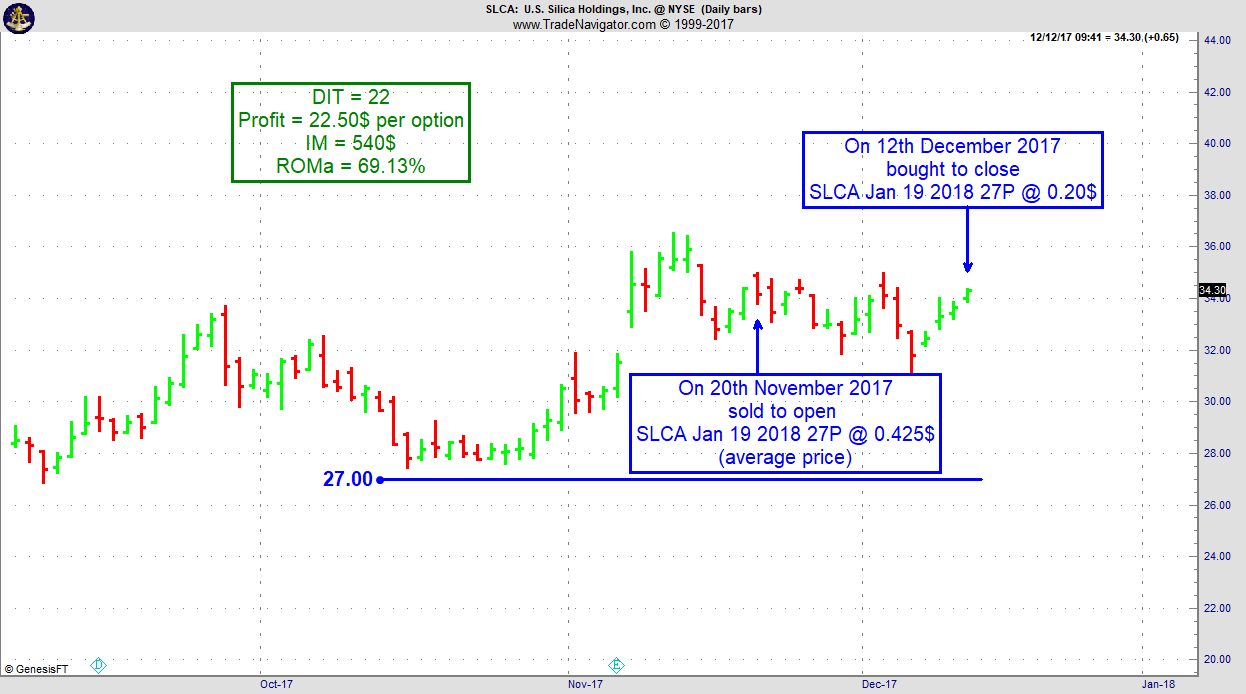
Instant Income Guaranteed - SLCA Trade
Philippe Gautier: Administration and New Developments
Developer: Joe Ross
On 19th November 2017 we gave our IIG subscribers the following trade on U.S. Silica Holdings Inc (SLCA). We sold price insurance as follows:
- On 20th November 2017, we sold to open SCLA Jan 19 2018 27P @ 0.425$ (average price), with 59 days until expiration and our short strike about 21% below price action.
- On 12th December 2017, we bought to close SLCA Jan 19 2018 27P @ 0.20$, after 22 days in the trade
Profit: 22.50$ per option
Margin: 540$
Return on Margin annualized: 69.13%
Philippe
Receive daily trade recommendations - we do the research for you!
♦ SIGN UP TODAY! THIS IS WORTH THE INVESTMENT ♦
© by Joe Ross and Philippe Gautier. Re-transmission or reproduction of any part of this material is strictly prohibited without the prior written consent of Trading Educators, Inc.
Blog Post: I just wiped out for the second time.
by Professional Trader Andy Jordan
Educator for Spreads, Options, Swing/Day Trading, and
Editor of Traders Notebook Complete and Traders Notebook Outrights
This week, Andy asks if he's some kind of trading freak. Read more.
© by Andy Jordan. Re-transmission or reproduction of any part of this material is strictly prohibited without the prior written consent of Trading Educators, Inc.
Trading Video: Presenting Ambush Signals
by Professional Trader Marco Mayer
Educator for Forex and Futures, Systematic Trader, and
Creator of Ambush Trading Method, Ambush Signals, and AlgoStrats.com
Learn all you need to know about our new Ambush Signals service during this presentation by Marco Mayer. What is the Ambush System, what's the idea behind it and how does Ambush Signals make trading Ambush so much easier!
Happy Trading!
Marco
Feel free to email Marco Mayer with any questions, This email address is being protected from spambots. You need JavaScript enabled to view it..
© by Marco Mayer. Re-transmission or reproduction of any part of this material is strictly prohibited without the prior written consent of Trading Educators, Inc.
Check out our Blog!
To view previous published Chart Scan newsletters, please log in or click on "Join Us,"
shown above, to subscribe to our free "Members Only" section.
A WEALTH OF INFORMATION & EDUCATION:
Joe Ross-Trading Educators' popular free Chart Scan Newsletter has been published since 2004.
Note: Unless otherwise noted, all charts used in Chart Scan commentary were created
by using Genesis Financial Technologies' Trade Navigator (with permission).
Legal Notice and Copyright 2017 Disclaimer - Published by Trading Educators, Inc.
Chart Scan is a complimentary educational newsletter.
© by Trading Educators, Inc. Re-transmission or reproduction of any part of this material is strictly prohibited without prior written consent.
Edition 705 - December 15, 2017
Chart Scan with Commentary - Is Crude Oil Putting in a Top?
by Master Trader Joe Ross
Author, Trader, Trading Mentor, and Founder of Trading Educators, Inc.
Developer of Instant Income Guaranteed
This is a question I am being asked quite often these days. The answer is that I honestly don't know. But from a purely technical analysis point of view, it is. On the daily chart, crude seems to be forming an m-shaped top. Some old-timers would even label it as a left shoulder and a head that could end up with a heads and shoulders top. The neckline seems to be right around 57.00. Of course, all of this is in the eye of the beholder.

What do we see on a daily chart basis via The Law of Charts? Prices are definitely still trending, making higher highs and higher lows. I've marked the /\/\ such as it is, so you can see it as well. So, from the point of view of chart analysis, we appear to have the probability of a top in crude oil, but in actuality prices are still trending.
Will the top form as a sideways price action known as distribution? Again, who knows? I don't even pretend to know. There are too many other factors involved. Crude oil is now a political football, as well as an economic enigma.
As far as the weekly chart is concerned, crude is still in an uptrend, having not broken any uptrend lines.
Can crude oil go much higher? Absolutely! Especially with the uneducated move the U.S. Congress is likely to make if they decide to regulate trading in crude oil.
I do not believe that this is a time to make any kind of definitive decision to short crude oil, but if you can't stand the suspense, maybe you could buy an at-the-money option straddle. Then if/when crude makes up its mind, you simply drop the losing side.
© by Joe Ross. Re-transmission or reproduction of any part of this material is strictly prohibited without the prior written consent of Trading Educators, Inc.
Trading Article - Living With Reality
by Master Trader Joe Ross
Author, Trader, Trading Mentor, and Founder of Trading Educators, Inc.
Developer of Instant Income Guaranteed
If you're like most traders, you expect to win. You put your time and energy into finding high probability setups, and after all the studying, searching, and theorizing, when you think you have come upon a good idea, you want it to work. Unfortunately, the markets don't always cooperate. You have to go where the markets take you. In the end the markets are always right. How do you react when things don't go your way? Do you feel upset? Are you angry? Do you want to get even?
When things don't go your way, it's very human and understandable to feel frustrated and angry. People experience anger when they feel that they have been unfairly wronged. It's easy to get angry while trading the markets. You expect to win. You were counting on winning. And when the markets don't cooperate, you feel a little hurt. Your ego is dinged and you are angry with someone: fate, yourself, imaginary institutional traders who are out to get you. The possibilities are endless. If you want to find someone to be angry with, you can find it, but it isn't very productive.
Anger can be a dangerous emotion when trading the markets. When you feel angry, you are ready to put up a fight. You have a powerful inclination to focus all of your energy and resources on fighting, seeking revenge, and looking for any sign of provocation. It's hard to think clearly when you are angry. Sound decision-making requires you to remain calm, focused, and flexible. There's no reason to be angry at the markets. Here's how you can be less angry at the markets.
First, don't personify the markets. Anger is an interpersonal emotion. We are usually angry with someone because we believe that he or she has purposely tried to harm us. The markets may consist of people making trades, but it doesn't make sense to make up imaginary relationships with the markets. There is nothing that is personal going on. You are merely making it personal, and taking setbacks personally, as if someone were out to wrong you. The people participating in the markets may engage in actions that thwart your goals, but their actions are not directed toward you personally. It is best to look at the markets as an abstract impersonal entity. Pretend you are playing a videogame. The more impersonal you can make trading, the better you will feel, and the more profits you'll realize.
Second, don't expect anything to go your way. Practice radical acceptance. Whatever happens, happens, and there is little you could have done to change things. (All you can do is limit your risk.) Anger is felt when our expectations have been shattered. One expects to profit from a trade, and when the profits are not realized, he or she may become angry, seek revenge, and want to get even. However, it isn't useful to have high expectations in the markets. Don't depend on the markets to fulfill your goals or meet your expectations. Assume that anything can happen. Indeed, in dealing with the markets, it's almost a given that you will lose money, so it is not useful to expect to make money on every trade. Just accept what you can get. Using this thinking strategy will make you feel calm.
The more you can stay calm while trading the markets, the more profitably you will be. Don't get frustrated, angry or upset. Take all setbacks in stride and enjoy the process of trading. You'll find you'll be calmer, focused, and more profitable.
© by Joe Ross. Re-transmission or reproduction of any part of this material is strictly prohibited without the prior written consent of Trading Educators, Inc.
Instant Income Guaranteed - CSX Trade
Philippe Gautier: Administration and New Developments
Developer: Joe Ross
On 26th November 2017 we gave our IIG subscribers the following trade on CSX Corporation (CSX). We sold price insurance as follows:
- On 27th November 2017, we sold to open CSX Jan 05 2018 46P @ 0.46$, with 38 days until expiration and our short strike about 8% below price action.
- On 29th November 2017, we bought to close CSX Jan 05 2018 46P @ 0.20$, after 2 days in the trade for quick premium compounding.
Profit: 26$ per option
Margin: 920$
Return on Margin annualized: 515.76%
Philippe

Receive daily trade recommendations - we do the research for you!
♦ SIGN UP TODAY! THIS IS WORTH THE INVESTMENT ♦
© by Joe Ross and Philippe Gautier. Re-transmission or reproduction of any part of this material is strictly prohibited without the prior written consent of Trading Educators, Inc.
Trading Idea: 1000*CLN18 – 420*HON18
by Professional Trader Andy Jordan
Educator for Spreads, Options, Swing/Day Trading, and
Editor of Traders Notebook Complete and Traders Notebook Outrights
This week, we're looking at 1000*CLN18 – 420*HON18: long July 2018 Crude Oil and short July 2018 Heating Oil (NYMEX on Globex).

Today we consider a Cotton calender spread: long July 2018 Crude Oil and short July 2018 Heating Oil (NYMEX on Globex). After being in a long down-trend, it looks like the spread might want to turn around to the up-side following its seasonal pattern. While the 15 year seasonal pattern shows an up-trend between October and January, the 5 year seasonal pattern shows the start of the seasonal up-move at the beginning of December. Energy spreads using two different markets (so called inter-market spreads) are usually very volatile and therefore need a wide stop. A risk of at least $1,500/spread seems to be appropriate for this spread. Please Note: because Crude Oil and Heating Oil have a different value per price tick we need to multiply the buy side by 1,000 and the sell side by 420 to plot the correct equity chart. The spread is 1:1.
Learn how we manage this trade and how to get detailed trading instructions every day!
Please visit the following link:
Yes, I want additional information!
© by Andy Jordan. Re-transmission or reproduction of any part of this material is strictly prohibited without the prior written consent of Trading Educators, Inc.
Trading Article: 5-Year T-Notes keep on trending in perfect Ambush Rhythm!
by Professional Trader Marco Mayer
Educator for Forex and Futures, Systematic Trader, and
Creator of Ambush Trading Method, Ambush Signals, and AlgoStrats.com
One of the best performing Ambush markets this year has been the 5-Year T-Notes Future (ZF). Actually its performance just hit new all-time-highs!
The interesting part here is that this market actually has been trending most of the time. While it’s been in an uptrend during the first part of the year, it’s now been trending lower in an almost perfect channel:

Now as you probably know, Ambush is a mean-reversion method so how is this possible? The answer is that Ambush is hitting that sweet spot of getting into trades usually towards the end of an up- or downswing in the markets and stays in only for a single day.
At the same time this market has been trending lower rather slowly. This creates a very nice environment for Ambush to trade in. Meaning ZF and Ambush are in perfect sync and having a really nice dance!
Here’s the trade details of all trades visible on the chart and as you can see ZF is quite a small contract you can trade nicely even with a small account:

Become an Ambush Trader today!
Simply sign up to Ambush Signals. It does all the work for you, allows you to customize what markets you want to see and has a position sizing tool implemented to automatically adjust the positions to your risk preferences.
Each day around 6:30 PM NY Time (yes, it's ready much earlier now than before) the Signals are available for you on the Dashboard. You can then place your orders and literally walk away until the markets close! Can you imagine a more comfortable way to day trade?
Ambush eBook
Now if you’d prefer to rather generate the signals on your own and want to know the exact trading rules of Ambush, you want to get the Ambush eBook. Here’s a hint: we’ve already significantly raised the price of eBook last year and probably we’ll do the same soon in 2018. So if you’re interested in buying the eBook, go for it now.
Happy Trading!
Marco
Feel free to email Marco Mayer with any questions, This email address is being protected from spambots. You need JavaScript enabled to view it..
© by Marco Mayer. Re-transmission or reproduction of any part of this material is strictly prohibited without the prior written consent of Trading Educators, Inc.
Check out our Blog!
To view previous published Chart Scan newsletters, please log in or click on "Join Us,"
shown above, to subscribe to our free "Members Only" section.
A WEALTH OF INFORMATION & EDUCATION:
Joe Ross-Trading Educators' popular free Chart Scan Newsletter has been published since 2004.
Note: Unless otherwise noted, all charts used in Chart Scan commentary were created
by using Genesis Financial Technologies' Trade Navigator (with permission).
Legal Notice and Copyright 2017 Disclaimer - Published by Trading Educators, Inc.
Chart Scan is a complimentary educational newsletter.
© by Trading Educators, Inc. Re-transmission or reproduction of any part of this material is strictly prohibited without prior written consent.
Edition 704 - December 8, 2017
Chart Scan with Commentary - Spread Trade
by Master Trader Joe Ross
Author, Trader, Trading Mentor, and Founder of Trading Educators, Inc.
Developer of Instant Income Guaranteed
I think many traders should take the time to learn a lot about spread trading. Sometimes I wonder why more people are not trading spreads. There are incredible advantages available for trading them: no stop running, low margins, most efficient use of your capital, more and steeper trends, seasonality, mathematical correlation — the list goes on and on.
I love the spread shown to me by my friend Angelo when we were together in October. Take a look!


Spread trading is quietly kept secret. Why? Because spread trading completely eliminates stop running. Do you think the insiders want you to know that? What would they do if they didn't have your stops to run?. Follow this link to find out more!
© by Joe Ross. Re-transmission or reproduction of any part of this material is strictly prohibited without the prior written consent of Trading Educators, Inc.
Trading Article - Trends
by Master Trader Joe Ross
Author, Trader, Trading Mentor, and Founder of Trading Educators, Inc.
Developer of Instant Income Guaranteed
IS IT TRUE THAT MARKETS TREND ONLY 15% OF THE TIME?
The statement that charts trend only 15% of the time is true only in the most general sense. There is almost always something trending somewhere, in some time frame. Trending means the market is moving from a definable top to a definable bottom, or from a bottom to a top. If traders cannot define the trend on one chart, they should look at another time period chart for the same stock or commodity, where the trend is more evident. You might even consider using tick charts, where each bar represents a certain number of ticks (or pips forex). There are many instances where a tick chart can be set to a number of ticks (pips) that will present a trending market in a market that presents as sideways using time charts. However, be aware that with tick charts you never know when you are going to get a new bar, and that the bars can suddenly change shape.
Believing markets trend only 15% of the time, popularly espoused by market technicians, is in one sense foolish. Long accumulation phases on daily charts, experienced by markets like sugar and silver, may not readily expose their trends until weekly and monthly charts are examined. Once the accumulation phase is identified, traders must wait for valid breakouts to occur before entry. The Latin roots to the word accumulate means to "add to the pile." A cumulus cloud is a pile of water vapor. There are three common congestion phases, and accumulation at the market bottom is one of them. The up move and down move have congestion phases as the market digests previous gains and losses, then usually continues the trend prior to the congestion. Congestion occurrence in the distribution phase, at a market top, is opposite the low range accumulation congestion phase. Congestion phases usually have low volatility and well defined five- to ten-day high and low price ranges, the opposite of the volatile distribution phase at market tops.
© by Joe Ross. Re-transmission or reproduction of any part of this material is strictly prohibited without the prior written consent of Trading Educators, Inc.
Instant Income Guaranteed - TIF Trade
Philippe Gautier: Administration and New Developments
Developer: Joe Ross
On 29th November 2017 we gave our Instant Income Guaranteed subscribers the following trade on Tiffany & Co (TIF). We sold price insurance as follows:
- On 30th November 2017, we sold to open TIF Jan 19 2018 82.5P @ 0.85$, with 49 days until expiration and our short strike about 11% below price action.
- On 1st December 2017, we bought to close TIF Jan 19 2018 82.5P @ 0.42$, after 1 day in the trade for quick premium compounding.
Profit: 43$ per option
Margin: 1650$
Return on Margin annualized: 951.21%
Philippe

Receive daily trade recommendations - we do the research for you!
♦ SIGN UP TODAY! THIS IS WORTH THE INVESTMENT ♦
© by Joe Ross and Philippe Gautier. Re-transmission or reproduction of any part of this material is strictly prohibited without the prior written consent of Trading Educators, Inc.
Trading Article: Is Seasonality the same in all Markets?
by Professional Trader Andy Jordan
Educator for Spreads, Options, Swing/Day Trading, and
Editor of Traders Notebook Complete and Traders Notebook Outrights
You can find seasonality in all markets but I personally think there is a big difference in “reliability” or “strength” of seasonality in the markets. I personally think seasonality is strongest in the commodity markets. In all markets where you have a physical product and a production cycle during the year. Because the production cycle is always the same you get typical seasonal behaviors in these markets. Other markets, like the indices, also show a seasonal pattern but I think it is not as strong as in the commodity markets. Anyway, seasonality is only one criterion besides others and I would never recommend any entry just based on statistics. You have to look at the current chart of the current spread to see what is going on. That’s what we have to trade!
© by Andy Jordan. Re-transmission or reproduction of any part of this material is strictly prohibited without the prior written consent of Trading Educators, Inc.
Trading Article - Who's next in line?
by Professional Trader Marco Mayer
Educator for Forex and Futures, Systematic Trader, and
Creator of Ambush Trading Method, Ambush Signals, and AlgoStrats.com
"Buy low, sell high" is one of the most popular memes in the investment and trading world. And obviously, it does make sense, who wouldn't like to buy low and sell high all the time? I found this to be quite a helpful advice to invest in stocks for example. Wait for a crash, buy it and sell again when prices are back to old highs.
Of course, the problem often is to figure out what's actually a low price and what's a high price. You can also buy high and sell higher to make a profit, which is how trend following works.
So what's the real deal here? I think the actual question to ask is "who's going to buy after me?" or "who's next in line?". Will there be enough traders willing to buy after you did at a higher price? Or if you're short the other way around, will there be sellers standing in line to sell after you did or not?
Think about it. To make a profit that's exactly what needs to happen. If you buy at $100, the only way to make a profit is if there are buyers willing to buy at higher prices. If they don't bid it up after you and you find someone to sell to at a higher price, you won't make a profit. Simple fact most traders are not really aware of.
Obviously, there's always someone who's gonna be the last in line. Someone is going to buy the high of the day/week/month/year/all-time. In poker, there's the popular saying that if you don't know who the patsy is in the round after 30 minutes, it's probably you. That same idea applies to trading. If you don't know why other traders are probably willing to buy at a higher price after you during the day, you might be the last one in the order book to bid at such a high price for today.
Because of that, it's always helpful to ask yourself "Who's gonna buy/sell after me and why?". If you can't answer that question it might be best to skip the trade!
Happy Trading!
Marco
Feel free to email Marco Mayer with any questions, This email address is being protected from spambots. You need JavaScript enabled to view it..
© by Marco Mayer. Re-transmission or reproduction of any part of this material is strictly prohibited without the prior written consent of Trading Educators, Inc.
Check out our Blog!
To view previous published Chart Scan newsletters, please log in or click on "Join Us,"
shown above, to subscribe to our free "Members Only" section.
A WEALTH OF INFORMATION & EDUCATION:
Joe Ross-Trading Educators' popular free Chart Scan Newsletter has been published since 2004.
Note: Unless otherwise noted, all charts used in Chart Scan commentary were created
by using Genesis Financial Technologies' Trade Navigator (with permission).
Legal Notice and Copyright 2017 Disclaimer - Published by Trading Educators, Inc.
Chart Scan is a complimentary educational newsletter.
© by Trading Educators, Inc. Re-transmission or reproduction of any part of this material is strictly prohibited without prior written consent.
Edition 703 - December 1, 2017
Chart Scan with Commentary - Copper
by Master Trader Joe Ross
Author, Trader, Trading Mentor, and Founder of Trading Educators, Inc.
Developer of Instant Income Guaranteed
This week we are going to see how to use the Law of Charts to stay out of a bad trade. Part and parcel with the Law of Charts is one of the implementations of the “Law” using the Traders Trick Entry (TTE).
I want to call your attention to the New York, Comex Copper futures. Look first at the blue arrow which points to Friday’s price bar. Notice that on Monday there is a TTE to go long 1 tick above Friday’s high for entry ahead of a violation of the Ross hook (RH), which is the high of the recent leg up.
The question I propose to you is this: Should you consider taking that TTE? In order to determine an answer, let’s look at a bit of history. Beginning from left to right using the red and purple arrows, let’s see how the TTE fared previously in this particular market.

There was a TTE to go long ahead of a Rh at “a”. Had you gotten long you didn’t get very far and may very well have been stopped out, as prices ended up at the low of the day. There was a TTE to go long at “b”. Following that trade there was a similar move against you with prices moving lower before rallying a bit at the close. The same thing happened at points “c.” and at “d” the TTE to go short ended up in disaster. The TTEs at “f” and “h” were not filled, but the TTEs at “e” and “g” turned out to be good trades. However, the TTE to go short at “e” is the only one that took prices out of the trading range.
An additional consideration is that there is very little room for making a profit between the high of the current TTE (blue arrow) and the point of the RH. What else can we know about trading in the copper market?
Daily volume has been falling and Friday’s volume was very weak. Weak volume indicates poor liquidity. It takes many buyers hitting the offer and many sellers hitting the bid to create a liquid market. Absent real liquidity, all you have is the chance for a few insiders to run the stops. That is what we saw on Friday and at the Traders Tricks were not so good.
What else do we know? Copper is a somewhat thinly traded and notoriously crooked market. If you don’t know about things like that, you have no business trading.
Avoid illiquid markets. Be sure to check volume. How much is it on average and is it steady day after day. And perhaps the greatest lesson of all should you happen to leap before you look--never, ever trade on hope or stay in a trade based on hope. If you are wrong, get out. If you don't have the discipline to do that, you shouldn't be trading.
Joe Ross has put together a special recorded online webinar: "The Traders Trick – Advanced Concepts." In it you will learn how to use the Traders Trick Entry (TTE) as one of your tools, very likely your greatest trading tool and setup. This webinar will last about 1 hour 52 minutes. Follow this link to find out more and watch it today!
© by Joe Ross. Re-transmission or reproduction of any part of this material is strictly prohibited without the prior written consent of Trading Educators, Inc.
Trading Article - Trading is a Business
by Master Trader Joe Ross
Author, Trader, Trading Mentor, and Founder of Trading Educators, Inc.
Developer of Instant Income Guaranteed
Is learning the trading business like learning any other business?
The importance of how you learn the business of trading cannot be minimized because of the factors that determine your success or failure. Learning the business of trading is basically no different from learning any other business. Winning means learning major guidelines and concepts that you repeat so often in your own behavior that they become good habits. These good habits then become automatic behavior patterns, which are formed as brain pathways by the rewards you get for trading well and the punishment you receive from trading poorly. When you associate yourself with other traders, try to associate with those who are building their personal net worth, not just talking about it. True success is silent. Try not to do something just because everyone else is doing it. Successful traders are rare. If the crowd is doing it, watch out!
If you'd like to turn all your hours of effort in studying the markets into profitable trading, to rid yourself of the mental gridlock that often plagues traders, and to truly become an intuitive trader, then you'll want to read this very important book to make money trading - Trading Is a Business.
© by Joe Ross. Re-transmission or reproduction of any part of this material is strictly prohibited without the prior written consent of Trading Educators, Inc.
Instant Income Guaranteed - MEOH Trade
Philippe Gautier: Administration and New Developments
Developer: Joe Ross
On 7th November 2017 we gave our Instant Income Guaranteed subscribers the following trade on Methanex Corporation (MEOH). We sold price insurance as follows:
- On 7th November 2017, we sold to open MEOH Dec 15 2017 45P @ 0.45$, with 38 days until expiration and our short strike about 12% below price action.
- On 22d November 2017, we bought to close MEOH Dec 15 2017 45P @ 0.20$, after 15 days in the trade for quick premium compounding.
Profit: 25$ per option
Margin: 900$
Return on Margin annualized: 67.59%
Philippe

Receive daily trade recommendations - we do the research for you!
♦ SIGN UP TODAY! THIS IS WORTH THE INVESTMENT ♦
© by Joe Ross and Philippe Gautier. Re-transmission or reproduction of any part of this material is strictly prohibited without the prior written consent of Trading Educators, Inc.
Trading Idea: CLN18 – HON18
by Professional Trader Andy Jordan
Educator for Spreads, Options, Swing/Day Trading, and
Editor of Traders Notebook Complete and Traders Notebook Outrights
This week, we're looking at CLN18 – HON18: long July 2018 Crude Oil and short July 2018 Heating Oil (NYMEX on Globex).

Today we consider an inter-market spread in the energies: long July 2018 Crude Oil and short July 2018 Heating Oil. The spread has been in a down-trend for several months but seems to slow down. As we can see on the seasonal chart the July Crude Oil usually outperforms the July Heating Oil during the time between 12/06 and 01/18. Because we are spreading between two different markets the spread requires high margin and high risk of about $1,000 to $1,500.
Learn how we manage this trade and how to get detailed trading instructions every day!
Please visit the following link:
Yes, I want additional information!
© by Andy Jordan. Re-transmission or reproduction of any part of this material is strictly prohibited without the prior written consent of Trading Educators, Inc.
Trading Article - Day Trading Market News
by Professional Trader Marco Mayer
Educator for Forex and Futures, Systematic Trader, and
Creator of Ambush Trading Method, Ambush Signals, and AlgoStrats.com
What to do around news events or when the market starts to move strongly caused by some news that just hit the market? I’m sure this is one of the most common questions traders ask themselves every day. At least I do!
If you’re new to trading and actually take this as a serious business, not just another place to gamble here’s my answer: Don’t trade shortly before or after news releases and come back when the market is back to normal. The odds of getting into trouble are much higher than making a profit if you don’t know what you’re doing.
On the other side if you’re an experienced trader you might have recognized that it’s not all black and white when it comes to trading news. Yes, volatility can get crazy, liquidity can be worse than usual and often you’ll just get stopped out of trades before the market takes off. But often this is also the time when the market does make major moves and to survive as traders it’s helpful if you can capture some of these. That’s especially true in news driven markets like the currency markets.
What I like to do when the setup is right is to fade the initial market move at price levels where I consider the market too stretched to move through. Here’s what I watch out for:
- Get into trades only with limit orders, the odds of getting negative slippage are too high using market orders. Using limit orders chances aren’t bad you’ll get positive slippage on a regular basis.
- Cancel any orders that are close to where the market is trading before the news. Odds are they’ll get filled simply due to the volatility in the market.
- Fade the move at support/resistance points where the market might be too stretched to move through on the first attempt. Moving to a lower timeframe to look for reversal patterns can be helpful if you don’t like blindly fading a strong move.
- Use small stops and multiple R targets. This will only work if you capture > 3R winners on a regular basis. Many of these trades will not work out and often you’ll have to take a full loss.
- To achieve this, don’t scale out. You don’t want to hit that 5R profit target with only 1/3 of your position on! Instead, trail your stop and tail it tighter the more parabolic the move gets.
- Have a far-off profit target in place in case the market goes crazy enough to make it there.
Here’s an example from this Monday of such a trade in GBP/USD. It’s a very nice example and most trades don’t turn out that nicely but showing a losing trade that just stopped me out would be boring right? I had planned to buy around 1.3290 but as the news hit the board I canceled the order. But just in case the market would go there I put in a new entry order at a much lower price (see chart). I got filled there when the pound really was sold off and about 2 hours later the market unexpectedly hit my profit target. While the pound was moving higher I kept on moving up my stop but luckily didn’t get stopped out before the target was hit.

Happy Trading!
Marco
Feel free to email Marco Mayer with any questions, This email address is being protected from spambots. You need JavaScript enabled to view it..
© by Marco Mayer. Re-transmission or reproduction of any part of this material is strictly prohibited without the prior written consent of Trading Educators, Inc.
Check out our Blog!
To view previous published Chart Scan newsletters, please log in or click on "Join Us,"
shown above, to subscribe to our free "Members Only" section.
A WEALTH OF INFORMATION & EDUCATION:
Joe Ross-Trading Educators' popular free Chart Scan Newsletter has been published since 2004.
Note: Unless otherwise noted, all charts used in Chart Scan commentary were created
by using Genesis Financial Technologies' Trade Navigator (with permission).
Legal Notice and Copyright 2017 Disclaimer - Published by Trading Educators, Inc.
Chart Scan is a complimentary educational newsletter.
© by Trading Educators, Inc. Re-transmission or reproduction of any part of this material is strictly prohibited without prior written consent.
More...
Edition 702 - November 24, 2017
We hope you had a wonderful Thanksgiving
celebration with your family and friends!
ENDS SOON!
30% Off All Products and Services
Coupon Code
stuffed30
Use during checkout expires midnight U.S. Central time on November 26, 2017
Chart Scan with Commentary - Consolidation Part 8
by Master Trader Joe Ross
Author, Trader, Trading Mentor, and Founder of Trading Educators, Inc.
Developer of Instant Income Guaranteed
We have been taking this series one step at a time. I have drawn the trading envelope at the earliest possible time — the time I was first able to identify congestion (11-20 bars). Prices had entered the upper trading zone between the congestion high and the .146 inner zone (dash-dot green line). The entry was on the 8th bar from the left including the measuring bar.
Once prices entered that zone, I was looking to go short 1 tick below the inner zone line. Assuming I was trading 10 contracts, and because I could afford it, I placed my initial stop loss 1 tick above the congestion high. My objective was to liquidate 7 contracts at the midpoint line (red line). If prices would reach the midpoint line, I would move the protective stop on 1 contract to break even and the protective stop on 2 contracts to protect 50% of my profits. As you can see from the chart, I was filled as prices exited the inner zone. Two bars later I was filled at the midpoint line. On the last bar on the chart you can see that my 50% stop was hit.
Because the bar that hit my 50% stop was a reversal bar, I moved my breakeven stop to 1 tick above the high of the last bar on the chart. The following day (not shown) I was stopped out there. I was paid to trade on all parts of my position. That’s all I ever ask of a market.

© by Joe Ross. Re-transmission or reproduction of any part of this material is strictly prohibited without the prior written consent of Trading Educators, Inc.
ENDS SOON!
30% Off All Products and Services
Coupon Code
stuffed30
Use during checkout expires midnight U.S. Central time on November 26, 2017
Trading Article - Fitting it all together Part 4 - Market Spillover
by Master Trader Joe Ross
Author, Trader, Trading Mentor, and Founder of Trading Educators, Inc.
Developer of Instant Income Guaranteed
Markets can and do spillover from one to the other. We saw this back in 2007, and we can now see how dangerously close we were then and are now to a melt-down.
Until early in 2007, I had never heard of US subprime lending. On hearing the detail, it left me with a sense of wonderment.
“You mean, the borrower lies about his income (no job, no income, no hope) and the lender offers exceptionally low 'teaser' interest rates, with the proviso of these going up by half (!) within two years, and nobody screamed?”
And then they took such loans, bundled them with better loans, sliced and spliced the end result like so much rope, got rating agencies to apply the last rites, and sold them on to unsuspecting institutions looking for yield enhancement (a little extra margin, magnified sixteen times by leveraging, so that anything small really started to look impressively large)!
And that house of cards was supposed to remain intact?
If you had never tasted snake-oil before, this was your golden opportunity. About a $1 trillion of the stuff was written, first Fed estimates were that $100bn would go bad, but add the misadventure of any misguided leveraging, and the final bill would be about $250bn.
That would have sunk the US banking system. But because banks securitized and offloaded the stuff faster than they generated it, relatively little stuck to banks, except to the extent that their asset management funds invested in such stuff.
Anyway, the $250bn was spread around the world, at least 10% in Japan, a goodly portion in Europe and a fair amount in lower Manhattan. The losses would rest where they fell. Rest in peace.
Meanwhile, financial markets in their entirety couldn't quite figure where all the bodies were buried. A few hedge funds owed up (and folded). A few banks wrote off early and got mostly ignored. A few latecomers owed up and got clobbered. But by then the greater universe was on a witch hunt, while pulling away from leveraged corporate debt as well.
Banks became wary of counterparty banks. “Are you still good?
A rush for Treasury bonds ensued, sinking such bond yields. A flight to safety was in progress.
On 10 August it got so bad that European money market rates no longer reflected central bank targeted rates. Trust was out of the window and the willingness to deal getting thin indeed. Liquidity was drying up. The ECB, faced with banks being unable to get funds, injected $130bn, followed shortly by Fed and BoJ.
Another week and US credit markets generally seized up, with heavy spillover into equity markets, as uncertainty bit and induced risk aversion, good assets were sold to cover bad credit losses, and basically everyone lost their nerve.
Even Japanese housewives reversed positions, dumping Aussie and Kiwi and causing the Japanese Yen to shoot through the roof as the carry-trade got liquidated.
Not a moment too soon the Fed finally capitulated, but not in the usual way. The unusual twist was to lower only the discount rate by 0.5%, halving the penalty the banks pay to go into the central bank to cover their liquidity needs.
Would it be enough? If liquidity didn't improve, with massive volatility marking most markets as investors tried to re-establish value where anarchy ruled, the Fed at some point had to capitulate for real and go the whole hog, even lowering fed funds rate once, twice or even three times by 0.25%.
It proved to be an interesting year. Instead of being floored by bird flu, or getting fallout from US nuking of Iranian nuclear facilities, the world got old-fashioned credit failure, coupled to stress-testing leveraged universes.
Are we due for another such cleansing?
© by Joe Ross. Re-transmission or reproduction of any part of this material is strictly prohibited without the prior written consent of Trading Educators, Inc.
ENDS SOON!
30% Off All Products and Services
Coupon Code
stuffed30
Use during checkout expires midnight U.S. Central time on November 26, 2017
Instant Income Guaranteed - GDXJ Trade
Philippe Gautier: Administration and New Developments
Developer: Joe Ross
On 25th September 2017 we gave our Instant Income Guaranteed subscribers the following trade on Market Vectors Junior Gold Min (GDXJ). We sold price insurance as follows:
- On 26th September 2017, we sold to open GDXJ Nov 17 2017 30P @ 0.27$, with 51 days until expiration and our short strike about 14% below price action.
- On 9th October 2017, we bought to close GDXJ Nov 17 2017 30P @ 0.10$, after 13 days in the trade for quick premium compounding.
Profit: 17$ per option
Margin: 600$
Return on Margin annualized: 79.55%
Philippe

Receive daily trade recommendations - we do the research for you!
♦ SIGN UP TODAY! THIS IS WORTH THE INVESTMENT ♦
© by Joe Ross and Philippe Gautier. Re-transmission or reproduction of any part of this material is strictly prohibited without the prior written consent of Trading Educators, Inc.
ENDS SOON!
30% Off All Products and Services
Coupon Code
stuffed30
Use during checkout expires midnight U.S. Central time on November 26, 2017
Trading Article - Time Stop
by Professional Trader Andy Jordan
Educator for Spreads, Options, Swing/Day Trading, and
Editor of Traders Notebook Complete and Traders Notebook Outrights
If it was easy to win at trading, there would be more millionaires. The techniques for trading are simple. The age-old question is how to balance patience, wisdom, and prudent care against going for the grand slam.
In trading, pulling the trigger on when to trade equally important as all the preparation and attention to detail that went before. In other words, timing is everything when it comes to entering the trade. If a trade does not do well at the start, the trader must be disciplined and have ready a variety of alternate courses of action. As long as the circumstances for making the trade are still in effect, the trader can stay with the position. However, I believe in using a time stop. A time stop says, “I will exit the trade within a set amount of time even if the circumstances for making it are still in effect.” In the way I trade, success depends on prices quickly moving my way. If they fail to move my way, I know that my timing was off and I exit. Sometimes I have made a little and sometimes I lose a little. Overall, I do a little less than break even on the trades that time out. If circumstances are still the same, I look for a better time to get into the trade. My point is this: If my timing was off, I was wrong. When I’m wrong, I get out.
© by Andy Jordan. Re-transmission or reproduction of any part of this material is strictly prohibited without the prior written consent of Trading Educators, Inc.
ENDS SOON!
30% Off All Products and Services
Coupon Code
stuffed30
Use during checkout expires midnight U.S. Central time on November 26, 2017
Trading Video - Trend Following Is Not Yet Dead: Part I
by Professional Trader Marco Mayer
Educator for Forex and Futures, Systematic Trader, and
Creator of Ambush Trading Method, Ambush Signals, and AlgoStrats.com
In this video, Marco gives you some insights on his journey into the world of traditional trend following. He talks about how trend following works, what to consider, and if it's a trading style for the average trader to consider. This is Part 1 of a 2-Part series. In his Part II, Marco will go into the details of his backtests.
Feel free to email Marco Mayer with any questions, This email address is being protected from spambots. You need JavaScript enabled to view it..
© by Marco Mayer. Re-transmission or reproduction of any part of this material is strictly prohibited without the prior written consent of Trading Educators, Inc.
ENDS SOON!
30% Off All Products and Services
Coupon Code
stuffed30
Use during checkout expires midnight U.S. Central time on November 26, 2017
Check out our Blog!
To view previous published Chart Scan newsletters, please log in or click on "Join Us,"
shown above, to subscribe to our free "Members Only" section.
A WEALTH OF INFORMATION & EDUCATION:
Joe Ross-Trading Educators' popular free Chart Scan Newsletter has been published since 2004.
Note: Unless otherwise noted, all charts used in Chart Scan commentary were created
by using Genesis Financial Technologies' Trade Navigator (with permission).
Legal Notice and Copyright 2017 Disclaimer - Published by Trading Educators, Inc.
Chart Scan is a complimentary educational newsletter.
© by Trading Educators, Inc. Re-transmission or reproduction of any part of this material is strictly prohibited without prior written consent.
Edition 701 - November 17, 2017
30% Off All Products and Services!
Coupon Code
stuffed30
Use during checkout expires midnight U.S. Central time on November 26, 2017
Chart Scan with Commentary - Consolidation Part 7
by Master Trader Joe Ross
Author, Trader, Trading Mentor, and Founder of Trading Educators, Inc.
Developer of Instant Income Guaranteed
Last week we completed the construction of a trading envelope in the 30-year Treasury Bond. The next step is to go back to find out the earliest time we could have constructed the envelope.
I submit that it must be once prices are seen to be in congestion (11-20 bars).
Looking at the chart we see that congestion could actually be defined as 10 bars, all having either Opens or Closes within the trading range of a single measuring bar, comprising a total of 11 bars. That, then, is the earliest point in time at which an envelope could have been constructed.

© by Joe Ross. Re-transmission or reproduction of any part of this material is strictly prohibited without the prior written consent of Trading Educators, Inc.
30% Off All Products and Services!
Coupon Code
stuffed30
Use during checkout expires midnight U.S. Central time on November 26, 2017
Trading Article - Fitting it all together Part 3
by Master Trader Joe Ross
Author, Trader, Trading Mentor, and Founder of Trading Educators, Inc.
Developer of Instant Income Guaranteed
When a trend begins, always question its durability.
Traders who are in the market for the greater wins are wise to incorporate, when possible, seasonal factors, fundamental factors, technical analysis, and chart analysis. Among those who do, some start with seasonal research and then draw on fundamental knowledge or technical and chart reading expertise to help measure risk and confirm or deny potential reward. Others start instead from a fundamental or technical perspective, and then analyze the seasonal path of least resistance. It’s also important to realize that seasonality is not always on time; seasonal factors can come early or late. The same thing is true of cycle turning points, they, too, can come early or late.
In this issue of Chart Scan, let’s think for a moment about the effects of interest rates. If the Federal Reserve is concerned that a heated economy is stimulating inflationary pressure, the FED will launch a series of rate increases designed to slow growth. The strategy may have its intended effect. But once the strategy begins, you can expect a series of rate increases. However, it would be insane to increase rates when the economy is deflationary. Increasing rates will only make things worse.
When a cooling economy eases pressure on interest rates, financial instruments typically rally. Therefore, a fundamental outlook may encourage tentative long positions in interest rate futures. A trader who first refers to seasonal research before making final trading decisions finds that interest rates tend to peak in April/May, and generally decline into the fourth quarter. What we have observed over the years is that futures all along the yield curve tend to begin trending higher in May/June, which impacts the September Treasury Bonds and moves them higher.
Because big money is most concerned with long-term survival and advantage, trends in interest rates are usually confirmed by two spread characteristics: instruments at the long end of the yield curve outperform the short end, and deferred contracts outperform nearby contracts. A tentatively bullish fundamental trader who considers spreads to be a low-risk alternative to an outright position might find opportunity in certain seasonal spreads. One that you might want to think about for the future is Long June of the following year and Short September of the current year in Eurodollars. There may still time to consider this spread, depending upon when you receive this issue of Chart Scan. You might also consider Long June two years ahead, and short September of next year.
© by Joe Ross. Re-transmission or reproduction of any part of this material is strictly prohibited without the prior written consent of Trading Educators, Inc.
30% Off All Products and Services!
Coupon Code
stuffed30
Use during checkout expires midnight U.S. Central time on November 26, 2017
Instant Income Guaranteed - SLCA Trade
Philippe Gautier: Administration and New Developments
Developer: Joe Ross
On 7th November 2017 we gave our Instant Income Guaranteed subscribers the following trade on U.S. Silica Holdings Inc. (SLCA). We sold price insurance as follows:
- On 8th November 2017, we sold to open SLCA Dec 15 2017 27P @ 0.25$, with 37 days until expiration and our short strike about 22% below price action.
- On 9th November 2017, we bought to close SLCA Dec 15 2017 27P @ 0.10$, after only 1 day in the trade for quick premium compounding.
Profit: 15$ per option
Margin: 540$
Return on Margin annualized: 1,013.89%
Return on Principal annualized: 202.78%
Philippe

Receive daily trade recommendations - we do the research for you!
♦ SIGN UP TODAY! THIS IS WORTH THE INVESTMENT ♦
© by Joe Ross and Philippe Gautier. Re-transmission or reproduction of any part of this material is strictly prohibited without the prior written consent of Trading Educators, Inc.
30% Off All Products and Services!
Coupon Code
stuffed30
Use during checkout expires midnight U.S. Central time on November 26, 2017
Trading Blog Post - Being in a Positive State of Mind
by Professional Trader Andy Jordan
Educator for Spreads, Options, Swing/Day Trading, and
Editor of Traders Notebook Complete and Traders Notebook Outrights
Find out which mood is the best choice when trading. Read more.
© by Andy Jordan. Re-transmission or reproduction of any part of this material is strictly prohibited without the prior written consent of Trading Educators, Inc.
30% Off All Products and Services!
Coupon Code
stuffed30
Use during checkout expires midnight U.S. Central time on November 26, 2017
Trading Article - Trade Managemnt: Locking in Windfall Profits
by Professional Trader Marco Mayer
Educator for Forex and Futures, Systematic Trader, and
Creator of Ambush Trading Method, Ambush Signals, and AlgoStrats.com
I have another real-world example of manual trade management for you this week.
It’s a day trade in GBP/USD I found myself in a couple of days ago. The GBP has been a really nice market to trade lately providing plenty of swings and volatility.
The plan was to get in at a price level where I expected buyers to come into the market around 1.3070, using a relatively tight stop of 20 pips. I had no clear profit target for the trade but wasn’t expecting more than a decent bounce. I also was aware that the market might run into trouble around 1.3120 so I knew I had to watch closer should it approach that level.
Here’s what happened. I got my fill at 1.3070 and shortly after the pound showed me that I wasn’t completely wrong with my idea. Once prices had moved to 1) (see chart) I moved the stop below the lowest low since I got in to 1.3060 to reduce the risk by 50%.
At 2) I was up quite nicely already and moved my stop just slightly below the entry price at to 1.3068. After that prices consolidated between 1.3080 and 90 for a while. Until at 3) prices started to move and exploded about 40 pips within minutes to the upside. This I hadn’t expected, probably some news hit the market.
Now 40 pips isn’t a totally crazy move but I had expected this to take hours so this has been a windfall profit at that point. What to do now? I’ve been up about 60 pips with an initial risk of 20 pips. That’s more than I had been looking for so I could have simply closed out the trade and take the profit. But as the pound was exploding in a parabolic way without any corrections why not just trail the stop really tight and see how far it goes?
That’s exactly what I did at 4) and so I got stopped out at about 1.3120 with a nice profit of 50 pips.
So one way to deal with windfall profits is to not get greedy and start locking them in more and more tight. The more parabolic the move gets, the more aggressive you might want to move your stop. Especially in the currency markets these moves don’t tend to carry on for too long.
Happy Trading!
Marco
Feel free to email Marco Mayer with any questions, This email address is being protected from spambots. You need JavaScript enabled to view it..
© by Marco Mayer. Re-transmission or reproduction of any part of this material is strictly prohibited without the prior written consent of Trading Educators, Inc.
30% Off All Products and Services!
Coupon Code
stuffed30
Use during checkout expires midnight U.S. Central time on November 26, 2017
Check out our Blog!
To view previous published Chart Scan newsletters, please log in or click on "Join Us,"
shown above, to subscribe to our free "Members Only" section.
A WEALTH OF INFORMATION & EDUCATION:
Joe Ross-Trading Educators' popular free Chart Scan Newsletter has been published since 2004.
Note: Unless otherwise noted, all charts used in Chart Scan commentary were created
by using Genesis Financial Technologies' Trade Navigator (with permission).
Legal Notice and Copyright 2017 Disclaimer - Published by Trading Educators, Inc.
Chart Scan is a complimentary educational newsletter.
© by Trading Educators, Inc. Re-transmission or reproduction of any part of this material is strictly prohibited without prior written consent.
Edition 700 - November 10, 2017
Chart Scan with Commentary - Consolidation Part 6
by Master Trader Joe Ross
Author, Trader, Trading Mentor, and Founder of Trading Educators, Inc.
Developer of Instant Income Guaranteed
Last week I wrote that there were two ratios we would use to compute envelope lines. The second ratio is .146.
We previously discovered the height of the consolidation as being 3^22. We will now go through a similar procedure to we did last week, using the .146 ratio.
3^22 = 3*32+22 = 118
.146*118 = 17.228 = decimal height of the consolidation.
The high of the consolidation was 108^06.
Converting 108^06 to decimal:
108*32+6 = 3462
Next we add the ratio of .146 of the height to the high of the consolidation, but this time we take a second step as well. We will subtract the ratio of .146 of the height from the consolidation. This will give us two lines: one between the high of the consolidation and the upper envelope line called the “upper mid-out line,” and one between the upper envelope line and the lower envelope line, called the “upper mid-in line.”
3462+17.228 = 3479.228
Converting back to 32nds:
3479.228/32 = 108.725875
.725875*32 = 7 (rounded)
108^23 = upper mid-out line.
3462-17.228 = 3444.772
Converting back to 32nds:
3444.772/32 = 107.649125
.649125*32 = 21 (rounded)
107^21= upper mid-in line.
The lower mid-in line and the lower mid-out lines are computed as follows:
The low of the consolidation: 104^16.
Converting 104^16 to decimal:
104X32+16 = 3344
3344+17.228 = 3361.228
3361.228/32 = 105.038375
.038375*32 = 1 (rounded)
105^1 = lower mid-in line.
3344-17.228 = 3327.772
3327.772/32 = 103.992875 (rounded)
.9982875*32 = 32/32 = 1
To be continued...
© by Joe Ross. Re-transmission or reproduction of any part of this material is strictly prohibited without the prior written consent of Trading Educators, Inc.
Trading Article - Fitting it all together Part 2 (Economics 101 in a nutshell)
by Master Trader Joe Ross
Author, Trader, Trading Mentor, and Founder of Trading Educators, Inc.
Developer of Instant Income Guaranteed
We heard from a lot of you that you would like me to continue describing how markets are related. I will intersperse these kinds of tidbits with others. However, since so many asked, today's tidbit is along the lines of how markets relate to fundamentals.
After a breakout, look for a return. Successful returns can beget generous returns.
When a market does finally overcome resistance, penetrate a psychological barrier, or break out of a formation or consolidation, it tends to do so boldly at first. But after its initial thrust, it often needs reassurance. To reconfirm its freedom, it may even return to the very area from which it just broke its constraints.
When traders on the wrong side exit and new participants eagerly enter in the direction of the breakout, the return to retest succeeds in reenergizing, reinforcing, and resuming the new trend.
Futures traders must always expect the unexpected when least expected. Would you, for example, expect prices to be pressured by a surge in supply before a decline in consumption?
Let's look at some relationships in the soybean market.
Brazil harvests soybeans from February through May, during which crushing facilities run at capacity. Flush with new supplies for sale (most soybean oil is consumed domestically), the world's second largest exporter of soybean meal competes aggressively in the world market.
But soybean meal is a high-protein feed supplement for livestock. World consumption is greatest by far during the Northern Hemisphere's cold winter weather, when high caloric intake is required for animals to maintain and gain weight. Conversely, world consumption is lowest during July and August, when grass is available and the weather is hot.
So you might expect soybean meal prices to be especially weak during June, just after Brazil's harvest and just before the heat of the northern summer. But that is not so! Soybean meal has instead been the leader in the grains and soy complex.
Why is that the case? A seasonal transition appears to occur during June. As the surge in South American supplies begins to recede, the market turns back towards old-crop US supplies — perhaps stimulating some change in commercial ownership. U.S. soybean processors, who may have hedged soybean meal during Brazil's harvest in order to protect product prices and profit margins, may now begin covering short positions. Conversely, with low July/August consumption already discounted, the market begins to anticipate a rise in Northern Hemisphere demand — perhaps generating commercial buying.
Although product value within the soy complex has generally begun to favor soybean meal over soybean oil from as early as March, this sudden surge in soybean meal has been especially reflected in spreads between the two right around the middle of June. You might want to mark that on your trading calendar; it has been a high percentage spread trade for many years.
This strength in old-crop soybean meal is also reflected in spreads against new-crop soybean meal. As world demand returns to U.S. supplies, a new crop of soybeans is emerging to offer potentially plentiful new supplies late in the year. So, usually, the old-crop outperforms new-crop, often throughout the rest of the marketing year.
© by Joe Ross. Re-transmission or reproduction of any part of this material is strictly prohibited without the prior written consent of Trading Educators, Inc.
Instant Income Guaranteed - KR Trade
Philippe Gautier: Administration and New Developments
Developer: Joe Ross
On 29th October 2017 we gave our Instant Income Guaranteed subscribers the following trade on Kroger Company (KR). We sold price insurance as follows:
- On 30th October 2017, we sold to open KR Dec 01 2017 18P @ 0.20$, with 31 days until expiration and our short strike about 12% below price action.
- On 2nd November 2017, we bought to close KR Dec 01 2017 18P @ 0.10$, after only 3 days in the trade for quick premium compounding.
Profit: 10$ per option
Margin: 360$
Return on Margin annualized: 337.96%
We have also added new types of trades for our IIG daily guidance since 2016, "no loss" propositions with unlimited upside potential, still using other people's money to trade.
Philippe

Receive daily trade recommendations - we do the research for you!
♦ SIGN UP TODAY! THIS IS WORTH THE INVESTMENT ♦
© by Joe Ross and Philippe Gautier. Re-transmission or reproduction of any part of this material is strictly prohibited without the prior written consent of Trading Educators, Inc.
Trading Idea - Crude Light Calandar Spread
by Professional Trader Andy Jordan
Educator for Spreads, Options, Swing/Day Trading, and
Editor of Traders Notebook Complete and Traders Notebook Outrights
This week, we're looking at CLG18 – CLF18: long February 2018 and January 2018 Crude Oil (NYMEX on Globex).
Today we consider a Crude Light calendar spread: long February 2018 and January 2018 Crude Oil (symbols on CQG for the January – February spread is CLES1F8). The spread has found support around 0.070 several times during the last few months. At the same level, the spread has run into resistance during the first few months of 2017. As long as the spread stays above break even, there is a good chance the spread will follow it seasonal tendency to the up-side for the next few weeks.
Do you want to see how we manage this trade and how to get detailed trading instructions every day?
Traders Notebook Complete
Please visit the following link:
Yes, I would like additional information!
© by Andy Jordan. Re-transmission or reproduction of any part of this material is strictly prohibited without the prior written consent of Trading Educators, Inc.
Trading Video - Questions and Answers
by Professional Trader Marco Mayer
Educator for Forex and Futures, Systematic Trader, and
Creator of Ambush Trading Method, Ambush Signals, and AlgoStrats.com
This is the first part of a series in which Marco answered oft asked trading questions. This episode includes bid/ask spread and discipline in trading
>
© by Marco Mayer. Re-transmission or reproduction of any part of this material is strictly prohibited without the prior written consent of Trading Educators, Inc.
Check out our Blog!
To view previous published Chart Scan newsletters, please log in or click on "Join Us,"
shown above, to subscribe to our free "Members Only" section.
A WEALTH OF INFORMATION & EDUCATION:
Joe Ross-Trading Educators' popular free Chart Scan Newsletter has been published since 2004.
Note: Unless otherwise noted, all charts used in Chart Scan commentary were created
by using Genesis Financial Technologies' Trade Navigator (with permission).
Legal Notice and Copyright 2017 Disclaimer - Published by Trading Educators, Inc.
Chart Scan is a complimentary educational newsletter.
© by Trading Educators, Inc. Re-transmission or reproduction of any part of this material is strictly prohibited without prior written consent.
Edition 699 - November 3, 2017
Chart Scan with Commentary - Consolidation Part 5
by Master Trader Joe Ross
Author, Trader, Trading Mentor, and Founder of Trading Educators, Inc.
Developer of Instant Income Guaranteed
Continuing with the bond illustration to this point, the next step is to compute a couple of very interesting ratios. These ratios are ones I came across long before I ever heard of Gann or Fibonacci. If they turn out to be the same as the ratios of either of them, so be it. I know that I discovered them on my own, and have used them for many decades. They work amazingly well when trading inside consolidation. The ratios are used to create an envelope. The first ratio will be used to compute both upper and lower envelope values.
Last week we discovered that the height of the consolidation was 3^22. We must now take a ratio from the value of the height. The ratio is .236. To compute the ratio we will convert the height from 32nds to decimal.
3^22 = 3*32+22 = 118
.236*118 = 27.848
The high of the consolidation was 108^06.
Converting 108^06 to decimal:
108*32+6 = 3462
Next we add the ratio of .236 to the high of the consolidation to obtain a value for the upper envelope line:
3462+27.848 = 3489.848
Converting that back to 32nds:
3489.848/32 = 109.05774
.05774*32 = 2 (rounded)
The upper envelope line is placed at 109^2
We now have to obtain a value for the lower envelope.
The low of the consolidation was 104^16.
104*32+16 = 3344
Next we subtract the ratio of .236 from the low of the consolidation to obtain a value for the lower envelope line:
3344-27.848 = 3316.152
Converting back to 32nds:
3316.152/32 = 103.62975
.62975*32 = 20 (rounded)
The lower envelope line is placed at 103^20
Next week we will compute another ratio and add it to and subtract from both the high and the low of the consolidation.
At this point our chart looked like this:

To be continued...
© by Joe Ross. Re-transmission or reproduction of any part of this material is strictly prohibited without the prior written consent of Trading Educators, Inc.
Trading Article - Fitting it all together Part 1 (Economics 101 in a nutshell)
by Master Trader Joe Ross
Author, Trader, Trading Mentor, and Founder of Trading Educators, Inc.
Developer of Instant Income Guaranteed
Here is an encapsulated generalized view of markets and trading:
Try to develop an inter-market view of how futures markets correlate with one another. Cows are fed grain to fatten them up, so when grain prices rise, expect higher meat prices — ergo, be ready to trade meats from the long side.
If meat prices go up, then so should other food prices like cocoa and sugar for candy bars.
Orange juice, coffee, and pork belly bacon are served for breakfast with eggs, and wheat toast is buttered with (ugh) corn oil margarine. If corn prices rise, the demand for wheat will rise, and both wheat toast and corn oil margarine will rise in price. Lesson: favor grains to the long side.
Half-witted politicians think they are being ecologically responsive by pushing for ethanol, but all this does is push the price of corn higher, then the price of meat higher, and finally the price of a lot of other things higher. Why do I call the politicians half-wits? Because anyone with even the smallest amount of knowledge knows that all you can get from corn as an energy source is exactly what you put into it. One unit of energy in and one unit of energy out.
If the trend in gold and interest rates has been declining, deflation is prevalent. Be ready to trade bonds and notes from the long side.
The opposite trends apply to inflation. When the prices of gold and interest rates are rising, expect most commodities to follow that trend, except independent currencies and the stock market, which decline with rising rates.
Manufacturers increase profits two basic ways without the need for increased efficiency: by lowering labor and raw materials costs, or by raising prices.
When inflation is prevalent, higher raw material costs are passed on to higher finished product costs to maintain a fixed profit margin. The Producer Price Index, PPI, usually increases before the Consumer Price Index, CPI, does. Factory utilization over 85% is thought to forecast rising inflation as well.
© by Joe Ross. Re-transmission or reproduction of any part of this material is strictly prohibited without the prior written consent of Trading Educators, Inc.
Instant Income Guaranteed - LITE Trade
Philippe Gautier: Administration and New Developments
Developer: Joe Ross
On 19th September 2017 we gave our Instant Income Guaranteed subscribers the following trade on Lumentum Holdings Inc (LITE). We sold price insurance as follows:
- On 20th September 2017, we sold to open LITE Oct 20 2017 47P @ 0.45$, with 30 days until expiration and our short strike about 21% below price action.
- On 6th October 2017, we bought to close LITE Oct 20 2017 47P @ 0.10$, after 16 days in the trade for quick premium compounding.
Profit: $35 per option
Margin: $940
Return on Margin Annualized: 89.94%
We have also added new types of trades for our IIG daily guidance since 2016, "no loss" propositions with unlimited upside potential, still using other people's money to trade.
Philippe

Receive daily trade recommendations - we do the research for you!
♦ SIGN UP TODAY! THIS IS WORTH THE INVESTMENT ♦
© by Joe Ross and Philippe Gautier. Re-transmission or reproduction of any part of this material is strictly prohibited without the prior written consent of Trading Educators, Inc.
Trading Article - Protective Stops
by Professional Trader Andy Jordan
Educator for Spreads, Options, Swing/Day Trading, and
Editor of Traders Notebook Complete and Traders Notebook Outrights
Protective stops have to be related to the strategy and the markets being traded. It is not a good idea to use a $200 stop that might be appropriate on a corn contract in sugar or the soybean market. This is because each market has a different value and different volatility. Protective stops should be linked to the volatility and value of the underlying market.
It is also a major mistake to use a protective stop purely based on your account size and how much you are willing to lose. If you have a $10,000 account and you don't want to risk more than $500 on any given trade, but the stop in this particular market and trade is at $750, you DON'T take the trade. Risk management and money management are major parts of trading, and have to be implemented into your trading strategy.
© by Andy Jordan. Re-transmission or reproduction of any part of this material is strictly prohibited without the prior written consent of Trading Educators, Inc.
Trading Video - Why having a view on a market isn't enough
by Professional Trader Marco Mayer
Educator for Forex and Futures, Systematic Trader, and
Creator of Ambush Trading Method, Ambush Signals, and AlgoStrats.com
In this video, Marco talks about why having a view on the direction of a market isn't enough. The reason is that just having a directional view doesn't make a trade...find out why!
Happy trading,
Marco
Feel free to email Marco with any questions, This email address is being protected from spambots. You need JavaScript enabled to view it..
© by Marco Mayer. Re-transmission or reproduction of any part of this material is strictly prohibited without the prior written consent of Trading Educators, Inc.
Check out our Blog!
To view previous published Chart Scan newsletters, please log in or click on "Join Us,"
shown above, to subscribe to our free "Members Only" section.
A WEALTH OF INFORMATION & EDUCATION:
Joe Ross-Trading Educators' popular free Chart Scan Newsletter has been published since 2004.
Note: Unless otherwise noted, all charts used in Chart Scan commentary were created
by using Genesis Financial Technologies' Trade Navigator (with permission).
Legal Notice and Copyright 2017 Disclaimer - Published by Trading Educators, Inc.
Chart Scan is a complimentary educational newsletter.

