

Newsletters (208)
Children categories
Edition 655 - December 30, 2016
New Year's Edition


Final Thoughts
by Master Trader Joe Ross
Author, Trader, Trading Mentor, and Founder of Trading Educators, Inc.
In a few days we begin a new year. Are you ready? Have you taken time to relax, make plans, and do a bit of self-examination? At Trading Educators we’ve done that, and we will be ready for 2017.
From where we sit it look as if the markets could be pretty wild, especially during the first quarter. The world is balancing on the edge of a razor blade, and there’s no telling what will fall and when. The fact is that maybe very little will fall and certain markets will race higher. 2017 looks to be a year where more than ever before, you will need to be in the right place at the right time. Crude oil could easily hit $60 a barrel. Gold could continue down below $1,000 before ultimately rising to as high as $2,500 by the end of the year.
If Mr. Trump and the World Trade Organization come to an agreement, look for the dollar to be devalued by close to 15%. It will be done in a way that few realize or expect. Imports will be taxed as a sort of semi-vat, while exports will be subsidized. The net effect will be to devalue the dollar. Few if any are talking about this, but it is real and the new administration will try hard to push it through. If it succeeds, it will affect all global trade. We are talking about something truly major.
If nothing else, 2017 promises to be exciting and will offer many opportunities to trade yourself into wealth. As usual, Trading Educators will be there to help you do it. We are traders, not investors, and because of that, we are able to go to wherever the money is being made. As traders, we need not do all the guessing and research that investors have to do. We don’t just write about trading, we actually do it. We always have skin in the game.
We hope you will join us for a successful 2017. We intend to be profitable, and want you to ride along with us.
Happy New Year to you all.
JR
© by Joe Ross. Re-transmission or reproduction of any part of this material is strictly prohibited without the prior written consent of Trading Educators, Inc.
Take advantage of our year-end specials!
Order the "Trading All Markets" Recorded Webinar and
receive a FREE 30-Minute Q&A with Joe Ross, valued at $200!
Check out our Blog!
To view previous published Chart Scan newsletters, please log in or click on "Join Us,"
shown above, to subscribe to our free "Members Only" section.
A WEALTH OF INFORMATION & EDUCATION:
Joe Ross-Trading Educators' popular free Chart Scan Newsletter has been published since 2004.
Note: Unless otherwise noted, all charts used in Chart Scan commentary were created
by using Genesis Financial Technologies' Trade Navigator (with permission).
Legal Notice and Copyright 2016 Disclaimer - Published by Trading Educators, Inc.
Chart Scan is a complimentary educational newsletter.
© by Trading Educators, Inc. Re-transmission or reproduction of any part of this material is strictly prohibited without prior written consent.
Edition 654 - December 23, 2016

From the Staff at Trading Educators,
wishing you a very Merry Christmas and a Happy New Year!
Season Greetings and End of the Trading Year Thoughts
by Master Trader Joe Ross
Author, Trader, Trading Mentor, and Founder of Trading Educators, Inc.
Dear friends,
I keep wondering where 2016 went and now we are looking at 2017. 2016 just flew by, but lots of things happened. We finished the development of our new website. We introduced some new products, and we received lot of messages from you about your trading successes.
For me the milestone has been the continued success of our Instant Income Guaranteed program. We are now over 3 years without a losing trade. Do you know of anyone else who can say that?
As for 2017, we are expecting much turmoil and wild volatility in virtually all markets. We are living in interesting times. We are making every effort to be able to guide you safely through what we see ahead.
Today, as I write this, I personally begin my time away from the markets. It has been a lifelong habit to stay away from mid December until the end of the first week in January. The markets can be pretty crazy in the latter days of the year that will end, and the first days of the year that is coming. As a company, we take time to be grateful for what we have, and to think, plan, and just relax. It’s amazing how getting away can make things more clear.
However, this is the time of the year when I want you to know that we are thinking about you and how we can better serve. And please do let us know what you would like to see on our website. Hearing from you in addition to making what we offer, whether free or for a price, is the only way we can truly stay connected.
At Trading Educators we are very much aware that our main purpose is creating new value. That keep us busy evaluating and improving what we do and gives us the impetus to come up with something new.
We truly hope you will do the same in your own lives. Stop taking any new trades, carefully monitor what you already have and get as far away from the business of trading as you possibly can, until we are a week into 2017.
We wish you a wonderful holiday season. Have many happy days between now and the end of the year and then beyond as we sail into 2017.
All the best all the time,
JR
© by Joe Ross. Re-transmission or reproduction of any part of this material is strictly prohibited without the prior written consent of Trading Educators, Inc.
$$ Bonus $$
Purchase the "Trading All Markets" Recorded Webinar and receive a 30-MINUTE Question and Answer session with Joe Ross, valued at $200!

Christmas Time is Here
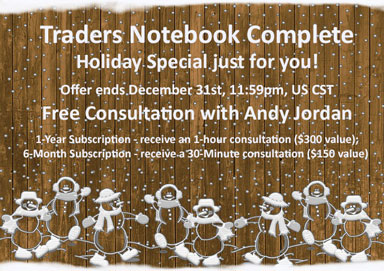
by Professional Trader Andy Jordan
Educator for Spreads, Options, Swing/Day Trading, and
Editor of Traders Notebook Complete and Traders Notebook Outrights
As always during the last days of the year, I like to look back to see what happened in 2016 and what changes I would like to make for the next year.
While 2015 was not very productive, 2016 was much better and positive in all 3 different categories: Spread Trading, Options Trading, and Outright Futures Trading. Especially spread trading which was doing great in 2016 after not doing so well in 2015. Options trading was very slow this year and we had only a few trades in 2016, but finished the year positive almost at equity highs! And our new Outright Trading Service that started the end of July is already showing nice numbers.
Honestly, if I can stay on this track in 2017, I will be happy! OK, I’d like to get a few more options trades and maybe a few more spread trades, but all in all I’d be happy to repeat the results in 2017.
I am wishing all of you a great Christmas time, hopefully with your family and friends. I will shut down my trading office for a week and will be back on the 2nd to check the markets.
 Merry Christmas,
Andy Jordan
© by Andy Jordan. Re-transmission or reproduction of any part of this material is strictly prohibited without the prior written consent of Trading Educators, Inc.
 Enjoy the Holidays
by Master Trader Marco Mayer
Educator for Forex and Futures, Systematic Trader, and
Creator of Ambush Trading Method, Ambush Signals, and AlgoStrats.com
Dear Traders,
I'd like to thank all of you for a great year 2016! I really enjoyed being in exchange with many of you on a regular basis.
I'll spend the next two weeks with my family and friends, with my mind far away from the markets. That's what I strongly suggest to do during these days of low liquidity. Just do what everyone else does and relax during this time. It's often the only two weeks of the year where I'm really 100% away from the markets as I usually keep on trading my systems during vacations if somehow possible. So I'm always looking forward to that XMAS break also knowing how eager I'll be to resume trading after a two weeks break. Just love that feeling to start into a new year with a clean slate, especially as my trading results have been somewhat mixed in 2016.
So I'd like to wish all of you a Merry Christmas and a Happy New Year 2017. Enjoy the holidays with your family and friends, and I'm looking forward to a great trading year 2017 with you!
Happy Trading!
Marco Mayer
© by Marco Mayer. Re-transmission or reproduction of any part of this material is strictly prohibited without the prior written consent of Trading Educators, Inc.
Check out our Blog!
To view previous published Chart Scan newsletters, please log in or click on "Join Us,"
shown above, to subscribe to our free "Members Only" section.
A WEALTH OF INFORMATION & EDUCATION:
Joe Ross-Trading Educators' popular free Chart Scan Newsletter has been published since 2004.
Note: Unless otherwise noted, all charts used in Chart Scan commentary were created
by using Genesis Financial Technologies' Trade Navigator (with permission).
Legal Notice and Copyright 2016 Disclaimer - Published by Trading Educators, Inc.
Chart Scan is a complimentary educational newsletter.
© by Trading Educators, Inc. Re-transmission or reproduction of any part of this material is strictly prohibited without prior written consent.
Edition 653 - December 16, 2016
“You have to find something that you want to accomplish, that you want to achieve…There has to be some goal that you set for yourself and, after you’ve reached that goal, you set a new one. You always have to be shooting for something, striving for something.” Larry Fitzgerald
Trading Idea
by Professional Trader Andy Jordan
Educator for Spreads, Options, Swing/Day Trading, and
Editor of Traders Notebook Complete and Traders Notebook Outrights
Andy is looking into a seasonal Crude Oil spread going long June and short May.
© by Andy Jordan. Re-transmission or reproduction of any part of this material is strictly prohibited without the prior written consent of Trading Educators, Inc.
Trading Article - Are you an efficient Trader?
by Master Trader Marco Mayer
Educator for Forex and Futures, Systematic Trader, and
Creator of Ambush Trading Method, Ambush Signals, and AlgoStrats.com
Most traders start out with a dream. And usually part of that dream is that once you’re a successful trader you’ll have a lot more time for the things in life you enjoy spending time with. Your family, friends, hobbies, spend time in nature and start other business opportunities you’ve been dreaming of realizing. Besides making money, for many the main reason to start trading is actually that they no longer want to spend 40 hours a week sitting in a office staring at a screen.
Unfortunately many traders end up doing the exact opposite of that. Staring at their screens for hours each day, looking at charts and quotes. They don’t really have a precise plan of their trading day. Instead they wake up, turn on their charts and wait for what they perceive as a trading opportunity. No need to say that this often leads to overtrading, but let’s say our trader has matured enough to be mostly free from such flaws.
Still being an active day trader he’s trading a lot in and out during the day, but being very talented he usually comes out ahead at the end of the trading day. Trading the E-Mini S&P 500 he manages to make a profit of 2 points a day on average. He’s trading two contracts so that’s 2.0 x $50 x 2 = $200. Doing 10 trades on average each day, paying $5 round turn per trade, that’s 10 x 2 x $5 = $100 commissions we have to subtract. So his actual profit after commissions is $100. Trading for 8 hours each day, that’s $12.50 per hour…for doing a quite exhausting job! Ouch.
Let’s have a look at our second trader. He knows his business very well after having invested a considerable amount of time and money to learn about the markets. Our second trader trades a system with precise trading rules, also in the E-Mini S&P 500. Let’s call it Ambush. He knows exactly at what times of the day he has to take action. In his case, when to place his entry order and when to exit his positions each day. This way he can easily plan his day, knowing that he won’t have to watch the markets at all. Being a professional he takes his trading business very seriously and religiously tracks each trade, checks his fill prices and so on. Still he doesn’t need more than 10 minutes each day to run his trading business. On average he makes about $105 per trade per contract. Never making more than one trade a day, he just has to subtract $5 commissions which leaves him with $100. As he just needs 10 minutes each day to place his orders, that’s $600 per hour on the days where he actually trades! For doing a not very exhausting job…
What a difference compared to our chart watcher! Hope you see the light here. This is huge, and once you realized this truth you can make a big step forwards in your trading career. Herein lies the reason why I decided to move towards systematic trading many years ago. First of all watching charts all day does get really boring once you no longer trade for the excitement, and I had a very different dream of what my days would look like as a trader. But even more importantly I can use all that freed up time for other business ideas, hobbies, to create new systems and to write articles like this one and make additional money helping other traders.
At least I’d suggest that even if you’re day trading discretionary, take your time to really learn about the markets you’re trading. Get some statistics and you’ll discover that every market has times during the day where it makes most sense to trade. Focus your trading activity on these time periods. They’re hardly changing over time so you can plan your trading day nicely. Truth is that most of the time it simply is a waste of time and money to day trade. I can almost guarantee you that you’ll make more money this way than trading all day long, especially after subtracting trading costs.
Happy Trading!
Marco
© by Marco Mayer. Re-transmission or reproduction of any part of this material is strictly prohibited without the prior written consent of Trading Educators, Inc.
The Law of Charts with Commentary
by Master Trader Joe Ross
Author, Trader, Trading Mentor, and Founder of Trading Educators, Inc.
Spreads
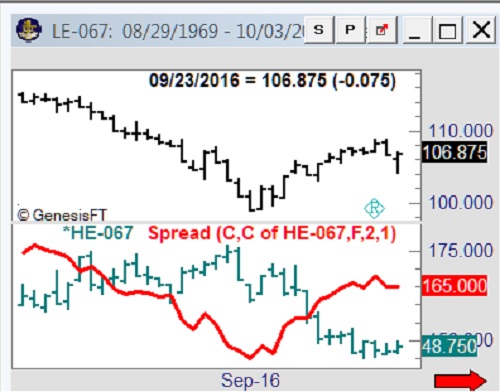
I was cruising through my charts one morning looking for an easy spread to trade. I saw that the spread between long Lean Hogs, and short Live Cattle had reached an extreme and was beginning to bottom out. Looking at the prices themselves, I saw cattle price possibly rising, while hog prices continued to fall. I thought to myself, "Aha! Here is my opportunity for a simple observation spread."
The markets are full of these kinds of spreads, if you just look for them. Because cattle and hogs trade with equal point values, it is not necessary to use multipliers to truly see whether or not the spread is making money. Nevertheless, I wanted to see the dollar value of the spread, so I multiplied each leg of the spread by its full point value of $400. That means I entered the spread as 400*LE - 400*HE, and brought up the chart fully expecting to see some kind of entry point. It was there, a 1-2-3 low.
© by Joe Ross. Re-transmission or reproduction of any part of this material is strictly prohibited without the prior written consent of Trading Educators, Inc.
Trading Article - Do you think that what this guy wrote is true?
by Master Trader Joe Ross
Author, Trader, Trading Mentor, and Founder of Trading Educators, Inc.
"You can get ahead of yourself in this game, and it’s dangerous to get cocky. But I’ve had times where for an hour I could do no wrong. I’m trading and 99 percent of the trades are good, they’re all for 30 or 50 contracts, and I’ll make 10 grand. Then I’ll overextend myself and maybe buy 10 or 15 contracts, fighting the trend just because I know prices have hit a support level. Then prices blow through that support and I can’t get out without losing half of what I made earlier. When that happens, you’ve just got to sit back, take a deep breath, drink a glass of water, and get back in."
I think that there is some truth in what was written, but there is also a lot of bad advice there as well. You can get ahead of yourself in trading – and trading is not a game, it is a business in which it is dangerous to get cocky. We’ve all had our “magic” moments when we could do no wrong. But a truly great trader will learn to take his money off the table and be satisfied with what he made. It is the greedy trader who overextends himself. It is the foolish trader who fights the trend. It is an even greater fool who believes that there is such a thing as “support.” The foolish advice here is that whoever wrote what you quote readily admits that prices blew through so-called support, which makes it not support at all! He has already proved he is a fool by overtrading his account at what he determined to be support. Now he tells you to continue overtrading by gritting your teeth and jumping back in. Whoever wrote that “advice” sounds like a real blow-hard. He claims to trade big-time, but I don’t know any truly great traders who make that many mistakes and then pass it off as advice!
© by Joe Ross. Re-transmission or reproduction of any part of this material is strictly prohibited without the prior written consent of Trading Educators, Inc.

Check out our Blog!
To view previous published Chart Scan newsletters, please log in or click on "Join Us,"
shown above, to subscribe to our free "Members Only" section.
A WEALTH OF INFORMATION & EDUCATION:
Joe Ross-Trading Educators' popular free Chart Scan Newsletter has been published since 2004.
Note: Unless otherwise noted, all charts used in Chart Scan commentary were created
by using Genesis Financial Technologies' Trade Navigator (with permission).
Legal Notice and Copyright 2016 Disclaimer - Published by Trading Educators, Inc.
Chart Scan is a complimentary educational newsletter.
© by Trading Educators, Inc. Re-transmission or reproduction of any part of this material is strictly prohibited without prior written consent.
Edition 652 - December 9, 2016
Finding your trading nitch in the market just got easier! Trading Educators offers several Trading Advisory Services. Select the service that fits your trading style or look into entering a different market.
Trading on News Days - Ambush Day Trading the E-Mini S&P 500
by Master Trader Marco Mayer
Educator for Forex and Futures, Systematic Trader, and
Creator of Ambush Trading Method, Ambush Signals, and AlgoStrats.com
This year we’ve had a couple of events that were likely to have a strong impact on the markets:
- BREXIT Decision in June
- FED Rate Raise Comments in September
- US Elections in November
- Italy Referendum in December
All of them happened over a weekend so the question many traders have been asking themselves was whether to trade on these days or not. Ambush traders have been no exception here so I got a lot of emails asking what to do.
My answer is always the same. It’s impossible to know what the actual news will be and how the markets will actually react.
What we do know though is that on such days it’s very likely that volatility will be much higher than on average. How that volatility will play out is impossible to know. In case of Ambush this means it’s much more likely on such days to either get stopped out with a big loss or to catch a really big winner. Because of that the question comes back to the trader: Take the risk or not? Another option is of course to trade less size on such days, knowing that volatility is likely to explode.
Now the good news is that on most of these events Ambush traders who have been ready to accept the risk made a killing day trading in the E-Mini S&P 500. The only even where Ambush lost was on the Trump event where the stop loss avoided bigger losses and made most of it back already on the next day.
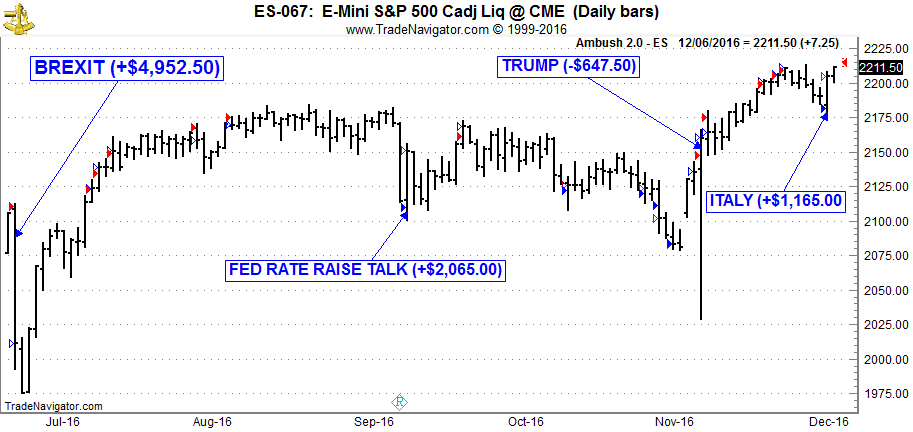
Overall Ambush had a great year in the E-Mini S&P 500 and thanks to the Italy-Trade the equity is now at new all time highs, here’s this years equity curve showing all E-Mini S&P 500 Day Trades, trading one contract including $10 per round-turn for commissions:
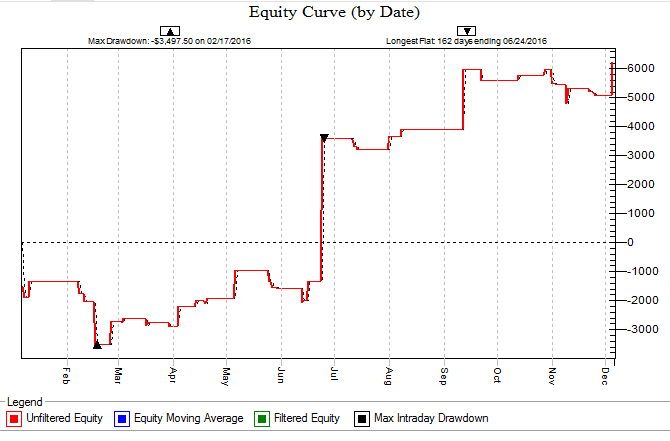
The average trade has been about $145 (including $10 commissions round-turn), which is amazing considering that Ambush is a Day Trading method, meaning you never keep positions over night!
Now if you want to become an Ambush Trader too, there’s different ways to do so. You can either buy the Ambush eBook and learn all about how the method works and set everything up yourself.
Or you join Ambush Signals and simply get access to the daily Ambush Signals for all of the supported Futures markets. This way you can just follow Ambush without having to go through the hassle of setting up charts, indicators and taking care of getting the right data and so on.
© by Marco Mayer. Re-transmission or reproduction of any part of this material is strictly prohibited without the prior written consent of Trading Educators, Inc.
The Law of Charts with Commentary
by Master Trader Joe Ross
Author, Trader, Trading Mentor, and Founder of Trading Educators, Inc.
Ledges
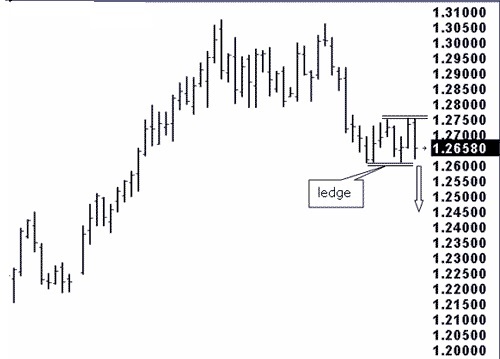
On the chart below we see that prices have formed an 8-bar ledge.
The Law of Charts states that a ledge begins with the profit taking that occurs during or at the end of a trend or swing. All ledges begin with Ross hooks. However, due to indecision, a sense of fair value, or confusion as to which way prices will go, the normal progression of the swing or trend does not continue.
The Law of Charts states that the percentage in favor for a successful trade is to take a breakout from a ledge in the direction of the former swing or trend. The arrow indicates that the best chance for success would be a breakout to the down side.
© by Joe Ross. Re-transmission or reproduction of any part of this material is strictly prohibited without the prior written consent of Trading Educators, Inc.
Trading Article - Looking at how the money supply affects trading in the markets.
by Master Trader Joe Ross
Author, Trader, Trading Mentor, and Founder of Trading Educators, Inc.
There are two important components of federal market activity which affect long- term economic activity and stock and commodity values; these are interest rates and money supply. A contracting money supply was one of the factors that caused the Great Depression of the 1930's.
In the early 1980's most traders focused almost totally on the money supply figures, which would cause cash bonds and T-Bill rates to react violently as soon as the M-1 and M-2 figures were released every Friday afternoon. The Fed Funds Rate and Discount Rate are the most important rates, and three consecutive increases or decreases establish a trend. When money supply decreases and interest rates increase, they tend to suppress economic growth.
The Fed also buys and sells government securities, through special authorized dealers, to affect the overall money supply.
Inflation becomes a problem when the CRB spot index and CRB raw industrial commodities begin to increase sharply. Stock traders will decrease holdings in interest rate sensitive stocks, like utilities, and buy cyclical stocks in the Dow Industrials, like Alcoa, or steel stocks. Expect higher interest rates to follow inflation. When interest rates move higher, T-Bonds, all T-Notes, T-Bills, and Eurodollars can be expected to feel downward pressure.
Usually, but not always, rising interest rates help the dollar as long as interest rates in the U.S. are relatively higher than those in other nations. By relatively, I mean that the differential between U.S. interest rates vs. those of competing nations is somewhat out of line to the up side.
© by Joe Ross. Re-transmission or reproduction of any part of this material is strictly prohibited without the prior written consent of Trading Educators, Inc.
Blog Post - Simplicity of Trading
by Professional Trader Andy Jordan
Educator for Spreads, Options, Swing/Day Trading, and
Editor of Traders Notebook Complete and Traders Notebook Outrights
Keeping things simple can benefit you and your bottom line in the long run. Read more.
© by Andy Jordan. Re-transmission or reproduction of any part of this material is strictly prohibited without the prior written consent of Trading Educators, Inc.
Check out our Blog!
To view previous published Chart Scan newsletters, please log in or click on "Join Us,"
shown above, to subscribe to our free "Members Only" section.
A WEALTH OF INFORMATION & EDUCATION:
Joe Ross-Trading Educators' popular free Chart Scan Newsletter has been published since 2004.
Note: Unless otherwise noted, all charts used in Chart Scan commentary were created
by using Genesis Financial Technologies' Trade Navigator (with permission).
Legal Notice and Copyright 2016 Disclaimer - Published by Trading Educators, Inc.
Chart Scan is a complimentary educational newsletter.
© by Trading Educators, Inc. Re-transmission or reproduction of any part of this material is strictly prohibited without prior written consent.
Edition 651 - December 2, 2016
“What is desired in a Trader is kindness, and a poor Trader is better than a liar.” Master Trader Joe Ross
Traders Notebook Outrights
by Professional Trader Andy Jordan
Educator for Spreads, Options, Swing/Day Trading, and
Editor of Traders Notebook Complete and Traders Notebook Outrights
I want to present an outright futures trade we had this week in Traders Notebook Outrights. We went long the Crude Oil at 47.00 on 11/30 with a risk of $600 per contract on the “normal” futures contract (the risk per contract on the E-mini CL was only $300). We reached our first target at 47.60 an hour later (first gray horizontal line) and the second target at 48.80 on the same day (second gray horizontal line). We are still holding the last lot using a trailing stop with a possible target at 51.80.
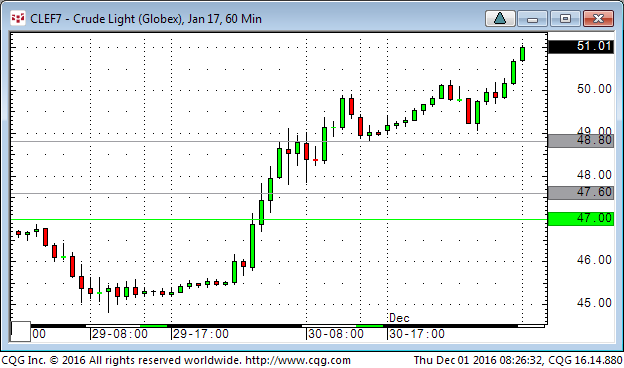
If you are interested in this kind of swing trades, our newsletter service Traders Notebook Outrights is the right choice for you. If you have any questions, please do not hesitate to contact me at This email address is being protected from spambots. You need JavaScript enabled to view it..
© by Andy Jordan. Re-transmission or reproduction of any part of this material is strictly prohibited without the prior written consent of Trading Educators, Inc.
The Law of Charts with Commentary
by Master Trader Joe Ross
Author, Trader, Trading Mentor, and Founder of Trading Educators, Inc.
Time Independent Charts
If you want to trade a chart that is time-independent, you have two choices:
- Point and figure charts
- Tick charts
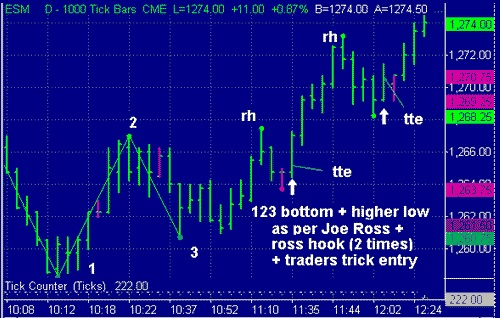
To create a tick chart you need software that will enable you to do so. I use Genesis Trade Navigator. Instead of each bar on the chart representing a specific amount of time, each bar represents a specific number of ticks. Tick charts change the entire structure of the prices you are looking at. The magnitude of the moves changes markedly, as well as having trends appear where there is no trend with charts based on time. The time between bars also varies. At a setting of 500 ticks per price bar, you might find an hour or more between bars, or a matter of minutes between bars, depending upon the liquidity of the market you are trading.
One of the nicest things about tick charts is that you can literally create them to match your own style of trading. Your chart for each market can be unique to you and you alone. The number and variety of tick charts is virtually unlimited. Someone trading a bar chart in which each bar contains 257 ticks is going to see a different chart from the person trading a bar chart in which each bar contains 250 ticks.
The chart below was sent in to me by one of our subscribers. It is a chart of the e-mini S&P. Each bar contains 1,000 ticks. This is the text that accompanied the chart: "Another example of using price bars and price bar relationships correlated with 15-min and 60-min charts. After a large go down, it is reasonable to have it go back up some."
© by Joe Ross. Re-transmission or reproduction of any part of this material is strictly prohibited without the prior written consent of Trading Educators, Inc.
Instant Income Guaranteed - TWX Trade
Developer: Joe Ross
Administration and New Developments: Philippe Gautier
Check out our newest IIG example which produced for our subscribers a $25 Profit (Average), $1,370 Margin, and 111.01% Return on Margin Annualized. Read more.
We have also added new types of trades for our IIG daily guidance, "no loss" propositions with unlimited upside potential, still using other people's money to trade .
Instant Income Guaranteed
© by Joe Ross and Philippe Gautier. Re-transmission or reproduction of any part of this material is strictly prohibited without the prior written consent of Trading Educators, Inc.
Blog Post - "Once I’ve achieved success as a trader, then what? I’ve heard that after a while trading can become boring."
by Master Trader Joe Ross
Author, Trader, Trading Mentor, and Founder of Trading Educators, Inc.
I know you would all like to have that problem, but I can vouch for its being true. I always have to find new ways to trade or I do become bored. However, I have never run out of ways to trade that remain exciting, at least for a fairly long time. Read more.
© by Joe Ross. Re-transmission or reproduction of any part of this material is strictly prohibited without the prior written consent of Trading Educators, Inc.
Say Hello to Ambush Signals
by Master Trader Marco Mayer
Educator for Forex and Futures, Systematic Trader, and
Creator of Ambush Trading Method, AlgoStrats.com
Rave reviews are already coming in!
"Subscribed and loving it. Now I just look at the numbers generated for what I want to trade and put the orders in with my broker. It's just that easy. It's pretty much point and click. I really feel empowered and way more confident now, thanks to the service." DR, Michigan
You will be excited to learn about our new service, Ambush Signals for the Futures markets. Watch my short presentation to find out more about Ambush Signals.
Yes, I want to become an Ambush trader!
© by Marco Mayer. Re-transmission or reproduction of any part of this material is strictly prohibited without the prior written consent of Trading Educators, Inc.
Check out our Blog!
To view previous published Chart Scan newsletters, please log in or click on "Join Us,"
shown above, to subscribe to our free "Members Only" section.
A WEALTH OF INFORMATION & EDUCATION:
Joe Ross-Trading Educators' popular free Chart Scan Newsletter has been published since 2004.
Note: Unless otherwise noted, all charts used in Chart Scan commentary were created
by using Genesis Financial Technologies' Trade Navigator (with permission).
Legal Notice and Copyright 2016 Disclaimer - Published by Trading Educators, Inc.
Chart Scan is a complimentary educational newsletter.
© by Trading Educators, Inc. Re-transmission or reproduction of any part of this material is strictly prohibited without prior written consent.
Edition 650 - November 25, 2016

Dear Friends,
Whenever this time of year rolls around, I find myself with an attitude of gratitude. This week we celebrated Thanksgiving Day. Although "Thanksgiving" is not celebrated here in Uruguay, many living here celebrated at various places around the country. There were at least fifty people at the gathering my wife and I went to.
Trading and markets have been a major part of my life for almost 60 years. Trading has been the means through which my family and I have received many blessings.
I am grateful that I’ve been able to share those blessings with my many students. I am thankful for each and every one of you. Trading can be a lonely business, especially if you selfishly keep entirely to yourself what you know and have learned. At Trading Educators, it’s just not in us to be that way.
I wonder if you realize how rare it is to find traders, who are not only successful with their own trading, but are also willing to help others to achieve success?
A few days ago, as I was looking at our website, I stumbled across a brief statement of our philosophy at Trading Educators. I wonder how many of you have read it, and have truly given it some serious thought?
"Teach our students the truth in trading — teach them how to trade,"
and
"Give them a way to earn while they learn — realizing that it takes time to develop a successful trader."
All of our staff and associates truly believe in these ideas, and we work hard to bring you the best we have to offer because your success is our success.
Having been through the steps ourselves, we know how difficult it can be to one day realize that you are able to trade for a living - to realize that you have finally made it! There are so many times when you are ready to give up; So many times when you feel defeated. Trading looks easy, but once you are involved you realize that it takes great dedication, and persistence to reach the top. The toughest part of trading is learning to master yourself.
We want to encourage you to keep at it. Don’t give up. The rewards are greater than you think.
For those of you who celebrated Thanksgiving Day, we hope it was a terrific day for you. For those of you who live in countries where there is no Thanksgiving Day, perhaps you should give it a try. Set aside a day to be thankful for what you have. Everyone has something to be thankful for. At Trading Educators we are thankful that we have so much to share with all of you.
As always, wishing you all the best,
JR
© by Joe Ross. Re-transmission or reproduction of any part of this material is strictly prohibited without the prior written consent of Trading Educators, Inc.
Be sure to check your inbox for our Cyber Monday specials!
Visit our Blog!
To view previous published Chart Scan newsletters, please log in or click on "Join Us,"
shown above, to subscribe to our free "Members Only" section.
A WEALTH OF INFORMATION & EDUCATION:
Joe Ross-Trading Educators' popular free Chart Scan Newsletter has been published since 2004.
Note: Unless otherwise noted, all charts used in Chart Scan commentary were created
by using Genesis Financial Technologies' Trade Navigator (with permission).
Legal Notice and Copyright 2016 Disclaimer - Published by Trading Educators, Inc.
Chart Scan is a complimentary educational newsletter.
© by Trading Educators, Inc. Re-transmission or reproduction of any part of this material is strictly prohibited without prior written consent.
Edition 649 - November 18, 2016
TRADING EDUCATORS presents..
Say Hello to Ambush Signals
by Master Trader Marco Mayer
Educator for Forex and Futures, Systematic Trader, and
Creator of Ambush Trading Method, AlgoStrats.com
You've been curious about the Ambush Trading Method EBook for a while, but haven't been sure, or didn't want to go through the hassle of setting up your charting software accordingly. Or the thought of having to calculate the entry price for each of the markets scared you off. Or if you simply aren't ready to invest in the Ambush Trading Method EBook as you haven't been sure if it's actually for you in the long run.
You will be excited to learn about our new service, Ambush Signals for the Futures markets. Watch my short presentation to find out more about Ambush Signals.
Join Marco Mayer - Ambush Signals!
© by Marco Mayer. Re-transmission or reproduction of any part of this material is strictly prohibited without the prior written consent of Trading Educators, Inc.

Trading Plan Series - Part 8
by Professional Trader Andy Jordan
Educator for Spreads, Options, Swing/Day Trading, and
Editor of Traders Notebook Complete and Traders Notebook Outrights
In Part 8 of our Trading Plan Series, Andy talks about the "typical part" of a trading plan the entry strategies and setups.
© by Andy Jordan. Re-transmission or reproduction of any part of this material is strictly prohibited without the prior written consent of Trading Educators, Inc.
The Law of Charts with Commentary
by Master Trader Joe Ross
Author, Trader, Trading Mentor, and Founder of Trading Educators, Inc.
SPIKE REVERSAL
Spike reversals have almost always been good for me. They are a definite setup, and with the proper filters, which we teach in our "Trading All Markets" online recorded webinar, it’s possible to approach 90% winning trades. There have been times during my trading career that I traded only spike reversals. However, the one in the graph would not have been taken. The reason is the gap opening on the bar following the reversal bar.
To the best of my knowledge, gap openings result in 50% good trades and 50% bad trades. However, 50-50 is not breakeven because of commissions and fees. It means I miss some beautiful trades, but I always want the probabilities to be in my favor.
© by Joe Ross. Re-transmission or reproduction of any part of this material is strictly prohibited without the prior written consent of Trading Educators, Inc.
Blog Post - Reaching Your Trading Goals
by Master Trader Joe Ross
Author, Trader, Trading Mentor, and Founder of Trading Educators, Inc.
As a trader, it's essential that you set specific goals. Trading is chaotic enough without trying to achieve unstructured goals that are difficult to manage and reach. Making profitable investments requires you to prepare carefully. You have to develop hypotheses regarding current market conditions. You have to devise...read more.
© by Joe Ross. Re-transmission or reproduction of any part of this material is strictly prohibited without the prior written consent of Trading Educators, Inc.
Instant Income Guaranteed - EWZ Trade
Developer: Joe Ross
Administration and New Developments: Philippe Gautier
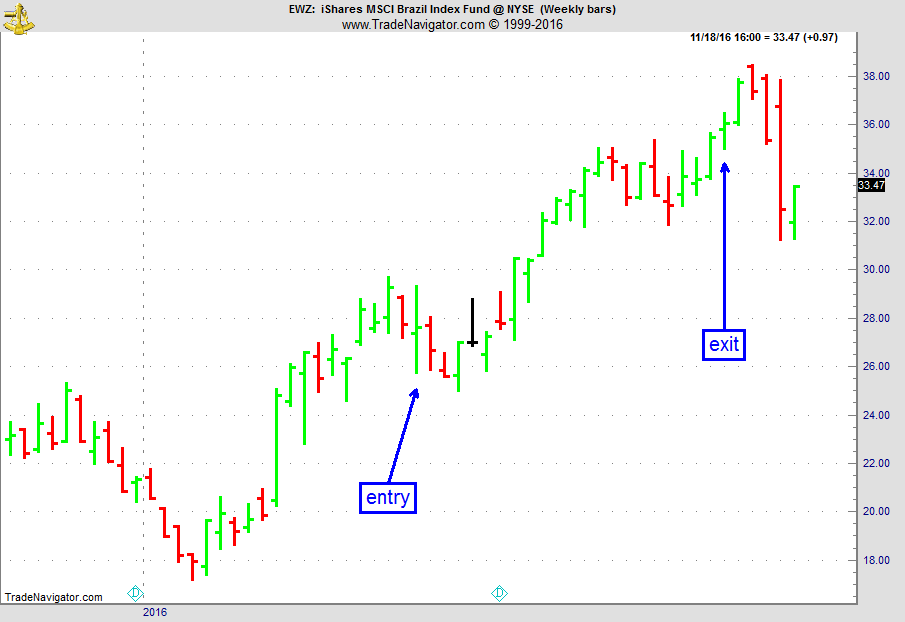
On 11th May 2016, we gave our subscribers a new type of trade for EWZ, the Brazil ETF, which was showing accumulation on a pullback on the weekly chart.
We entered a "complex position" for a net credit (still working with OPM, i.e. other people's money, as usual), but with unlimited upside potential.
- On 12th May 2016, we entered the trade for a credit of $1.20 (or $120 per position).
- On 14th October 2016, we closed the trade @ $4.15, after 155 days in the trade.
Profit: $535
Margin: $760
Return on Margin annualized: 165.77%
These are low maintenance, low stress trades with lots of upside potential.
We presently have 15 of these trades opened. We took partial profits on some of them.
This new technique allowed us to take advantage of the recent sector rotation moves in the market, with stocks like US Steel (X), to name only one.
If you are interested in learning this new technique, come and join us!
Philippe
Instant Income Guaranteed
♦ SIGN UP TODAY! YOU ARE WORTH THE INVESTMENT ♦
This includes a daily 80+ page report along with a daily podcast!
© by Joe Ross and Philippe Gautier. Re-transmission or reproduction of any part of this material is strictly prohibited without the prior written consent of Trading Educators, Inc.
Check out our Blog!
To view previous published Chart Scan newsletters, please log in or click on "Join Us,"
shown above, to subscribe to our free "Members Only" section.
A WEALTH OF INFORMATION & EDUCATION:
Joe Ross-Trading Educators' popular free Chart Scan Newsletter has been published since 2004.
Note: Unless otherwise noted, all charts used in Chart Scan commentary were created
by using Genesis Financial Technologies' Trade Navigator (with permission).
Legal Notice and Copyright 2016 Disclaimer - Published by Trading Educators, Inc.
Chart Scan is a complimentary educational newsletter.
© by Trading Educators, Inc. Re-transmission or reproduction of any part of this material is strictly prohibited without prior written consent.
Edition 648 - November 11, 2016

The Law of Charts with Commentary
by Master Trader Joe Ross
Author, Trader, Trading Mentor, and Founder of Trading Educators, Inc.
VOLATILITY STOP
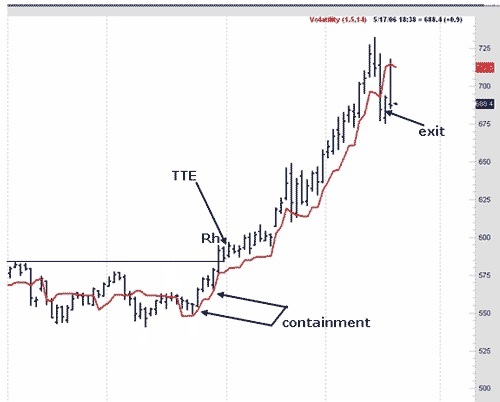
In past issues of Chart Scan I mentioned that The Law of Charts has many implementations. One of them is the Traders Trick Entry. But there are others. One implementation of The Law of Charts is done using the Volatility Stop study (VS).
When you have a trading range and prices ultimately break beyond the trading range, you have a defined trend. When they subsequently form a Ross hook, and then violate the point of that hook, a trend has been established. This is what happened in gold futures based on the daily chart. A low was in place at the base of a trading range. Prices violated the high point of the trading range, and then violated the point of the Ross hook. The VS could then come into play. I will not have time or space to describe in detail the parameters of the VS; however, it is a wonderful device for curve fitting to the reality of a trend. Unlike a moving average, the VS is reflective of current volatility in the market.
The way I use it is to curve fit so that VS shows containment at the base of the new swing that is being formed. From that point you can stay in as long as you do not get a Close below the VS. Some implementations of the VS enable you to offset the VS line by pushing it ahead one day, so that you can know where you will place your protective stop tomorrow. You can change the number of bars to be placed into the moving average of the volatility, and you can use a combination of offset, moving average, and a multiplier to make that VS line snuggle right up to the lows of the trend. The parameter settings for the chart below were a multiplier of 1.5 and 14 bars in the moving average of volatility. The rest of the story is on the chart.
© by Joe Ross. Re-transmission or reproduction of any part of this material is strictly prohibited without the prior written consent of Trading Educators, Inc.
Question from a Subscriber:
A reader asks: "I bought a system that requires a minimum account size of $20,000. If you were me, how would you manage it?"
by Master Trader Joe Ross
Author, Trader, Trading Mentor, and Founder of Trading Educators, Inc.
Well, since I’m not you, I can only tell you how I would manage it. If I lost $10,000, I would stop trading and examine my losses to discover if a logical trading plan of action is being pursued. I would separate losses into technical and psychological failures. I would examine each of them separately to discern if any consistent losing behavioral patterns are evident, such as violating the rules of the trading system or if self-discipline is not being maintained. If I were winning, I would be sure to remove my initial startup capital from my account, once my account size had doubled.
Your question brings to mind a sad story about a friend of mine. It took place years ago in a market situation much like we are seeing today in the metals. He was trading the Mexican peso with insider information, and managing an account of $200,000. Each participant in the managed account put up $20,000. In very little time, the account grew to $500 thousand. At that time, with that amount of money, you could really move the peso and cause prices to move against you. There was simply no room for that much money to be traded in that market at that time, and they had no desire to be market movers. So my friend began to trade silver futures, also with inside information. Silver was on a rampage along with gold. Before long, they had $1.2 million in the account. However, their timing was terrible. They were caught in the fiasco when the Hunt brothers tried to corner the silver market. Silver began to crash, and soon their account was wiped out. All the money was lost, the entire $1.2 million. I asked my friend, "When you had $1.2 million in the account, why didn't you at least take out the seed money? Why didn't you take out the $200,000? He said, "No one wanted to touch that money. We were on a roll!" Lesson learned: Take the money when it is there to be taken. At least take out your seed money.
© by Joe Ross. Re-transmission or reproduction of any part of this material is strictly prohibited without the prior written consent of Trading Educators, Inc.
AA TRADE
Instant Income Guaranteed
Developer: Joe Ross
Administration and New Developments: Philippe Gautier
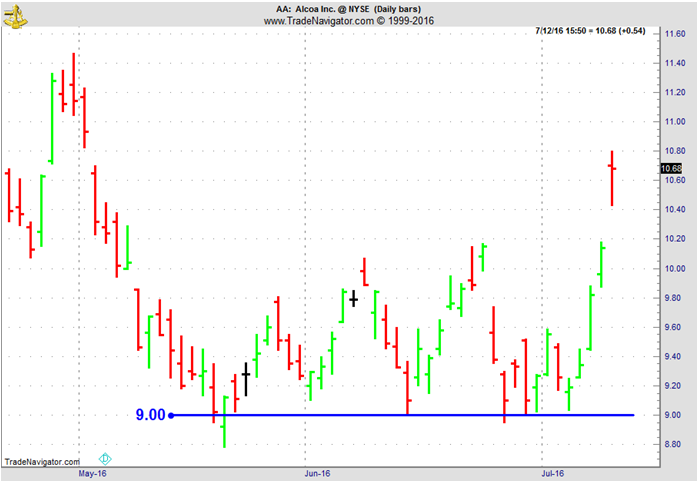
On 12th July 2016 we gave our IIG subscribers the following trade on AA, which gapped up on earnings and was showing strong accumulation. The trade was suitable for very small accounts, with an initial margin of only $180. We decided to sell price insurance as follows the following day:
- On 13th July 2016, we sold to open AA Aug 26 2016 9P @ $0.10, i.e. $10 per option sold, with 43 days to expiration, and our short strike at a major support zone, 16% below price action.
- On 21st July 2016, we bought to close AA Aug 26 2016 9P @ $0.05, after 8 days in the trade, for quick premium compounding
Profit (average): $5
Margin: $180
Return on Margin Annualized: 126.74%
We have also added new types of trades for our IIG daily guidance, "no loss" propositions with unlimited upside potential, still using other people's money to trade.
Philippe
Instant Income Guaranteed
♦ SIGN UP TODAY! YOU ARE WORTH THE INVESTMENT ♦
This includes a daily 80+ page report along with a daily podcast!
© by Joe Ross and Philippe Gautier. Re-transmission or reproduction of any part of this material is strictly prohibited without the prior written consent of Trading Educators, Inc.
Traders Notebook Outright Futures Trading
by Master Trader Andy Jordan
Educator for Spreads, Options, Swing/Day Trading, and Editor of Traders Notebook Complete and Traders Notebook Outrights
Traders Notebook Outrights gives you high probablity trades that are hand-picked for optimum results. If you are a futures swing trader looking for real trades while learning the correct way to place stops and the art of trade management, this is for you.
Traders Notebook Outright Guide explains the Outright trading service from Trading Educators. It shows you around on the Outright Campus, and how to use the information provided by the service.
© by Andy Jordan. Re-transmission or reproduction of any part of this material is strictly prohibited without the prior written consent of Trading Educators, Inc.
This Week's Blog Post: Vacation trip to Samaná
by Master Trader Andy Jordan
Educator for Spreads, Options, Swing/Day Trading, and Editor of Traders Notebook Complete and Traders Notebook Outrights
From Saturday October 29 until November 5 my wife and I took a vacation trip to Samaná, Dominican Republic. From Santiago, where we live, it takes about a 3 hour drive to get there. I love the region of Samaná because it is still very virgin compared to Bavaro or Punta Cana with only a few hotels. Read more.

© by Andy Jordan. Re-transmission or reproduction of any part of this material is strictly prohibited without the prior written consent of Trading Educators, Inc.
AlgoStrats:FX Live Account Gain With Low Risk
by Master Trader Marco Mayer
Educator for Forex and Futures, Systematic Trader, and
Creator of Ambush Trading Method and AlgoStrats.com
Marco Mayer's AlgoStrats:FX Live Trading account gained about +4% with a very low target risk of 0.5% per trade in October.
To learn more, here's a video where Marco walks you through the recent performance of AlgoStrats:FX:
© by Marco Mayer. Re-transmission or reproduction of any part of this material is strictly prohibited without the prior written consent of Trading Educators, Inc.
Check out our Blog!
To view previous published Chart Scan newsletters, please log in or click on "Join Us,"
shown above, to subscribe to our free "Members Only" section.
A WEALTH OF INFORMATION & EDUCATION:
Joe Ross-Trading Educators' popular free Chart Scan Newsletter has been published since 2004.
Note: Unless otherwise noted, all charts used in Chart Scan commentary were created
by using Genesis Financial Technologies' Trade Navigator (with permission).
Legal Notice and Copyright 2016 Disclaimer - Published by Trading Educators, Inc.
Chart Scan is a complimentary educational newsletter.
© by Trading Educators, Inc. Re-transmission or reproduction of any part of this material is strictly prohibited without prior written consent.
Edition 647 - November 4, 2016
You asked for it and we listened. Andy Jordan is now offering a new service called Traders Notebook Outrights for swing traders. Also, scroll down to read about Marco Mayer's AlgoStrats:FX Live Trading Account which gained about +4% with a very low target risk of 0.5% per trade.
The Law of Charts with Commentary
by Master Trader Joe Ross
Author, Trader, Trading Mentor, and Founder of Trading Educators, Inc.
A Traders Trick Entry (TTE) Question
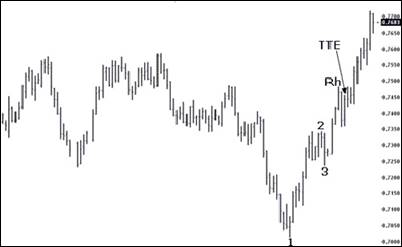
This week someone asked me: "Joe, would you have taken the Traders Trick even though prices finished in the lower half of the price bar?"
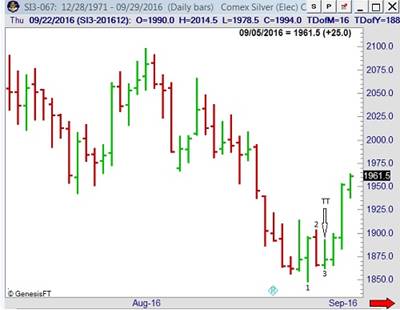
My answer was "I would not take it!" We were looking at a Traders Trick Entry ahead of a breakout of the #2 point of a 1-2-3 low at the end of a swing. However, since my objective would have been scalp money around the #2 point, prices would have had to move quite a bit on the next bar just to reach the high of the of the #3 bar. As you can see, price did not reach the #2 bar until a day later.
Over the years, many refinements have been made to the TTE. These refinements have made using them result in a very high win percentage. You can learn about the TTE refinements by signing up for the Traders Trick Advanced Concepts Webinar.
© by Joe Ross. Re-transmission or reproduction of any part of this material is strictly prohibited without the prior written consent of Trading Educators, Inc.
Question from a Subscriber:
A reader asks: How do you handle fear? I seem to have plenty of it.
by Master Trader Joe Ross
Author, Trader, Trading Mentor, and Founder of Trading Educators, Inc.
Let’s get one thing straight. Fear, for the majority of traders, is a very real thing. You have it, I have it. Others have it as well. What is it that traders fear? The top three, in order, are:
- Fear of missing a trade.
- Fear of losing money.
- Fear of being wrong and losing face.
In order to become a professional trader, you must learn to deal with fear. The first step is to acknowledge that you have it, which is what you have done. Once you admit to fear, you can begin to deal with it.
When you notice the impulse to trade based on strong fear, it is usually best to literally step out of the trap by stepping out of the situation.
You need to get up, walk away from the computer. Turn off the television if it's tuned to a financial station, take a walk, get something to eat, go outside and cut the grass, water the lawn, or do anything that will move you out of the fear/panic mode.
Don’t return to your trading desk until you have managed to achieve some emotional control over your fear/panic reaction. If you can’t get a grip on your fear, then don’t come back that day.
Most likely you will find that even if you keep thinking about the miserable market conditions while you water the lawn, simply getting away from the keyboard and monitor is enough to make a difference. It removes the demand to take action, and gives you the mental space to gain perspective and let go of your impulsive, fear-based reaction.
© by Joe Ross. Re-transmission or reproduction of any part of this material is strictly prohibited without the prior written consent of Trading Educators, Inc.
SLCA TRADE
Instant Income Guaranteed
Developer: Joe Ross
Administration and New Developments: Philippe Gautier
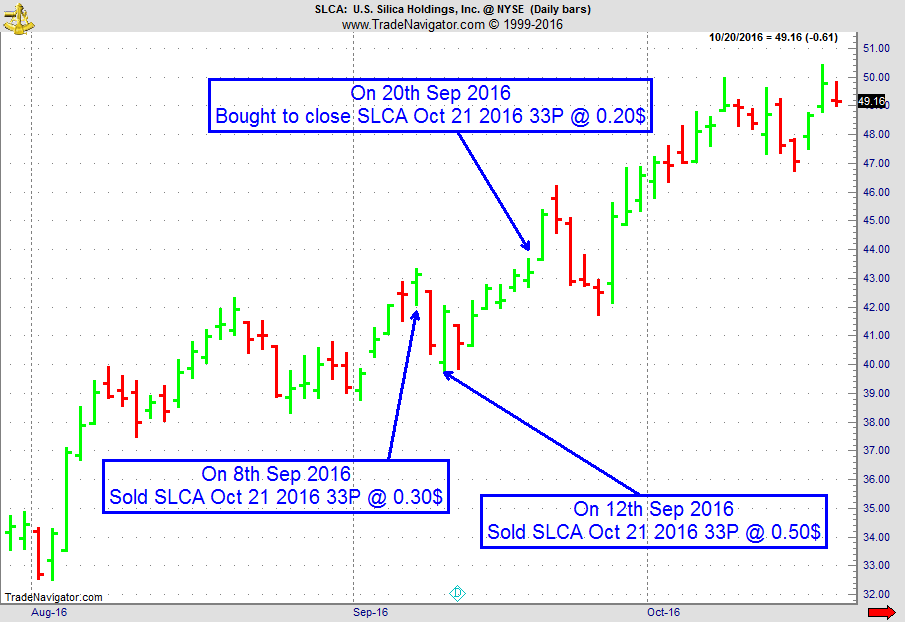
On 7th September 2016, we gave our IIG subscribers the following trade on SLCA, which was showing strong accumulation. We decided to sell price insurance as follows, in 2 equal steps:
- On 8th September 2016, we sold to open SLCA Oct 21 2016 33P @ $0.30, i.e. 30$ per option sold, with 43 days to expiration, and our short strike well below a major support zone.
- On 12th September 2016,we sold to open SLCA Oct 21 2016 33P @ $0.50 on a good till cancelled order.
- On 20th September 2016, we bought to close SLCA Oct 21 2016 33P @ $0.20, after 10 days in the trade, for quick premium compounding.
Profit (average): $20
Margin: $660
Return on Margin Annualized: 110.61%
We have also added new types of trades for our IIG daily guidance, "no loss" propositions with unlimited upside potential, still using other people's money to trade.
Philippe
Instant Income Guaranteed
♦ SIGN UP TODAY! THIS IS WORTH THE INVESTMENT ♦
This includes a daily 80+ page report along with a daily podcast!
© by Joe Ross and Philippe Gautier. Re-transmission or reproduction of any part of this material is strictly prohibited without the prior written consent of Trading Educators, Inc.
Traders Notebook Outright Futures Trading
by Master Trader Andy Jordan
Educator for Spreads, Options, Swing/Day Trading, and Editor of Traders Notebook Complete and Traders Notebook Outrights
Traders Notebook Outrights gives you high probablity trades that are hand-picked for optimum results. If you are a futures swing trader looking for real trades while learning the correct way to place stops and the art of trade management, this is for you.
Traders Notebook Outright Guide explains the Outright trading service from Trading Educators. It shows you around on the Outright Campus, and how to use the information provided by the service.
© by Andy Jordan. Re-transmission or reproduction of any part of this material is strictly prohibited without the prior written consent of Trading Educators, Inc.
This Week's Blog Post: Overconfidence
by Master Trader Andy Jordan
Educator for Spreads, Options, Swing/Day Trading, and Editor of Traders Notebook Complete and Traders Notebook Outrights
When traders are hot and seemingly cannot lose. When they make several trades that perform exceedingly well, there is a surge of human pride. They feel like...read more.
© by Andy Jordan. Re-transmission or reproduction of any part of this material is strictly prohibited without the prior written consent of Trading Educators, Inc.
Golden October for AlgoStrats:FX
by Master Trader Marco Mayer
Educator for Forex and Futures, Systematic Trader, and
Creator of Ambush Trading Method and AlgoStrats.com
Marco Mayer and his subscribers had a great trading month in October. The AlgoStrats:FX Live Trading account gained about +4% with a very low target risk of 0.5% per trade. This was possible thanks to a winning rate of about 85% while having a profit to loss ratio of about 2:1 at the same time. Sounds awesome? We think so too, especially considering we're trading just once each day and usually are done trading within 2-3 minutes.
Don't forget this happened not just on some spreadsheet with some numbers on it or on a simulated account, but on a real money account that is fully transparent to all AlgoStrats:FX subscribers.
To learn more, here's a video where Marco walks you through the recent performance of AlgoStrats:FX:
© by Marco Mayer. Re-transmission or reproduction of any part of this material is strictly prohibited without the prior written consent of Trading Educators, Inc.
Check out our Blog!
To view previous published Chart Scan newsletters, please log in or click on "Join Us,"
shown above, to subscribe to our free "Members Only" section.
A WEALTH OF INFORMATION & EDUCATION:
Joe Ross-Trading Educators' popular free Chart Scan Newsletter has been published since 2004.
Note: Unless otherwise noted, all charts used in Chart Scan commentary were created
by using Genesis Financial Technologies' Trade Navigator (with permission).
Legal Notice and Copyright 2016 Disclaimer - Published by Trading Educators, Inc.
Chart Scan is a complimentary educational newsletter.
© by Trading Educators, Inc. Re-transmission or reproduction of any part of this material is strictly prohibited without prior written consent.
Edition 646 - October 28, 2016
Let's be real. How many times have you encountered failed promises to "get rich quick" with your trading, and have taken huge hits to your bank account? Well, you won't find that here. Our philosophy is very clear and concise:
"Teach our students the truth in trading - teach them how to trade," and "Give them a way to earn while they learn - realizing that it takes TIME to develop a successful trader."
Invest in yourself today! Private tutoring is available with any of our three professional traders. Ask them the difficult questions, revise your trading plan, or whatever you feel that needs extra attention taking you to your next level of trading.
The Law of Charts with Commentary
by Master Trader Joe Ross
Author, Trader, Trading Mentor, and Founder of Trading Educators, Inc.
Trading Tops and Bottoms
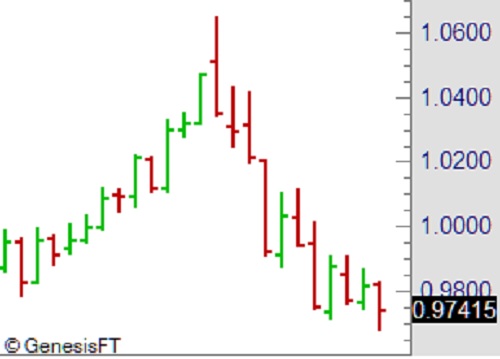
How do you trade markets that form "V" bottoms, or for that matter, "A" tops. The method I usually follow causes me to miss the first part of the move, but I feel that with "V" bottoms and "A" tops it is better to be safe than sorry. Typically, when prices form sharply-turned bottoms and tops, the move is considerable once it becomes established. Such was the case shown on the chart below. I've pointed out on the chart the way my method would allow me entry into the trade. It follows the rules for the Law of Charts. The Law states that the breakout of the #2 point of a 1-2-3 low defines a trend; a breakout of a Ross Hook establishes a trend.
Prices formed a potential #2 point at .7342. The pattern then corrected, but not enough to establish the #2 point. A #2 point by definition requires both a lower high and a lower low to form before a #2 point is in effect. Prices moved to .7343 where, by definition of both a lower low and a lower high following the move to .7343, there was a defined #2 point. Prices then made a higher low and a higher high, putting into effect the #3 point. Two bars later, a Ross hook was formed when prices failed to move higher. A Traders Trick Entry was in effect at .7459, leaving plenty of room to cover costs and take a profit. The rest is history, and it seemed that prices would soon arrive at .8000.
© by Joe Ross. Re-transmission or reproduction of any part of this material is strictly prohibited without the prior written consent of Trading Educators, Inc.
Question from a Subscriber:
by Master Trader Joe Ross
Author, Trader, Trading Mentor, and Founder of Trading Educators, Inc.
A reader asks: "Hey Joe! I’m pretty new at this. Can you tell me the rules for buy and sell stops?"
When the market trades above (“trades through”) a buy stop price order, it becomes a market order. The first down tick after the market order price is activated determines the highest price at which the buy stop order may be filled. The rule to remember placing stops is this, "Buy above and sell below." Buy stops are placed above the current market price, and sell stops are placed below the current market price. If a buy stop price is hit, the order then becomes a market order to be filled electronically or by the floor broker at the best price possible. If a buy stop is hit at 40, and the market trades 40, 45, 50, then 45, the worst fill a trader can receive is a 50, because 45 is the first down tick. In general, you must expect to get the worst fill possible. Anything better is a bonus. The exception to this rule is a fast market condition, when no one is legally held to any price.
© by Joe Ross. Re-transmission or reproduction of any part of this material is strictly prohibited without the prior written consent of Trading Educators, Inc.
SLB TRADE
Instant Income Guaranteed
Developer: Joe Ross
Administration and New Developments: Philippe Gautier
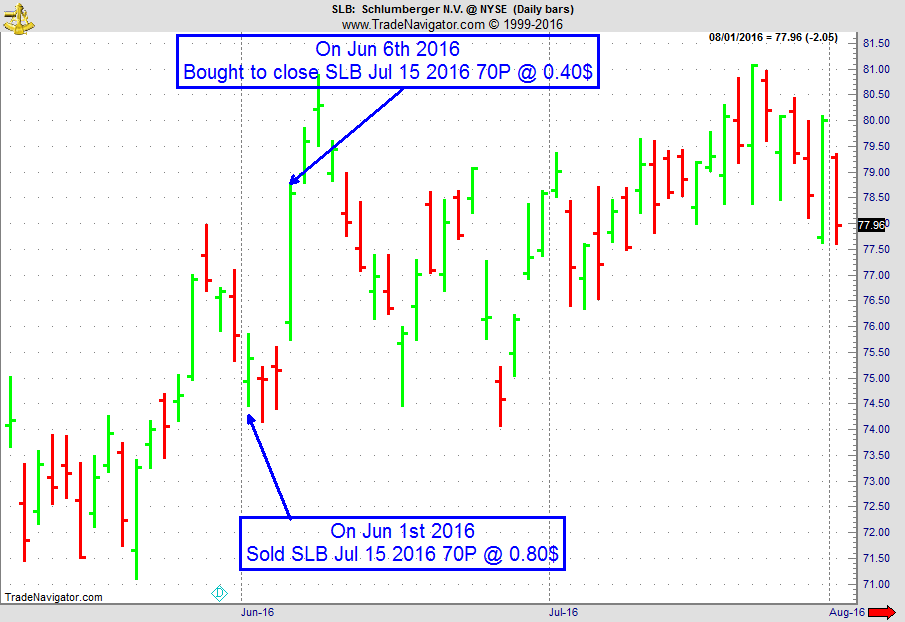
On 31st May 2016, we gave our IIG subscribers the following trade on SLB, which was showing accumulation on a pullback. We decided to sell price insurance as follows the following day:
- On 1st June 2016, we sold to open SLB Jul 15 2016 70P @ $0.80, i.e. $80 per option sold, with 44 days to expiration, and our short strike below a major support zone.
- On 6th June 2016, we bought to close SLB Jul 15 2016 70P @ $0.40, after 6 days in the trade, for quick premium compounding.
Profit: $40
Margin: $1,400
Return on Margin Annualized: 208.57%
We have also added new types of trades for our IIG daily guidance, "no loss" propositions with unlimited upside potential, still using other people's money to trade.
Philippe
Receive daily trade recommendations - we do the research for you!
Instant Income Guaranteed
♦ SIGN UP TODAY! THIS IS WORTH THE INVESTMENT ♦
This includes a daily 80+ page report along with a daily podcast!
We review and supply the following:
-
our daily fills (entries, exits)
-
full real-time statistics of our weekly trades, closed trades for the current month, monthly statistics (detail and summary) since the beginning of IIG
-
daily market commentary (indices/sectors, volatility indices, main commodities related to our trade)
-
new trades for the following day
-
comments on our open trades, with all relevant news
-
updated earnings dates for our open positions
-
full details (days in trade, days to expiration, underlying close and price change, etc.) on our open trades (classic trades, complex positions, remaining rolled trades and covered calls)
-
active good till cancelled orders
-
dividends for the stocks owned
We also supply quite a number of extra "slides" in the appendix which are quite useful for new subscribers: recommendations, answers and explanations on the most frequent questions, techniques for entering trades, historical trades and real life examples, broker information, etc.
© by Joe Ross and Philippe Gautier. Re-transmission or reproduction of any part of this material is strictly prohibited without the prior written consent of Trading Educators, Inc.
by Master Trader Andy Jordan
Educator for Spreads, Options, Swing/Day Trading, and Editor of Traders Notebook Complete and Traders Notebook Outrights
Andy is looking into the seasonal Feeder Cattle spread long May and short March 2017.
Traders Notebook Outright Futures Trading
by Master Trader Andy Jordan
Educator for Spreads, Options, Swing/Day Trading, and Editor of Traders Notebook Complete and Traders Notebook Outrights
If you are interested in outright futures short term swing trading, you should check out our new service Traders Notebook Outrights.
Traders Notebook Outright Guide explains the Outright trading service from Trading Educators. It shows you around on the Outright Campus and how to use the information provided by the service.
© by Andy Jordan. Re-transmission or reproduction of any part of this material is strictly prohibited without the prior written consent of Trading Educators, Inc.
Blog Post - Time
by Master Trader Andy Jordan
Educator for Spreads, Options, Swing/Day Trading, and Editor of Traders Notebook Complete and Traders Notebook Outrights
You pay a price for every profit you take with time and effort required to obtain it. Not to mention the years of experience upon which your knowledge and system methodology have...read more.
© by Andy Jordan. Re-transmission or reproduction of any part of this material is strictly prohibited without the prior written consent of Trading Educators, Inc.
This Week's Blog- FOMC Days = Crazy Days?
by Master Trader Marco Mayer
Educator for Forex and Futures, Systematic Trader, and
Creator of Ambush Trading Method and AlgoStrats.com
This Tuesday, we'll have another Federal Open Market Committee (FOMC) day. Whenever the FOMC meets and releases its rate decision and its statement, it’s seen as one of the most important data releases in the markets in the currency markets. But is it really such a market mover? What kind of moves can we actually expect on such a day? Well, let's find out and look at some statistics! Read more.
© by Marco Mayer. Re-transmission or reproduction of any part of this material is strictly prohibited without the prior written consent of Trading Educators, Inc.
Check out our Blog!
To view previous published Chart Scan newsletters, please log in or click on "Join Us,"
shown above, to subscribe to our free "Members Only" section.
A WEALTH OF INFORMATION & EDUCATION:
Joe Ross-Trading Educators' popular free Chart Scan Newsletter has been published since 2004.
Note: Unless otherwise noted, all charts used in Chart Scan commentary were created
by using Genesis Financial Technologies' Trade Navigator (with permission).
Legal Notice and Copyright 2016 Disclaimer - Published by Trading Educators, Inc.
Chart Scan is a complimentary educational newsletter.
© by Trading Educators, Inc. Re-transmission or reproduction of any part of this material is strictly prohibited without prior written consent.
More...
Edition 645 - October 21, 2016
We offer different trading advisories for a variety of markets, so enhance your trading style today! Check them out to find your best fit.
Instant Income Guaranteed - Stock Options
Traders Notebook Complete - Futures, Options, and Spread Trades
Traders Notebook Outrights - Futures
The Law of Charts with Commentary
by Master Trader Joe Ross
Author, Trader, Trading Mentor, and Founder of Trading Educators, Inc.
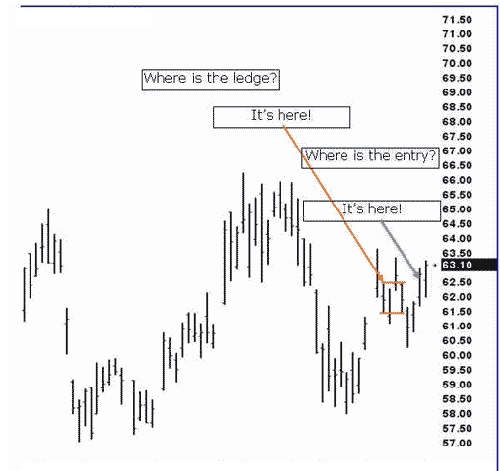
Where’s the Ledge?
I received a chart with a question: "Where is the ledge?" Below you see the chart with the ledge as I drew it. In order to understand the concept, you have to know how a ledge is defined within The Law of Charts. A ledge comes when prices are trending or swinging. It consists of 4 to 10 bars and has two matching or close to matching highs and two matching or close to matching lows. There must be at least 1 price bar between each of the matches. In the case below there were two bars between the matches. Entry is made when prices breakout in the direction of the most recent swing or trend. Entry was 1-tick above the high of the ledge as shown by the dark arrow. The swing in this case was up from approximately 58.00 to between 63.50-64.00.
© by Joe Ross. Re-transmission or reproduction of any part of this material is strictly prohibited without the prior written consent of Trading Educators, Inc.
Question from a Subscriber:
"Have you ever felt as if the more you know, the less you know, and the more you become confused? Why is this?"
by Master Trader Joe Ross
Author, Trader, Trading Mentor, and Founder of Trading Educators, Inc.
People have the tendency to believe that the accuracy of their forecasts increases with more information. This is the illusion of knowledge – that more information increases your knowledge about something and improves your decisions. However, this is not always the case. Increased levels of information do not necessarily lead to greater knowledge. There are three reasons for this. First, some information does not help us make predictions and can even mislead us. Second, many people may not have the training, experience, or skills to interpret the information. And, finally, people tend to interpret new information as confirmation of their prior beliefs.
Let me give you an example of how too much information can lead to a paralysis of confusion.
I met a man who was an avid student of the teachings of W.D. Gann. Gann believed in the movement of prices along a 45 degree angle. He also believed that time intervals of 3, 5, 9, and others had great importance. So the man I knew created moving averages of 3-bars, 5-bars, 9-bars and multiples thereof. Of course, 3 x 9 equals 27 and so he kept 27 bar moving averages. 5 x 9 is 45, and so he also kept 45 bar moving averages. He also watched 135-bar moving averages (3x45) and others. He looked for agreement among all of these moving averages, which of course, led to great confusion, since it was rare indeed and most likely coincidental when all of the moving averages showed some sort of agreement (confluence). So this man suffered greatly from paralysis of analysis. He simply had too much information, and he was unable to pull the trigger on a trade.
I will never forget the statement he made to me: “Joe, I know so much. Why then is it that I never seem to be making money?”
I think from the above description you should be able to figure it out, just as I did.
© by Joe Ross. Re-transmission or reproduction of any part of this material is strictly prohibited without the prior written consent of Trading Educators, Inc.
WYNN TRADE
Instant Income Guaranteed
Developer: Joe Ross
Administration and New Developments: Philippe Gautier
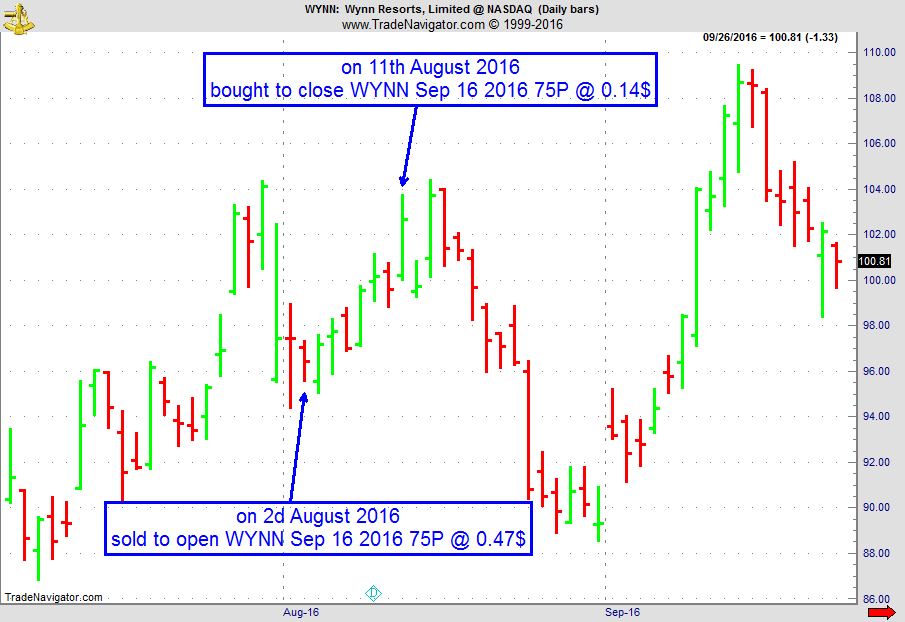
On 1st August 2016, we gave our IIG subscribers the following trade on WYNN, which was showing accumulation on a pullback. We decided to sell price insurance as follows the following day:
- On 2nd August 2016, we sold to open WYNN Sep 16 2016 75P @ $0.47, i.e. $47 per option sold, with 44 days to expiration, and our short strike 23% below price levels when we gave the trade, making it pretty safe.
- On 11th August 2016, we bought to close WYNN Sep 16 2016 75P @ $0.14, after 9 days in the trade, for quick premium compounding.
Profit: $33
Margin: $1,500
Return on Margin Annualized: 89.22%
We have also added new types of trades for our IIG daily guidance, "no loss" propositions with unlimited upside potential, still using other people's money to trade.
Philippe
Receive daily trade recommendations - we do the research for you!
Instant Income Guaranteed
♦ SIGN UP TODAY! THIS IS WORTH THE INVESTMENT ♦
This includes a daily 80+ page report along with a daily podcast!
We review and supply the following:
-
our daily fills (entries, exits)
-
full real-time statistics of our weekly trades, closed trades for the current month, monthly statistics (detail and summary) since the beginning of IIG
-
daily market commentary (indices/sectors, volatility indices, main commodities related to our trade)
-
new trades for the following day
-
comments on our open trades, with all relevant news
-
updated earnings dates for our open positions
-
full details (days in trade, days to expiration, underlying close and price change, etc.) on our open trades (classic trades, complex positions, remaining rolled trades and covered calls)
-
active good till cancelled orders
-
dividends for the stocks owned
We also supply quite a number of extra "slides" in the appendix which are quite useful for new subscribers: recommendations, answers and explanations on the most frequent questions, techniques for entering trades, historical trades and real life examples, broker information, etc.
© by Joe Ross and Philippe Gautier. Re-transmission or reproduction of any part of this material is strictly prohibited without the prior written consent of Trading Educators, Inc.
The Whipsaw Song by Trading Tribe
by Master Trader Andy Jordan
Educator for Spreads, Options, Swing/Day Trading, and Editor of Traders Notebook Complete and Traders Notebook Outrights
Once in a while I stumble over a nice article, video or any other source of information about trading on the internet that I would like to share with all of you.
I found this video a long time ago and honestly, I like it a lot. It is fun to watch and the rules mentioned in the video are very simple to follow, and explains what a trader really needs. I’ve tried many different ways in trading, but I always coming back to the simple things because this is what works best for me. Using a simple strategy does not allow me to “doubt” on my entries. I do not have to re-think where to enter, where to put my stop, and where to take profits. For me, simple is GOOD.
Enjoy the video!
Traders Notebook Outright Futures Trading
by Master Trader Andy Jordan
Educator for Spreads, Options, Swing/Day Trading, and Editor of Traders Notebook Complete and Traders Notebook Outrights
If you are interested in outright futures short term swing trading, you should check out our new service Traders Notebook Outrights.
Traders Notebook Outright Guide explains the Outright trading service from Trading Educators. It shows you around on the Outright Campus and how to use the information provided by the service.
© by Andy Jordan. Re-transmission or reproduction of any part of this material is strictly prohibited without the prior written consent of Trading Educators, Inc.
This Week's Blog - Waiting for Confirmation? Don’t wait too long!
by Master Trader Marco Mayer
Educator for Forex and Futures, Systematic Trader, and
Creator of Ambush Trading Method and AlgoStrats.com
In his newest article, Marco writes about why waiting for the confirmation of a trading idea often comes at a high price. Read more.
© by Marco Mayer. Re-transmission or reproduction of any part of this material is strictly prohibited without the prior written consent of Trading Educators, Inc.
Check out our Blog!
To view previous published Chart Scan newsletters, please log in or click on "Join Us,"
shown above, to subscribe to our free "Members Only" section.
A WEALTH OF INFORMATION & EDUCATION:
Joe Ross-Trading Educators' popular free Chart Scan Newsletter has been published since 2004.
Note: Unless otherwise noted, all charts used in Chart Scan commentary were created
by using Genesis Financial Technologies' Trade Navigator (with permission).
Legal Notice and Copyright 2016 Disclaimer - Published by Trading Educators, Inc.
Chart Scan is a complimentary educational newsletter.
© by Trading Educators, Inc. Re-transmission or reproduction of any part of this material is strictly prohibited without prior written consent.
Edition 644 - October 14, 2016
Don't be alone on your trading journey. We are here for you. Let us educate, guide, and improve your existing trading style. If you're new to the business, then you have found the right place!
The Law of Charts with Commentary
by Master Trader Joe Ross
Author, Trader, Trading Mentor, and Founder of Trading Educators, Inc.
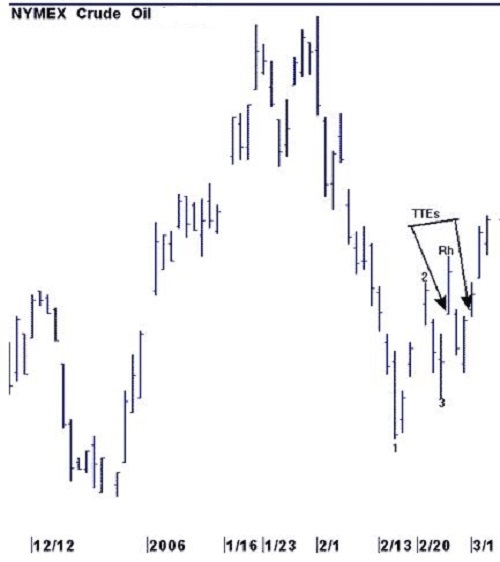
CRUDE OIL
At the time I wrote this issue of Chart Scan crude oil was leaping higher. Where it will be by the time you get this issue of Chart Scan, I have no idea, but it's a good example.
The question I received was, "Is it okay to take gap open entries on Traders Tricks?" The only honest answer is take a look at the market to see if they usually work in that particular market. Based on what we can see on the crude oil chart, I would have to say it's worth taking a shot at it. Surely on both TT entries there was plenty of room to cover costs and take a profit. Both entries filled my requirement that I get paid to trade, and get a free trade while I'm at it.
© by Joe Ross. Re-transmission or reproduction of any part of this material is strictly prohibited without the prior written consent of Trading Educators, Inc.
Here are two ways to know when prices are getting ready to break out from a trading range.
by Master Trader Joe Ross
Author, Trader, Trading Mentor, and Founder of Trading Educators, Inc.
When prices are in a trading range, count the number of closes above or below a specific price near the vertical mid-level of the trading range. If 70% of the closes are above the mid-level price, and the market cannot rally and close above reaction highs, a severe correction may be imminent. If prices break and cannot close below reaction lows, expect a rally to carry prices above the reaction highs. E.g. Let’s assume that a futures chart is showing that about 90% of the Closes are above 445.00, yet prices cannot Close above 455.00. If prices finally do Close above 455.00, a strong buy signal would then be in place.
Another way to determine that prices are about to break out of a trading range is to note if you have a 1-2-3 followed by a Ross hook within the trading range. If both are present, the percentages favor a breakout to follow, and entry by way of a TTE is acceptable.
A 1-2-3 formation followed by a Ross hook is a consistent objective chart pattern for defining that a trend or swing is in process. Once the point of the Ross hook has been violated, this pattern is enough to establish that a trend or swing does exist.
© by Joe Ross. Re-transmission or reproduction of any part of this material is strictly prohibited without the prior written consent of Trading Educators, Inc.
MON TRADE
Instant Income Guaranteed
Developer: Joe Ross
Administration and New Developments: Philippe Gautier
On 6th April 2016 we gave our IIG subscribers the following trade on MON, which showed high premium with short strikes above support levels and buying activity. We decided to sell price insurance as follows the following day:
- On 7th April 2016, we sold to open MON May 20 2016 82.5P @ $1.30, i.e. $130 per option sold, with 43 days to expiration, and our short strike right at a major support level;
- On 19th April 2016, we bought to close MON May 20 2016 82.5P @ $0.65, after 12 days in the trade, for quick premium compounding.
Profit: $65
Margin: $1,650
Return on Margin Annualized: 119.82%
We have also added new types of trades for our IIG daily guidance, "no loss" propositions with unlimited upside potential, still using other people's money to trade.
Philippe
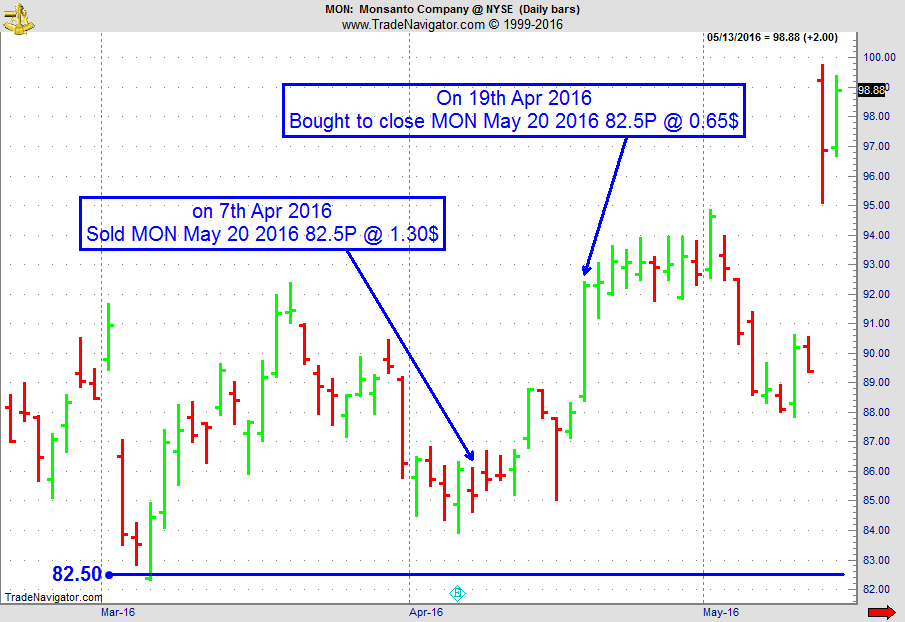
Receive daily trade recommendations - we do the research for you!
Instant Income Guaranteed
♦ SIGN UP TODAY! THIS IS WORTH THE INVESTMENT ♦
This includes a daily 80+ page report along with a daily podcast!
We review and supply the following:
-
our daily fills (entries, exits)
-
full real-time statistics of our weekly trades, closed trades for the current month, monthly statistics (detail and summary) since the beginning of IIG
-
daily market commentary (indices/sectors, volatility indices, main commodities related to our trade)
-
new trades for the following day
-
comments on our open trades, with all relevant news
-
updated earnings dates for our open positions
-
full details (days in trade, days to expiration, underlying close and price change, etc.) on our open trades (classic trades, complex positions, remaining rolled trades and covered calls)
-
active good till cancelled orders
-
dividends for the stocks owned
We also supply quite a number of extra "slides" in the appendix which are quite useful for new subscribers: recommendations, answers and explanations on the most frequent questions, techniques for entering trades, historical trades and real life examples, broker information, etc.
© by Joe Ross and Philippe Gautier. Re-transmission or reproduction of any part of this material is strictly prohibited without the prior written consent of Trading Educators, Inc.
This Week's Blog Post - Don't Let Your Emotions Influence Your Decisions in Trading
by Master Trader Andy Jordan
Educator for Spreads, Options, Swing/Day Trading, and Editor of Traders Notebook Complete and Traders Notebook Outrights
Trading is nothing more than a long, random statistical run. An experienced trader knows that even if he is in a losing streak right now, as long as he sticks to his already approved trading plan, he will come out a winner in the long run. Read more.
Traders Notebook Outright Futures Trading
by Master Trader Andy Jordan
Educator for Spreads, Options, Swing/Day Trading, and Editor of Traders Notebook Complete and Traders Notebook Outrights
If you are interested in outright futures short term swing trading, you should check out our new service Traders Notebook Outrights.
Traders Notebook Outright Guide explains the Outright trading service from Trading Educators. It shows you around on the Outright Campus and how to use the information provided by the service.
© by Andy Jordan. Re-transmission or reproduction of any part of this material is strictly prohibited without the prior written consent of Trading Educators, Inc.
Why Entry Signals are Important and How to Test Them
by Master Trader Marco Mayer
Educator for Forex and Futures, Systematic Trader, and
Creator of Ambush Trading Method and AlgoStrats.com
In his new video Marco talks about why he believes Entry Signals are the most important aspect of a trading strategy. He then shows you how he likes to "prototype"-test entry signals and why it's important to do so.
© by Marco Mayer. Re-transmission or reproduction of any part of this material is strictly prohibited without the prior written consent of Trading Educators, Inc.
Check out our Blog!
To view previous published Chart Scan newsletters, please log in or click on "Join Us,"
shown above, to subscribe to our free "Members Only" section.
A WEALTH OF INFORMATION & EDUCATION:
Joe Ross-Trading Educators' popular free Chart Scan Newsletter has been published since 2004.
Note: Unless otherwise noted, all charts used in Chart Scan commentary were created
by using Genesis Financial Technologies' Trade Navigator (with permission).
Legal Notice and Copyright 2016 Disclaimer - Published by Trading Educators, Inc.
Chart Scan is a complimentary educational newsletter.
© by Trading Educators, Inc. Re-transmission or reproduction of any part of this material is strictly prohibited without prior written consent.
Edition 643 - October 7, 2016
Experienced traders find time to work and play. If you're not at the level you desire, don't waste another day, contact us for help.
The Law of Charts with Commentary
by Master Trader Joe Ross
Author, Trader, Trading Mentor, and Founder of Trading Educators, Inc.
GAPS
“Hey Joe, I noticed that when I look at older charts as presented in books and historical data, I see a lot of gaps. There doesn’t seem to be so many these days. Can you explain?”
Prior to extended hour trading, prices would have lots of hours between trading sessions. As an example let’s look at a weekly gold chart. Gold traded at the Comex Exchange between the hours of 7:20AM US Central Time and 1:15PM, almost 6 hours.
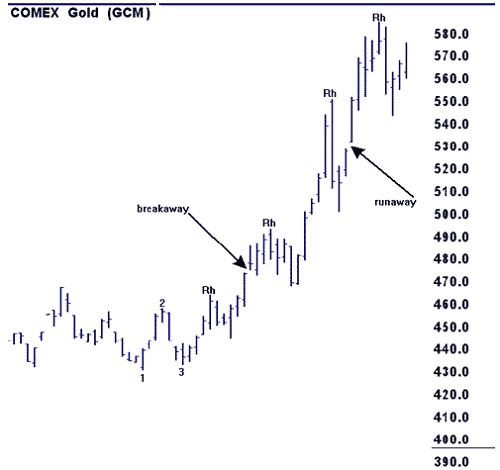
However, people traded in gold for 24 hours—leaving 18 hours during which gold prices moved. The move in prices was reflected at the Open. There were many gaps, even on weekly charts as shown above. Gaps were so significant they even had names. The first gap out of consolidation was called a “breakaway” gap. If prices continued to rise, the next gap was called a “runaway” gap. At some point prices would make one last effort to move higher. That last effort often resulted in a final gap opening called an “exhaustion gap.”
With extended trading hours it is a rare week that will show any kind of gap at all in a futures market. Daily gaps have also become uncommon. However, daily chart gaps are still frequently seen in the stock market. There is a premarket and an aftermarket in stocks, but not a lot of price movement takes place during those hours.
© by Joe Ross. Re-transmission or reproduction of any part of this material is strictly prohibited without the prior written consent of Trading Educators, Inc.
Question from a Subscriber
by Master Trader Joe Ross
Author, Trader, Trading Mentor, and Founder of Trading Educators, Inc.
"I just want to be prepared for the next legal holiday. I’ve been basically a Dow investor for years and now I've begun trading the Dow futures. Do you have any information about the Dow Industrial Average relative to legal holidays in the U.S?"
Thanks to Yale Hirsch’s excellent "Stock Traders Almanac" for the following: “The Dow closes higher before one day holidays 67% of the time, and three day holidays 75% of the time. It closes on Friday greater than Thursday 57% of the time, but when Friday closes weaker than Thursday, it also closes lower on Monday 73% of the time. This study was based over 100 years’ research.”
If anyone knows where you can still get a copy of the almanac, please let me know. I have the above information only in my notes.
© by Joe Ross. Re-transmission or reproduction of any part of this material is strictly prohibited without the prior written consent of Trading Educators, Inc.
Read Joe's latest blog, "In and around Uruguay" to find out how he spends his free time away from trading.

TAP TRADE
Instant Income Guaranteed
Developer: Joe Ross
Administration and New Developments: Philippe Gautier
On 5th September 2016, we gave our IIG subscribers the following trade on TAP, which showed high premium levels at distant short strikes in a low volatility environment. We decided to sell price insurance as follows the following day:
- On 6th September 2016, we sold TAP October 21 2016 85P @ $0.85, ie. $85 per option sold, with 45 days to expiration, and our short strike 18% below price action;
- On 28th September 2016, we bought to close TAP October 21 2016 85P @ $0.30, after 23 days in the trade
Profit: $55
Margin: $1,700
Return on Margin Annualized: 51.34%
We have also added new types of trades for our IIG daily guidance, "no loss" propositions with unlimited upside potential, still using other people's money to trade.
Philippe
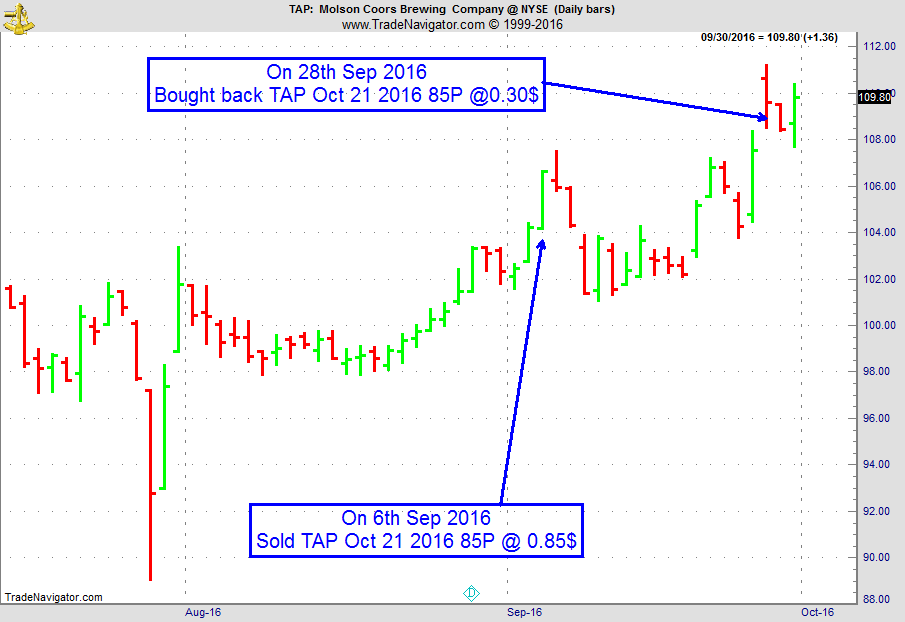
Receive daily trade recommendations - we do the research for you!
Instant Income Guaranteed
♦ SIGN UP TODAY! THIS IS WORTH THE INVESTMENT ♦
This includes a daily 80+ page report along with a daily podcast!
We review and supply the following:
-
our daily fills (entries, exits)
-
full real-time statistics of our weekly trades, closed trades for the current month, monthly statistics (detail and summary) since the beginning of IIG
-
daily market commentary (indices/sectors, volatility indices, main commodities related to our trade)
-
new trades for the following day
-
comments on our open trades, with all relevant news
-
updated earnings dates for our open positions
-
full details (days in trade, days to expiration, underlying close and price change, etc.) on our open trades (classic trades, complex positions, remaining rolled trades and covered calls)
-
active good till cancelled orders
-
dividends for the stocks owned
We also supply quite a number of extra "slides" in the appendix which are quite useful for new subscribers: recommendations, answers and explanations on the most frequent questions, techniques for entering trades, historical trades and real life examples, broker information, etc.
© by Joe Ross and Philippe Gautier. Re-transmission or reproduction of any part of this material is strictly prohibited without the prior written consent of Trading Educators, Inc.
Traders Notebook Outright Futures Trading
by Master Trader Andy Jordan
Educator for Spreads, Options, Swing/Day Trading, and Editor of Traders Notebook Complete and Traders Notebook Outrights
Today I will show you a trade from the other day with our new service. As you can see below, we were looking for a few entries in several markets.
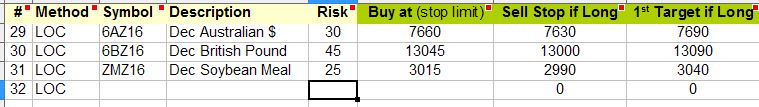
We were filled in the long Soybean Meal trade at 301.5 with an initial stop at 299.0 (the risk was $250 per contract traded). During the overnight session the market moved a bit, but everything was very quiet. At the open of the day session the market moved strongly lower but we were happy of not getting stopped out of the trade. Only ½ hour later the market was back up to our entry level and it climbed higher all day long. We took firsts profit at 304.0, then at 306.4 and finally at 308.3 as you can see on the daily chart below.
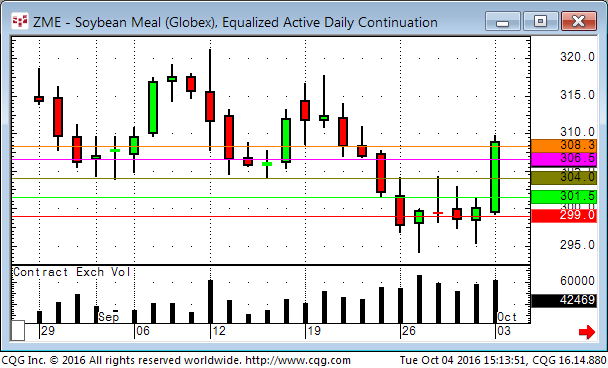
If you are interested in outright futures short term swing trading, you should check out our new service Traders Notebook Outrights.
Traders Notebook Outright Guide explains the Outright trading service from Trading Educators. It shows you around on the Outright Campus and how to use the information provided by the service.
© by Andy Jordan. Re-transmission or reproduction of any part of this material is strictly prohibited without the prior written consent of Trading Educators, Inc.
The Forex Trump Trade & Synthetic FX Pairs
by Master Trader Marco Mayer
Educator for Forex and Futures, Systematic Trader, and
Creator of Ambush Trading Method and AlgoStrats.com
In the Forex world, the RUB/MXN cross has become known as the Trump Trade. But is it really? And how would you trade it if your broker doesn't offer that pair? If you'd like to know or ever wondered what synthetic Forex pairs are and how to create them, check out Marco's latest article on our blog! Read more.
© by Marco Mayer. Re-transmission or reproduction of any part of this material is strictly prohibited without the prior written consent of Trading Educators, Inc.
Check out our Blog!
To view previous published Chart Scan newsletters, please log in or click on "Join Us,"
shown above, to subscribe to our free "Members Only" section.
A WEALTH OF INFORMATION & EDUCATION:
Joe Ross-Trading Educators' popular free Chart Scan Newsletter has been published since 2004.
Note: Unless otherwise noted, all charts used in Chart Scan commentary were created
by using Genesis Financial Technologies' Trade Navigator (with permission).
Legal Notice and Copyright 2016 Disclaimer - Published by Trading Educators, Inc.
Chart Scan is a complimentary educational newsletter.
© by Trading Educators, Inc. Re-transmission or reproduction of any part of this material is strictly prohibited without prior written consent.
Edition 641 - September 23, 2016
“Destruction will come to the Traders of iniquity.” Master Trader Joe Ross
The Law of Charts with Commentary
by Master Trader Joe Ross
Author, Trader, Trading Mentor, and Founder of Trading Educators, Inc.
BOND TRADING
Someone asked me recently, "Can you trade the T-Bonds with cluster breakouts? Can I use the same technique you have in your 'Day Trading' book?"
The answer to the first question is "Yes!" You can trade the T-Bonds with cluster breakouts. The answer to the second question is "No," T-Bonds are a different market with different movement. You would have to make some sort of adjustment to your objectives and to your exit points. In other words, you would have to change your management.
To tell the truth, I've never tried trading T-Bonds on cluster breakouts. Certainly, you would have to do the trading only when T-Bonds were making swings or trends on the daily chart. It would not be something I would try to do every day. I think it would be murder to trade bonds with cluster breakouts when the market was going sideways.
Here's the 60-minute T-Bond chart at a time the daily chart was trending. You be the judge.
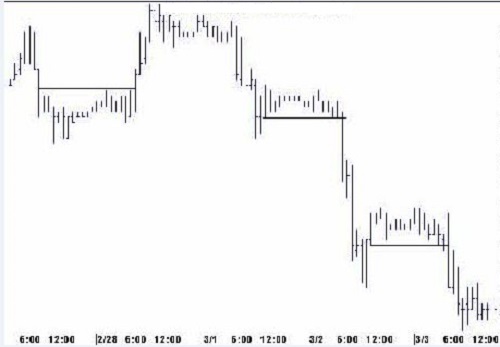
© by Joe Ross. Re-transmission or reproduction of any part of this material is strictly prohibited without the prior written consent of Trading Educators, Inc.
Some thoughts about trading
by Master Trader Joe Ross
Author, Trader, Trading Mentor, and Founder of Trading Educators, Inc.
I’ve been asked many times: “Is there any meaning in trading? Does it serve a purpose? Does it produce anything of value to anyone?”
Those are good questions, and ones that I have frequently thought about over the years.
When I first began trading futures, a fair number of contracts actually ended up in a delivery — certainly more than we see today. Today only 3% of contracts result in delivery.
The economic and social justification for the futures markets is to provide a venue in which producers and users can hedge against excessive fluctuations in price. Price stability within the economy is seen as a desirable thing, and so it is. In effect, the hedger is seeking price insurance, and the speculator provides the insurance policy.
With hedging as its justification, speculation in futures serves as a way of providing liquidity, efficiency, and price discovery. The speculator serves as the person who is willing to take the risk the hedger wants to avoid. Without that justification, trading futures is nothing more than outright speculation.
Put options in the stock market provide the same thing by enabling an investor insurance against falling stock prices.
However, it is difficult to see how trading from a 1, 3, or 5-minute chart meets the criteria for providing liquidity and price discovery for the hedger. Does a producer or consumer need to hedge for only 1 minute? It is hard to argue on the basis of short-term intraday trading, that anyone is actually providing a social or economic benefit of any kind, other than to another day trader.
Whereas with longer-term trading it is easy to see the social and economic benefits provided by the speculator, or investor, it is virtually impossible to see that such benefits are derived from short-term trading. That renders day trading as nothing more than speculating. To that extent, the markets may have become giant gambling casinos.
That raises a question: What is the difference between the gambler and the speculator? True speculation is based on taking advantage of the realities of the market. Gambling is an attempt at trying one's luck.
Since trading is a business, the business-like speculator is willing to accept the risk of price fluctuation in return for the greater leverage that comes with that risk in the hopes of earning substantial profits. The business-like speculator makes his trading decisions based on knowledge gathered from information about the behavior of the underlying: Research, financial analysis, seasonality, historical and current trends, chart analysis, fundamentals, the market dynamics, and knowledge of those who trade it.
What about the gambler? How does he make his decisions?
The gambler makes his trading decisions on gut feelings, hopes, dreams of getting rich quick, tips from the broker, “inside information” from friends, opinions uttered in the financial news media, and from the improper understanding and use of indicators, oscillators, moving averages, and mechanical trading systems. In general, he is looking for a way to shortcut having to truly learn what is going on. He or she is in a hurry to make money. Unfortunately, most people who attempt to trade fall into this category. Many wannabe traders are gambling, and they don’t even realize it. Anyone who attempts to trade without essential knowledge of what the markets are all about and how they truly function, is gambling.
There is one more aspect to this subject. It has to do with morality. I am often asked if trading goes against the teachings of the Bible. Is it a sin to trade? Is it a sin to speculate in the markets? I have been asked this question numerous times even by church pastors. A friend of mine said it this way: “You did not pay to be born. Life is a gift that was freely given to you. The ways in which you repay God for your life is by using your natural talents to the best of your ability and constantly creating positive change in your life and the lives of others. This quest fulfills the meaning of life, to make the world a better place because you were here. What are your talents and abilities? What is the most important goal in your life? How do you exercise your talent on a regular basis to achieve that goal? How are you creating positive changes in your life and the lives of others? What is the legacy you will leave behind to show mankind that you ever existed? May God bless you and your efforts to become the best person and the most consistently profitable trader you possibly can be!”
In my own life, I use my trading to support a charity which works with the poor, for missionary work, and my local church. I believe that produces both economic and social benefits to the world in which I live.
© by Joe Ross. Re-transmission or reproduction of any part of this material is strictly prohibited without the prior written consent of Trading Educators, Inc.
SLCA TRADE
Instant Income Guaranteed
Developer: Joe Ross
Administration and New Developments: Philippe Gautier
On 23rd May 2016, we gave our IIG subscribers the following trade on SLCA, right after exiting a trade on the same stock. With strong support around $22, we decided to sell price insurance as follows the following day:
- On 24th May 2016, we sold SLCA July 15 2016 18P @ $0.20, i.e. $20 per option sold, with 51 days to expiration, and 34% between price action and our short strike (difficult to make a trade any safer).
- On 3rd June 2016, we bought back SLCA July 15 2016 18P @ $0.10, after 10 days in the trade, for quick premium compounding.
Profit: $10
Margin: $360
Return on Margin Annualized: 101.39%
We have also added new types of trades for our IIG daily guidance, "no loss" propositions with unlimited upside potential, still using other people's money to trade.
Philippe
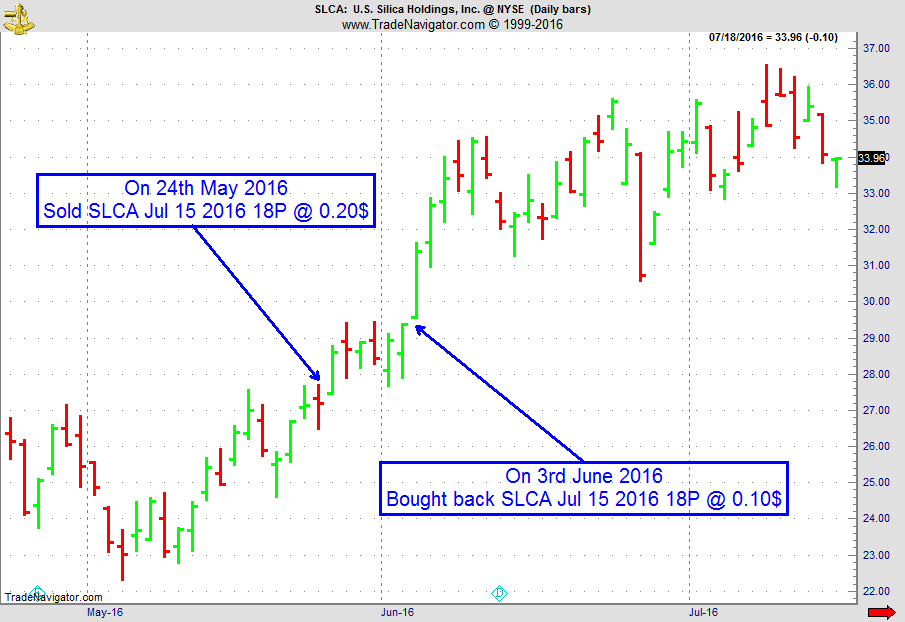
Receive daily trade recommendations - we do the research for you!
Instant Income Guaranteed
♦ SIGN UP TODAY! THIS IS WORTH THE INVESTMENT ♦
This includes a daily 80+ page report along with a daily podcast!
We review and supply the following:
-
our daily fills (entries, exits)
-
full real-time statistics of our weekly trades, closed trades for the current month, monthly statistics (detail and summary) since the beginning of IIG
-
daily market commentary (indices/sectors, volatility indices, main commodities related to our trade)
-
new trades for the following day
-
comments on our open trades, with all relevant news
-
updated earnings dates for our open positions
-
full details (days in trade, days to expiration, underlying close and price change, etc.) on our open trades (classic trades, complex positions, remaining rolled trades and covered calls)
-
active good till cancelled orders
-
dividends for the stocks owned
We also supply quite a number of extra "slides" in the appendix which are quite useful for new subscribers: recommendations, answers and explanations on the most frequent questions, techniques for entering trades, historical trades and real life examples, broker information, etc.
© by Joe Ross and Philippe Gautier. Re-transmission or reproduction of any part of this material is strictly prohibited without the prior written consent of Trading Educators, Inc.
This Week's Blog Post - Market Technicians
by Master Trader Andy Jordan
Educator for Spreads, Options, Swing/Day Trading, and Editor of Traders Notebook
Are you in the middle? Most people are. Read more.
© by Andy Jordan. Re-transmission or reproduction of any part of this material is strictly prohibited without the prior written consent of Trading Educators, Inc.
Drawdown is the norm, not the expection
by Master Trader Marco Mayer
Educator for Forex and Futures, Systematic Trader, and
Creator of Ambush Trading Method and AlgoStrats.com
In his article "Drawdown is the norm, not the exception", Marco writes about why being in a drawdown most of the time is nothing unusual or bad in trading and why it's not a good idea to try to avoid drawdowns altogether. Read more.
© by Marco Mayer. Re-transmission or reproduction of any part of this material is strictly prohibited without the prior written consent of Trading Educators, Inc.
Learn all you need to know about AlgoStrats:FX during this presentation by Marco Mayer. What is it, what's the idea behind it, why it is different from other services and how you'd profit from AlgoStrats:FX as a subscriber!
Join AlgoStrats:FX today!

Feel free to email questions to This email address is being protected from spambots. You need JavaScript enabled to view it., or post it in our Blog or Forum. Follow me on Facebook and Twitter!
© by Marco Mayer. Re-transmission or reproduction of any part of this material is strictly prohibited without the prior written consent of Trading Educators, Inc.

Check out our Blog!
To view previous published Chart Scan newsletters, please log in or click on "Join Us,"
shown above, to subscribe to our free "Members Only" section.
A WEALTH OF INFORMATION & EDUCATION:
Joe Ross-Trading Educators' popular free Chart Scan Newsletter has been published since 2004.
Note: Unless otherwise noted, all charts used in Chart Scan commentary were created
by using Genesis Financial Technologies' Trade Navigator (with permission).
Legal Notice and Copyright 2016 Disclaimer - Published by Trading Educators, Inc.
Chart Scan is a complimentary educational newsletter.
© by Trading Educators, Inc. Re-transmission or reproduction of any part of this material is strictly prohibited without prior written consent.
