Newsletters (208)
Children categories
Edition 608 - February 5, 2016

Trader Survey deadline is today, February 5, 2016 and it expires at 11:30 p.m. US CST. Don't miss out! Click here to participate, it takes about five minutes, and receive a 30% off coupon and an entry into a drawing for one-hour mentoring. We thank all of you who have already completed it.

Simple Chart
by Master Trader Joe Ross
Author, Trader, Trading Mentor, and Founder of Trading Educators, Inc.
There are some things I want to point out on this simple chart. I entered long at the price where you see the arrow ($9.26), one tick above a Thursday high. I made this entry based on a Traders Trick, which called for entry at that price due to the fact that Thursday’s high was only the second bar of correction to the Ross hook (three or four correcting bars are allowed), and prices were moving strongly in an uptrend.
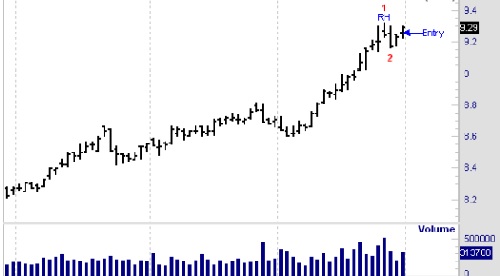
My thought was to take some profits on Monday, and move my position to breakeven as soon as possible. But notice also that every Ross hook is also the potential #1 point of a 1-2-3 formation in the opposite direction. In this case, the #1 and #2 points of a 1-2-3 high are made evident through Friday’s prices making a higher high. Notice also that Thursday’s prices made the necessary higher low that defines the formation.
Now, let’s look at some other factors to consider with regard to this trade. The Law of Charts teaches that when prices move from trending in a straight line to becoming parabolic, a correction is near. We don’t know exactly when it will occur, but we know that nothing goes up steeply for an indefinite amount of time. So, caution must be taken with this trade, and profits in some amount must be taken quickly at the first opportunity.
A second thing to look at is the fact that prices have already made the #1 and #2 points of what could well turn out to be a 1-2-3 high formation. The Law of Charts teaches that if this were to happen, the #2 point would then become a reverse Ross hook (RRh). RRhs and how to trade them are covered in my book Trading the Ross Hook. There is a way to filter RRhs so that most of the time you will trade them profitably.
Trading is, in large part, management. Anyone can get into a trade, but not everyone gets out profitably. I entered this trade with two possible strikes against me: the parabolic trend line and the potential 1-2-3 high. But with proper management and taking some money off the table quickly, there was no need to fear what lay ahead. I was able to take the Traders Trick boldly, knowing that if I managed the trade properly, I would come out ahead.
Start trading profitably today! Learn more about "The Law of Charts" to receive many tips and tricks that make it easy for you to use it in your trading.
© by Joe Ross. Re-transmission or reproduction of any part of this material is strictly prohibited without the prior written consent of Trading Educators, Inc.

Trading Idea with Commentary
by Master Trader Andy Jordan
Educator for Spreads, Options, Swing/Day Trading, and Editor of Traders Notebook
Click on the video below to learn about the September – May 2016 Coffee calendar spread (KCU16-KCK16).
Profitable trades are attainable! To find out how to manage this and other trades, and also to receive our daily detailed trading newsletter, subscribe to Traders Notebook.
© by Andy Jordan. Re-transmission or reproduction of any part of this material is strictly prohibited without the prior written consent of Trading Educators, Inc.
Planning for Contingencies
by Master Trader Andy Jordan
Educator for Spreads, Options, Swing/Day Trading, and Editor of Traders Notebook
No one likes to think about the worst-case scenario, or to make a detailed plan to recover should it happen. It's just one strategy for learning how to trade in a relaxed but focused way so that should you ever face a severe financial setback, you can recover from it. Trading requires intense concentration and focus, and it's difficult to maintain this posture when the pressure to perform is on you. Therefore, you have to do whatever you can to minimize any expected psychological pressure.
The most obvious ways to relieve such pressure is to think in terms of probabilities, and carefully manage risk. By that I mean avoid overtrading, fast markets, exceptional tick size, and be careful just ahead of reports that might drastically affect price movement. Avoid illiquid markets, and avoid adding new risk when it appears a trend might be nearing its end.
It's useful to remember that you may not win on any single trade, but after a series of trades you will have enough winners to make a profit in the long run. It's also important to manage your risk. Determine your risk up-front, and risk only a small amount of trading capital on a single trade. By doing that you will ease a lot of the pressure, allowing you to be more open to see the opportunities that the market offers. Don't break under the pressure of a potentially fatal loss. Think about the possibility, and be ready to recover from it.
© by Andy Jordan. Re-transmission or reproduction of any part of this material is strictly prohibited without the prior written consent of Trading Educators, Inc.
Ambush Method Trade and Performance Report
by Master Trader Marco Mayer
Educator for Forex and Futures, System Trader, and Creator of Ambush Trading Method
To refresh your memory, we reviewed the Australian Dollar Futures (6A, AUD/USD Spot Forex) in December, 2015. This market had been trading above a significant support level.
Because it has failed to trade through that support level, it is now trading below it. This makes for an interesting chart, while giving me an opportunity to also give you an update on Ambush in that market, so let’s have a look!
Right now the Aussie is trading between two interesting price levels, 0.7030 and 0.7130. As usual with these levels, they’re more to be seen as price-zones than exact price levels, but I guess you can get the idea by looking at the chart. The question is to which side the market might finally break out, and to be honest, I have no idea.
The good news is that I really don’t need to know, and I don’t even care about it. We’re not fortune tellers, we’re traders, right?! As traders, we make money by trading an edge, not by making guesses about the future.
As I’m writing this (Wednesday afternoon) we’re long the Aussie, trading Ambush, with an entry at 0.7006 (LIMIT Entry that we put in yesterday, no need to watch the markets during the day). Right now the market is trading at 0.7054 and we’re up about $500 on the trade, so it looks as if that support did hold again, and we’ve seen a "false breakout" tonight. But, of course, there are still about 8 hours of trading left…
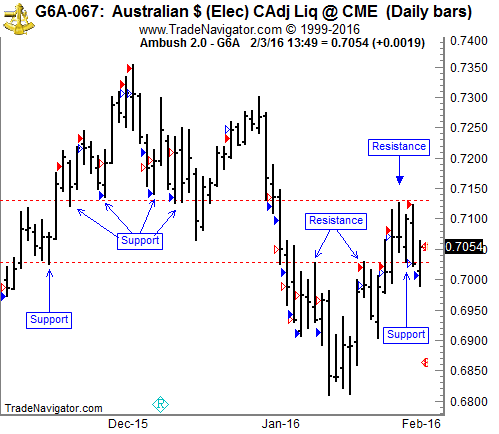
On the chart above are four different kinds of arrows:

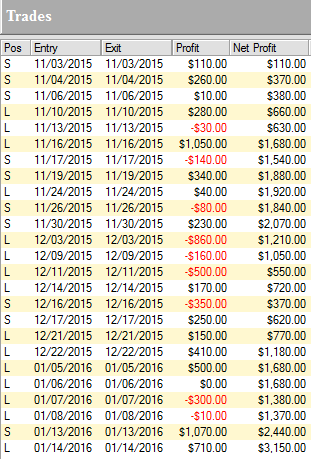
Let's examine the results of those trades (including $10 for commissions and slippage round-turn) trading just one Australian Dollar Futures (6A) contract:
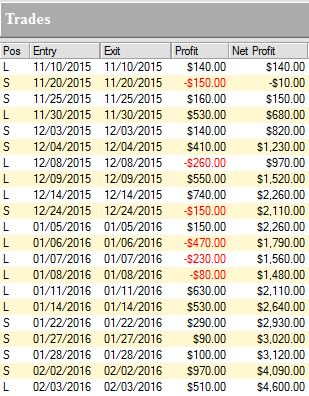
As you can see, Ambush managed to make a total of $4,600 profit (including $10 for commissions and slippage round-turn) trading just one contract, without keeping any positions overnight!
Click on the link below and look at the menu on the right to see the long-term performance of the Australian Dollar Futures (6A) and all other markets supported by Ambush:
View The Reports Now
© by Marco Mayer. Re-transmission or reproduction of any part of this material is strictly prohibited without the prior written consent of Trading Educators, Inc.
Trader Survey
Survey expires tonight, February 5, 2016 at 11:30 p.m. US CST!
Receive a 30% off coupon and an entry into a drawing for one-hour mentoring.
To view previous published Chart Scan newsletters, please log in or click on "Join Us," shown above, to subscribe to our free "Members Only" section.
A WEALTH OF INFORMATION & EDUCATION:
Joe Ross-Trading Educators' popular free Chart Scan Newsletter has been published since 2004.
Note: Unless otherwise noted, all charts used in Chart Scan commentary were created
by using Genesis Financial Technologies' Trade Navigator (with permission).
Legal Notice and Copyright 2016 Disclaimer - Published by Trading Educators, Inc.
Chart Scan is a complimentary educational newsletter.
© by Trading Educators, Inc. Re-transmission or reproduction of any part of this material is strictly prohibited without prior written consent.
Edition 607 - January 29, 2016

The first month of the new year has almost ended, with hopes of trading successes during this volatile market coming to fruition. Trading Educators is here to help plant information which ensures deep roots for solid and steady growth.
A reminder that our Trader Survey is still available until February 5, 2016. The link is located at the top of our newsletter. Feel free to participate - we value your input. Thank you. Click here to participate, it takes about five minutes, and receive a 30% off coupon and an entry into a drawing for one-hour mentoring.

Aggressive/Conservative
by Master Trader Joe Ross
Author, Trader, Trading Mentor, and Founder of Trading Educators, Inc.
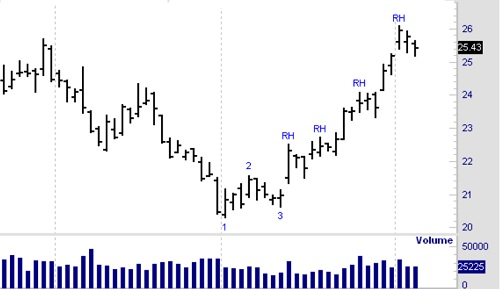
Prices were moving down. We see an end to selling, which was the low at point 1. As prices started to rise, shorts began to cover in order to take profits. Their buying, aided and abetted by the entry of longs who thought this was the bottom, caused prices to rise to the number 2 point. Some longs, looking for a quick profit, began to sell. They were joined by traders who felt that what they were seeing was a minor market rally. Prices headed back down to the number 3 point.
However, there was not enough supply at those low prices to warrant continued selling, so demand took the market higher. As prices rose, selling came into the market as longs liquidated all or part of their position, creating a Ross Hook (RH). Prices then violated the high of the Ross Hook, and a new uptrend was established.
Prices were moving up, and several corrections took place. These corrections were caused by longs taking profits. They sold in order to cover their positions, thereby causing the market to correct. The corrections left behind a minor or intermediate high which we call the point of the Ross Hook.
Aggressive traders might have wanted to go long 25.67 using the Traders Trick Entry (TTE).
Conservative traders might have wanted to wait for prices to break above the Ross Hook at 26.11 before establishing a long position in Bean Oil.
© by Joe Ross. Re-transmission or reproduction of any part of this material is strictly prohibited without the prior written consent of Trading Educators, Inc.

Trading Idea with Commentary
by Master Trader Andy Jordan
Educator for Spreads, Options, Swing/Day Trading, and Editor of Traders Notebook
We are looking into a Wheat calendar spread ZWU16-ZWK16: long the September 2016 and short the May 2016 Chicago Wheat. Andy, in his video, explains precisely how he would manage the entry and the risk.
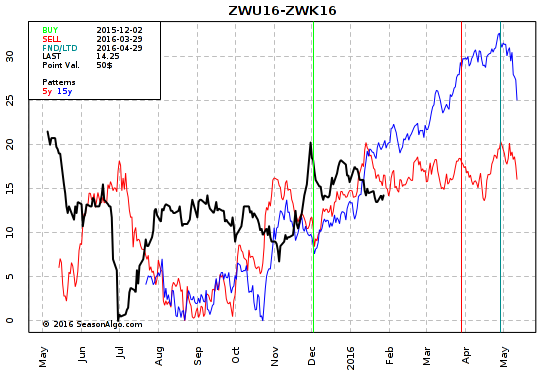
As an added value for our customers, Andy Jordan has provided a 3-minute video that delves deeper into understanding what is on the chart above.
Profitable trades are attainable! To find out how to manage this and other trades, and also to receive our daily detailed trading newsletter, subscribe to Traders Notebook.
© by Andy Jordan. Re-transmission or reproduction of any part of this material is strictly prohibited without the prior written consent of Trading Educators, Inc.
Trading Article
by Master Trader Marco Mayer
Educator for Forex and Futures, System Trader, and Creator of Ambush Trading Method
Hi Marco, I’ve read that what really matters in trading are exits, not entries. The book stated that even random entries can make money with the right exits. Is this true?
Ah, another often-repeated misconception in the world of trading! I really like to get these questions from traders in order to correct their misinformation. In past articles I’ve answered questions from traders such as "is the right psychology/mindset all I need to be successful?" and "is careful money-management all I need to succeed?" Now there’s usually some truth in those statements, but they always go a bit too far in the other direction. Balance and common sense are ultimately what’s going to make things work. Traders have found my writings to be helpful in becoming a successful trader, so including this question, at some point I’ll have enough of these to publish a book.
Let’s get back to the question at hand. Which one is more important, how to enter or how to exit a trade? In my experience, both are equally important, and actually impossible to separate. There are good and bad exits for different kinds of entries.
Just think about it logically. Let’s say we have three strategies.
- A long-term trend-following strategy in which we try to capture moves that last weeks to months. Naturally, we don’t want to set profit targets here, since we know it’s the huge winners who will make this work long-term. For that, we’re willing to give back huge parts of open profits.
- A short-term breakout strategy in which we want to capture a possible breakout lasting for a few days, trying to not give too much back.
- A short-term mean-reversion strategy in which we’re unsure as to when the market will reverse. We want to give it some room, but as soon as it does bounce, we want to take profits quickly.
Could we use the same exit for each of these strategies? Will a trailing-stop exit be helpful with the mean-reversion strategy? Is a profit target going to help us with the trend-following strategy? Does it make sense to give the breakout-trades a lot of room to develop, and use a very wide stop-loss?
To all of these questions the answer is no. There are exit strategies that make sense for each of these strategies, but if you mix them up, they’ll no longer work. Which to me proves my point, that both entries and exits need to be compatible with each other, and are therefore equally important.
And no, you probably won’t make money with random entries. Well, in the short run maybe you do if you’re lucky, but in the long run, reality will prove you wrong. I’ve seen some articles that state otherwise, showing pseudo-random entries that haven’t been random at all (that for example enter at a specific time each day) or where the exit-strategy was actually part of the entry (for example using stop and reverse exits/entries).
Now, should you find a exit strategy that’s not curve-fit for a specific market and timespan, that does provide an edge with really random entries, please send me an email. I’d be very happy to hear about it, since so far I’ve failed to discover such a thing.
Happy Trading!
Marco
© by Marco Mayer. Re-transmission or reproduction of any part of this material is strictly prohibited without the prior written consent of Trading Educators, Inc.
Trader Survey
Complete it on or before February 5, 2016 to receive a 30% off coupon
and an entry into a drawing for one-hour mentoring.
To view previous published Chart Scan newsletters, please log in or click on "Join Us," shown above, to subscribe to our free "Members Only" section.
A WEALTH OF INFORMATION & EDUCATION:
Joe Ross-Trading Educators' popular free Chart Scan Newsletter has been published since 2004.
Note: Unless otherwise noted, all charts used in Chart Scan commentary were created
by using Genesis Financial Technologies' Trade Navigator (with permission).
Legal Notice and Copyright 2016 Disclaimer - Published by Trading Educators, Inc.
Chart Scan is a complimentary educational newsletter.
© by Trading Educators, Inc. Re-transmission or reproduction of any part of this material is strictly prohibited without prior written consent.
Edition 606 - January 22, 2016

The new year has ignited us to create new ways to reach out to our traders to meet your needs. We don't specialize in just one market, we are able to cover the majority of them because of our experienced traders who make up Trading Educators. In order to continue the highest standard of teaching, we have created a trader survey in which we would appreciate your participation. Thank you to those who have already submitted their valuable input. Click here to participate, it takes about five minutes, and receive a 30% off coupon and an entry into a drawing for one-hour mentoring.

Strategy
by Master Trader Joe Ross
Author, Trader, Trading Mentor, and Founder of Trading Educators, Inc.
Trading Educators suggests trading with at least two contracts, and preferably three. The reason for this, except when we are scalping all contracts at once, is to use one contract to cover costs and take a small profit, and then allow the others to ride to a reasonable profit level. We believe in never trying to "take" or force the market, only "accept" what it gives you.
This differs considerably from the mind-set of most traders who are driven by greed to seek to squeeze every last penny from each and every trade.
We use a three contract concept: One contract is cashed as soon as possible to cover costs, with at least a small profit. The stops for two contracts are then pulled up to breakeven as soon as is practical.
When the market yields a few more ticks, the second contract is cashed, thereby locking in a greater profit for the trading effort. The third contract stop is held back at breakeven for as long as possible, to allow the trade to earn the most profit.
As profits are earned, a stop is trailed according to any one of a number of acceptable methods. The stop is never allowed to do any worse than breakeven.
This management technique derives from a different attitude towards the markets than is commonly taught and practiced by the majority.
You probably have heard and read that a trader should learn to “love small losses.” Such an attitude is pure nonsense. My philosophy of trading is to learn to hate losses, and reluctantly settle for break-even. It yields a totally different result from learning to love losses. The trader who learns to love small losses expects to have them, and so he does.
Conversely, the trader who learns to love to win, and at worst to break even, begins to manage his trades, risk, and money in such a manner as to not lose.
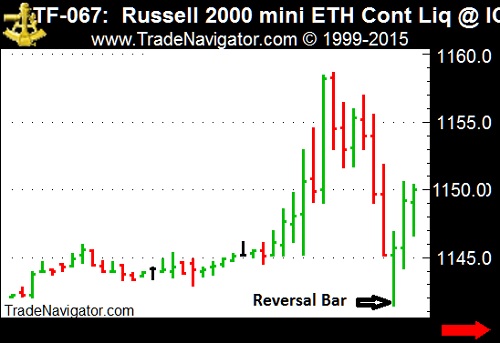
Let's now take a look at a day trade. Above you see the 30-minute chart of the e-mini Russell 2000. I went long at 1147.0 using a reversal bar technique that is taught during private tutoring. My risk was $300. I cashed first profits, 1 contract at +$100, and moved my stop to breakeven. Next profit was 1 contract at $200. The final contract was cashed for a $400 profit, making a total of $700 in profits. I realized enough profits to cover costs for all contracts, and to enjoy a satisfactory win.
This concept is described in my book "Day Trading."
© by Joe Ross. Re-transmission or reproduction of any part of this material is strictly prohibited without the prior written consent of Trading Educators, Inc.
Getting Family Support
by Master Trader Joe Ross
Author, Trader, Trading Mentor, and Founder of Trading Educators, Inc.
If there are people in your life who do not support your efforts to become a successful trader, avoid them. Avoid those who express negative energy on a regular basis, and vent their hostilities towards you. Wherever possible, terminate unhealthy emotional relationships that cannot be repaired, and if necessary, do it immediately.
Negative energy has a cumulative effect that eventually wears down your positive attitude and energy to be successful. Life is too short to be with those who do not believe in you or your abilities to achieve success. A loving partner takes an interest in your work, encourages your efforts, expresses compassion during difficult times, and always tries to help you grow.
Sometimes it helps to find a trading office where, instead of getting a bunch of flack from those around you, you can find support, encouragement, and perhaps learn a few tricks from successful traders. I did say a trading office, not a newsgroup or chat room. All you will find in those places is a lot of negative energy, gossip, rumors, and most people who are so confused they can’t see the forest for the trees. For the most part, people who frequent those places are no better off than you are, and in many instances are a lot worse off. You cannot believe much of anything you hear in chat rooms. Sorry about that, but it’s true.
© by Joe Ross. Re-transmission or reproduction of any part of this material is strictly prohibited without the prior written consent of Trading Educators, Inc.

Trading Idea with Commentary
by Master Trader Andy Jordan
Educator for Spreads, Options, Swing/Day Trading, and Editor of Traders Notebook
This week we're looking at the 30-Yr US Treasury Bonds in order to develop an idea of how to trade them.
.png?i=620)
The bonds have been trading in a wide range for a long time, as you can see on the weekly chart above. Right now we are almost reaching the August 2015 high, and after that we might even go for the high of March 2015. We like the idea of going counter-trend by selling far out-of-the-money March calls, with a strike around 169 or 170. The March 2016 options expire in less than a month on 02/19.
As an added value for our customers, Andy Jordan has provided a 3-minute video that delves deeper into understanding what is on the chart above.
Profitable trades are attainable! To find out how to manage this and other trades, and also to receive our daily detailed trading newsletter, subscribe to Traders Notebook.
© by Andy Jordan. Re-transmission or reproduction of any part of this material is strictly prohibited without the prior written consent of Trading Educators, Inc.
Ambush Method Trade and Performance Report
by Master Trader Marco Mayer
Educator for Forex and Futures, System Trader, and Creator of Ambush Trading Method
A lot has happened since November, the last time we looked at the EuroSTOXX 50 traded at Eurex. We are now looking at a completely different picture.
On the last update, we were close to reaching the point that is marked on the chart with [1]. Then there was a sideways market within a battered bull market, but since then the picture has cleared up significantly.
We’ve seen a strong price drop within a single day [1], which also marked a medium term high, and point 1 of a 1-2-3 high. From there, the price went straight down to create a significant point [2]. After a brief rally to point [3], the market continued to move lower, completing our 1-2-3 high pattern. Around the same time, the 200-day moving average started to decline, which is often a signal for a longer term trend change for which many traders are watching.
Since then, price is trading in a clear downtrend, giving us trading opportunities with Ross Hooks (RHs). On a larger picture though, we’re now trading around the lows of August/September 2015, which could give some support to the market.
As you can see, Ambush performed very well during all of these market phases by taking trades in both directions at extreme price levels.
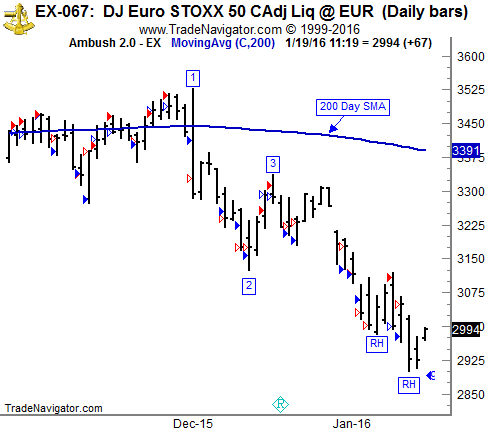
On the chart above are four different kinds of arrows:
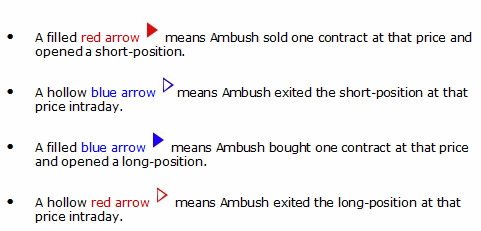
Let's examine the results of those trades (including $10 for commissions and slippage round-turn) trading just one EuroSTOXX 50 Futures (FESX) contract:
As you can see, Ambush managed to make a total of $3,150 profit (including $10 for commissions and slippage round-turn) trading just one contract, without keeping any positions overnight!
Click on the link below and look at the menu on the right to see the long-term performance of the EuroSTOXX 50 Futures (FESX) and all other markets supported by Ambush:
View The Reports Now
© by Marco Mayer. Re-transmission or reproduction of any part of this material is strictly prohibited without the prior written consent of Trading Educators, Inc.
Trader Survey
Complete it on or before February 5, 2016 to receive a 30% off coupon
and an entry into a drawing for one-hour mentoring.
To view previous published Chart Scan newsletters, please log in or click on "Join Us," shown above, to subscribe to our free "Members Only" section.
A WEALTH OF INFORMATION & EDUCATION:
Joe Ross-Trading Educators' popular free Chart Scan Newsletter has been published since 2004.
Note: Unless otherwise noted, all charts used in Chart Scan commentary were created
by using Genesis Financial Technologies' Trade Navigator (with permission).
Legal Notice and Copyright 2016 Disclaimer - Published by Trading Educators, Inc.
Chart Scan is a complimentary educational newsletter.
© by Trading Educators, Inc. Re-transmission or reproduction of any part of this material is strictly prohibited without prior written consent.
Edition 605 - January 15, 2016

We encourage you to stay strong during these volatile times, and to choose your trades carefully. Stick with your planned strategies. Asking for help could save you time and money. If you're headed down the wrong trading path, you won't know it until it's too late. Don't be afraid to get advice. It's worth the investment to have one of our master traders review your plan today!

May Corn
by Master Trader Joe Ross
Author, Trader, Trading Mentor, and Founder of Trading Educators, Inc.
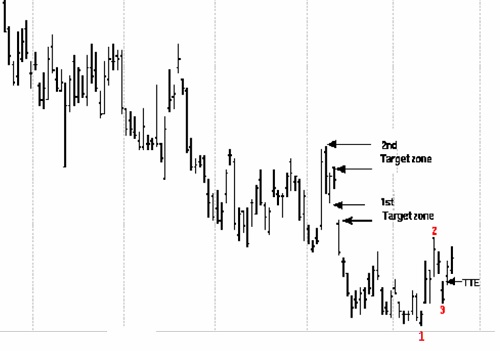
Corn formed a base at the end of a trend, and then formed a 1-2-3 low. Prices thrust above the #3 point, but due to the gap opening, I personally did not take the trade. I do not trade gap openings as a matter of preference. Actually, the choice is one of 50% - half the time it is the right choice, and half the time it is wrong, and better to enter on backfilling. Traders who entered on backfilling did enter such trades, and were then ahead.
If prices had broken beyond #2, there would have been two immediate target zones. The first one was the gap that formed when prices moved down to squeeze out the last of the bulls. The second one was that of previous fair value. Corn prices were steady in the area of the previous trading range, but a move into that area would generally see a test of the highs.
© by Joe Ross. Re-transmission or reproduction of any part of this material is strictly prohibited without the prior written consent of Trading Educators, Inc.

Is Trading Really a Business Like Other Businesses?
by Master Trader Andy Jordan
Educator for Spreads, Options, Swing/Day Trading, and Editor of Traders Notebook
The importance of how you learn the business of trading cannot be minimized because of the factors that determine your success or failure. Learning the business of trading is basically no different from learning any other business. Winning means learning major guidelines and concepts that you repeat so often in your own behavior that they become good habits. These good habits then become automatic behavior patterns, which are formed as brain pathways by the rewards you get for trading well, and the punishment you receive from trading poorly. When you associate yourself with other traders, try to associate with those who are building their personal net worth, not just talking about it. True success is silent. Try not to do something just because everyone else is doing it. Successful traders are rare. If the crowd is doing it, watch out! By subscribing to Traders Notebook, you have correctly chosen to associate yourself with the winners.
© by Andy Jordan. Re-transmission or reproduction of any part of this material is strictly prohibited without the prior written consent of Trading Educators, Inc.
Spread Scan with Commentary
by Master Trader Andy Jordan
Educator for Spreads, Options, Swing/Day Trading, and Editor of Traders Notebook
This week we're looking at HEQ16 – HEM16: long August 2016 and short June 2016 Lean Hogs (CME on Globex).
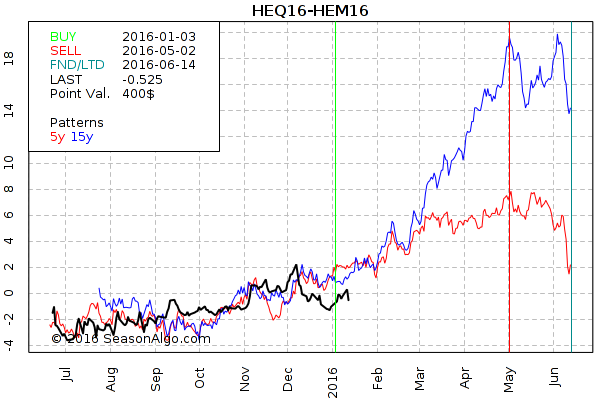
Today we consider a Lean Hogs calendar spread: long August 2016 and short June 2016 Lean Hogs (elec. symbols: HEQ16 – HEM16). After making a high in December 2015, the spread has retraced to below 0. The seasonal time window is very wide, with a statistical entry on 01/03 and an exit on 05/02. This spread has performed positively over the last 15 years. Traders might want to use the current Ross Hook as an entry signal.
Profitable trades are attainable! To find out how to manage this and other trades, and also to receive our daily detailed trading newsletter, subscribe to Traders Notebook.
© by Andy Jordan. Re-transmission or reproduction of any part of this material is strictly prohibited without the prior written consent of Trading Educators, Inc.
Ambush Method Trade and Performance Report
by Master Trader Marco Mayer
Educator for Forex and Futures, System Trader, and Creator of Ambush Trading Method
It’s been a few months since we looked at the New Zealand Dollar Futures (or NZD/USD spot forex market). Here is an update on Ambush in this market.
The NZD has really been a quite volatile and bit crazy market lately. Notice the recent strong move down all the way from 0.6850 to 0.6500 without any noticeable corrections!
All the while, basically nothing happened. The market is stuck in a huge range between 0.6400 and 0.6850, and right now it looks like it will continue to trade in this range for a while. How to approach this? I think Ambush is going to continue to perform well in this environment. A possible suggestion might be to look for buy setups around 0.6450, such as a 1-2-3 low.
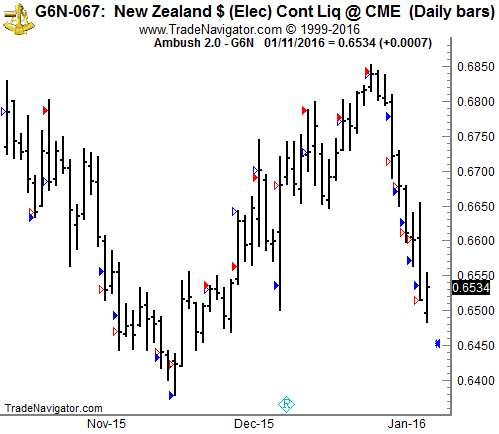
On the chart above are four different kinds of arrows:

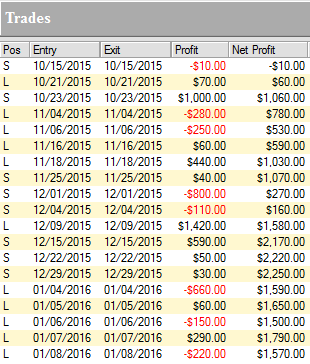
Let's examine the results of those trades (including $10 for commissions and slippage round-turn) trading just one New Zealand Dollar Futures (6N) contract:
As you can see, Ambush managed to make a total of $1,570 profit (including $10 for commissions and slippage round-turn) trading just one contract, without keeping any positions overnight!
Click on the link below and look at the menu on the right to see the long-term performance of the New Zealand Dollar Futures (6N) and all other markets supported by Ambush:
View The Reports Now
© by Marco Mayer. Re-transmission or reproduction of any part of this material is strictly prohibited without the prior written consent of Trading Educators, Inc.
To view previous published Chart Scan newsletters, please log in or click on "Join Us," shown above, to subscribe to our free "Members Only" section.
A WEALTH OF INFORMATION & EDUCATION:
Joe Ross-Trading Educators' popular free Chart Scan Newsletter has been published since 2004.
Note: Unless otherwise noted, all charts used in Chart Scan commentary were created
by using Genesis Financial Technologies' Trade Navigator (with permission).
Legal Notice and Copyright 2016 Disclaimer - Published by Trading Educators, Inc.
Chart Scan is a complimentary educational newsletter.
© by Trading Educators, Inc. Re-transmission or reproduction of any part of this material is strictly prohibited without prior written consent.
Edition 604 - January 8, 2016

Carrying out your New Year's trading resolutions can be exciting and fulfilling. Trading Educators is here to assist you by offering resources which can help you to become a winning trader in all markets.

Instant Income Program (IIP) Summary
by Master Trader Joe Ross
Author, Trader, Trading Mentor, and Founder of Trading Educators, Inc.
2015 was a year in which the Instant Income Program (IIP) really showed its worth. IIP formally began in May of 2014, and has incurred no losses whatsoever. Below is the IIP track record.
IIP began in 2008 as we started developing this product from my own trading. I tested it for six years during which time I modified it, refined it, and tested it with my own money. It was so good that I hesitated to bring it public. I was correct in thinking that no one would believe its success, but that some traders would be curious enough to give it a try. It is only by experiencing IIP that true belief is able to take place. We now have had dozens of traders prove to themselves that it is possible to trade in this way without losing money. There is the slimmest of chances that, when traded correctly, a trader will ever experience a loss.
Early in 2015, I turned all of the preparation and trading of IIP over to Philippe Gautier, a long-time student and excellent trader. Philippe has added his own style and acumen to trading the IIP, and it has been thrilling for me to watch him in his mastery of the program.
I look forward to 2016, and the success we expect to continue throughout the year. In all, IIP has proven itself for seven years. I fully expect it to give our students another outstanding year without losses.
To all of our students, I wish 2016 to be the best trading year you have ever had, and that life itself brings you joy, prosperity, and good health.
JR
© by Joe Ross. Re-transmission or reproduction of any part of this material is strictly prohibited without the prior written consent of Trading Educators, Inc.
50% OFF RECORDED WEBINAR
"TRADING ALL MARKETS"
COUPON CODE: goal2016
Offer good thru January 13, 2016

Spread Scan with Commentary
by Master Trader Andy Jordan
Educator for Spreads, Options, Swing/Day Trading, and Editor of Traders Notebook
This week we're looking at GFK16 – GFH16: long May 2016 and short March 2016 Feeder Cattle (CME on Globex).
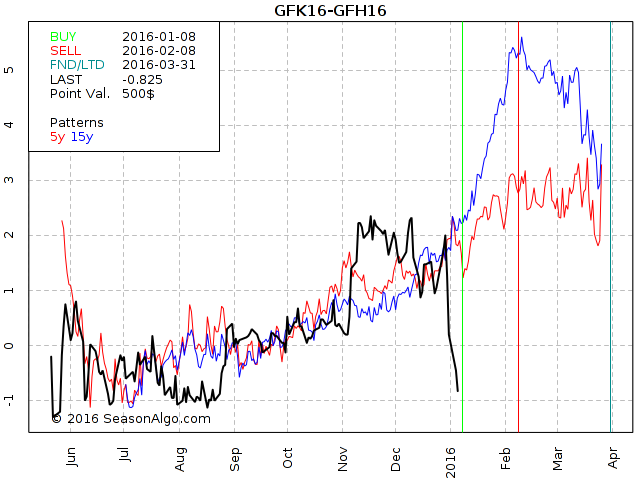
Today we consider a Feeder Cattle calendar spread: long May 2016 and short March 2016 Feeder Cattle (elec. symbols: GFK16 – GFH16). This spread is not yet ready for an entry because it is currently in free-fall, and it might fall much lower (levels of -4 were reached in the past). But the level around -1 is an interesting level, because the spread has found support several times last year between June and August. That is why I would keep this spread on my watch-list, ready to enter as soon as I get a reversal signal.
Profitable trades are attainable! To find out how to manage this and other trades, and also to receive our daily detailed trading newsletter, subscribe to Traders Notebook.
© by Andy Jordan. Re-transmission or reproduction of any part of this material is strictly prohibited without the prior written consent of Trading Educators, Inc.
Stealth Trader with Commentary
by Master Trader Andy Jordan
Educator for Spreads, Options, Swing/Day Trading, and Editor of Traders Notebook
On December 30th, our "Stealth Trader" method generated an entry signal for the next trading day. We got long with 2 contracts the March Japanese Yen (first blue arrow), and we reached our first target on the next day (first red arrow). We are still tailing the stop for the second lot at the low of each daily bar.
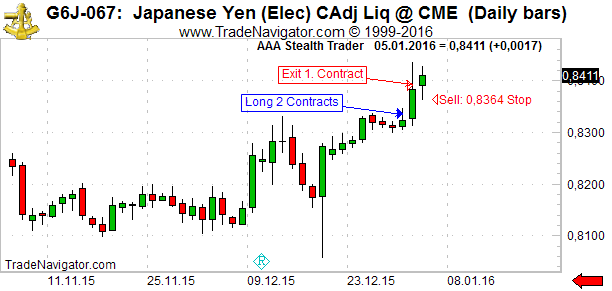
With an initial risk of approximately $680 per contract, the method generated a profit of $680 with the first contract. We are still long with one contract with a stop at 0.8364 (for 01/05).
Find out more about Stealth Trader!
© by Andy Jordan. Re-transmission or reproduction of any part of this material is strictly prohibited without the prior written consent of Trading Educators, Inc.
Welcome to 2016 - time to set some trading goals!
by Master Trader Marco Mayer
Educator for Forex and Futures, System Trader, and Creator of Ambush Trading Method
A new year has now started, and as I do every year, I’ve set myself some trading goals for the year. While I won’t share my specific goals with you, I’d like to give you some ideas of what you as a trader could write down for yourself, and why this is important.
Of course, you could do this anytime, but a new year is psychologically a good time to do so. You can write off the old one to start all fresh!
I personally like to set goals for myself regarding profits that I want to earn for the year, plus a drawdown I don’t want to exceed. One example might be to plan to make 30% profits this year, with no more than 20% drawdown.
Let’s be realistic here. Set yourself goals that are achievable, and make them specific so that you can measure your success. In other words, deciding that you want to make a ton of money trading this year with very small drawdowns isn’t specific enough because you can’t measure it. Also deciding to make 1000% this year with a maximum of 10% drawdown sounds great, but probably isn’t very likely to happen.
There’s a lot more you can do of course. One idea is to simply think about what you did wrong last year, and set your trading goal to stop doing it. Here's an example: "I will not get into any trades without knowing exactly when to get out of the trade before placing the entry order," or "I will not move my stop-loss to give a trade more room."
And of course, set goals where you want to improve. For example, I will let my winning trades run instead of moving the stop-loss to breakeven.
Or you may want to change your trading-style by decreasing your daily trading hours down to two hours a day by trading only during the most active time of the day.
You can also set goals for learning about trading strategies you want to develop. Here’s a few examples:
- Learning about a backtesting platform and how to use it.
- Developing a new strategy to day-trade stocks.
- If you’re new to trading, learning about trading futures and finding a good mentor to speed up the process.
As you can see, the possibilities are almost infinite. It’s essential to think about what’s important for you, and define these goals in detail. I think it’s better to have only a couple of things on your list that are really important for you, and then really focus on those during the year.
We invite you to join us, please visit our "members only" area for a newly opened thread in our Trading Forum. Share your ideas for goals, and ask any questions you might have on these topics!
Happy Trading!
Marco
© by Marco Mayer. Re-transmission or reproduction of any part of this material is strictly prohibited without the prior written consent of Trading Educators, Inc.
50% OFF RECORDED WEBINAR
"TRADING ALL MARKETS"
COUPON CODE: goal2016
Offer good thru January 13, 2016
To view previous published Chart Scan newsletters, please log in or click on "Join Us," shown above, to subscribe to our free "Members Only" section.
A WEALTH OF INFORMATION & EDUCATION:
Joe Ross-Trading Educators' popular free Chart Scan Newsletter has been published since 2004.
Note: Unless otherwise noted, all charts used in Chart Scan commentary were created
by using Genesis Financial Technologies' Trade Navigator (with permission).
Legal Notice and Copyright 2016 Disclaimer - Published by Trading Educators, Inc.
Chart Scan is a complimentary educational newsletter.
© by Trading Educators, Inc. Re-transmission or reproduction of any part of this material is strictly prohibited without prior written consent.
Edition 603 - January 1, 2016

Trading Educators has served our customers since 1988, and still remains committed to our dedication to teaching the truth about trading. We relish the thought that our company promotes and educates independent and self-reliant traders. In the coming year, we will continue our commitment to give you the highest level of service.

2016 Greetings
by Master Trader Joe Ross
Author, Trader, Trading Mentor, and Founder of Trading Educators, Inc.
Hello Traders,
I wish you a very good start in this New Year, and really great trading in 2016. My only advice this year is to "be careful," "use caution," and keep lots of cash on hand due to the economic volatility and threats of war. Pay attention traders, you can make money under these conditions, but you have to be careful. "Keep your powder dry" and be ready to take advantage of very lucrative opportunities. Traders can make the most money when volatility is high.
The commodities are beginning to bottom, and will continue to bottom into March, giving many opportunities. Stay completely away from junk bonds and municipal bonds. Any government bonds should be treated with much care and caution. Look for continued rising in the US dollar, at least in the immediate future. We should own a little physical gold if possible, and "poor mans" gold (silver), if possible. The financial markets will be in great turmoil.
Thank you for your support and loyalty, and we look forward to serving you for many years to come.
Happy Trading,
Joe Ross
© by Joe Ross. Re-transmission or reproduction of any part of this material is strictly prohibited without the prior written consent of Trading Educators, Inc.

2016 Greetings
by Master Trader Andy Jordan
Educator for Spreads, Options, Swing/Day Trading, and Editor of Traders Notebook
2015 was definitely a difficult year for traders. Many hedge funds went broke or are close to being out of business. My seasonal spread trading didn’t work well in 2015, but our options trading was okay. My swing and day trading went surprisingly well this year, and Stealth Trader also brought in some nice profits. With one Stealth Trader account I am up almost 100%, thanks to some lucky exits in August when the US stock indices tanked for a few days.
But what will 2016 bring regarding trading? I think rising interest rates in the US will bring more volatility, not only in the indexes or financial markets, also in other commodity markets. I believe the US stock market will continue to climb higher, along with the US Dollar.
Quite contrary to the US, I believe Europe will head into very difficult times. The refugee problem will be only one part of the puzzle that will bring Europe down.
As you can see from my list above, I think a good trader has to be able to adapt to different market situations. The times when a trader could concentrate only on one specific way of trading are long over. When I started almost 15 years ago, Joe pushed me into spread trading, but over the years I've added many ways of trading to my trading-tool-box. I am recommending that you do the same.
I wish you all a joyful 2016, with good health, love, and many good trades!
Andy Jordan
© by Andy Jordan. Re-transmission or reproduction of any part of this material is strictly prohibited without the prior written consent of Trading Educators, Inc.

2016 Greetings - New Year
by Master Trader Marco Mayer
Educator for Forex and Futures, System Trader, and Creator of Ambush Trading Method
It’s always a good idea to look back at the end of each year to reflect on what happened, and to set fresh goals for the next year. I feel that’s especially true for my trading, since I set my goals on a yearly basis.
In other words, regarding trading results, I don’t have any daily/weekly/monthly goals anymore. All I look at is what I achieved over a year. Why? Simply because I realized it’s almost impossible to reach a monthly goal on a persistent basis. The markets might give you a hard time for months, and then you make it all within a month or two. It’s better to not care for short-term results, which is difficult but possible, if you keep the long-term in perspective.
2015 was a very mixed year for me. I had a really sluggish start that lasted until around April, when everything turned around and I had some very good months. At the end of July everything looked very promising, I had already reached my yearly goals, and was hoping for another super year like the one I had in 2014!
As usual, whenever you get too confident in trading something bad is waiting around the corner. For me that was definitely the month of August. Specifically, the last two weeks, when the stock markets dropped over 10% within three days without any retracements. My guess is that many of you also remember that time. I know from many other traders that they also got hit quite hard. Some of them no longer trade now - that huge drop in the stock markets simply was too much for their accounts being over-leveraged. For the first time I saw the E-Mini S&P 500 stop trading during the day. I’ve seen this in the E-Mini Nasdaq and other markets before, but never in the ES. There’s always a first time, huh? It’s exactly these times that make you a very humble trader, when something happens that hadn’t happened before.
I was protected throughout that period, but it still was a huge hit, and I gave back more than 2/3 of the profits I had accumulated to that point in 2015. Ouch! Like any other human being, I was not looking forward to placing my orders the days after this, but I stuck to my guns and continued doing what I did every day. I have to say that if my trading hadn’t been 100% systematic, I probably would have had to at least take a break at this point. It still wasn’t easy to keep going, but it was at least possible.
This course proved to be the right step to take. In September, I made back about 50% of the losses, and while I’m still not back at that equity peak of August, I did almost reach my goal for 2015! Looking back, it is all a nice story. The difficult and crucial part is to not get lost in those „stories,“ and focus on the long term. But this can be really tough!
In a nutshell, that was my 2015 trading year. In addition to that, I was very happy to help many of you to become better traders. It’s a big joy to hear from some of you that you improved your trading results significantly, or even more importantly, your trading life!
For me, the big change in 2015 was that I completely stopped doing any part-time IT related projects, and focused 100% on trading and on trading system development. This made things possible for me that I couldn’t have achieved otherwise. After years of thinking about it, I finally could develop my own backtesting and trading platforms, based on „python“ that now allows me to try out many of the ideas I had written down over the years, but couldn’t backtest due to limitations of the available retail trading platforms.
Looking back, it’s clear that I could never have done that part-time. It’s a tremendous amount of work if you want to do it right, and even with over 15 years of experience in software development, I did very seriously underestimate the effort and time needed to complete this.
So was it worth the effort? I surely think so! It’s no overstatement to say that this year of deep research and development took my trading to a new level. I got tons of new ideas in the process, and I learned a lot even though I had thought I already knew pretty much everything about trading and system development. There is a reason why the big players all have their own R- or Python- or Matlab-based research and trading systems. For me, this opened up the doors to advanced statistics, machine-learning, and other techniques that are incredibly helpful with developing new trading ideas and systems. It’s still the simple ideas that work best, but having the knowledge and tools available makes a huge difference in the development process.
This puts me in a very nice position for 2016. I now have many of the capabilities that the big players have - while not having the liquidity issues they have. In other words, I can trade edges in markets and timeframes that they can’t trade.
So what’s up for 2016? My next step is to finish the development and start to trade the new systems I’m working on. I’m also planning to come up with new products and services based on what I discovered this year, and I’m sure you’ll be as excited about these as I am.
Overall, the conditions look very good for trading in 2016. We have plenty of volatility right now, and I think it won’t stop too soon - so I’m looking forward to a good, and maybe a bit less exciting trading year in 2016!
That’s also what I wish every one of you - a successful but also a relaxed, and of course a happy and healthy, New Year 2016!
Marco
© by Marco Mayer. Re-transmission or reproduction of any part of this material is strictly prohibited without the prior written consent of Trading Educators, Inc.
To view previous published Chart Scan newsletters, please log in or click on "Join Us," shown above, to subscribe to our free "Members Only" section.
A WEALTH OF INFORMATION & EDUCATION:
Joe Ross-Trading Educators' popular free Chart Scan Newsletter has been published since 2004.
Note: Unless otherwise noted, all charts used in Chart Scan commentary were created
by using Genesis Financial Technologies' Trade Navigator (with permission).
Legal Notice and Copyright 2015 Disclaimer - Published by Trading Educators, Inc.
Chart Scan is a complimentary educational newsletter.
© by Trading Educators, Inc. Re-transmission or reproduction of any part of this material is strictly prohibited without prior written consent.
Edition 602 - December 18, 2015

The team at Trading Educators wish you and your family a very special holiday. We hope that you balance family and work, to keep you, as a trader, and your family, happy, healthy, and strong.
We will not publish a newsletter next week, December 25, 2015. The new year edition will arrive on January 1, 2016.
Our Traders Wish List, which includes both our products and those of others, is still available on our website if you need some last-minute gift ideas.

The Law of Charts with Commentary
by Master Trader Joe Ross
Author, Trader, Trading Mentor, and Founder of Trading Educators, Inc.
Euro Fx
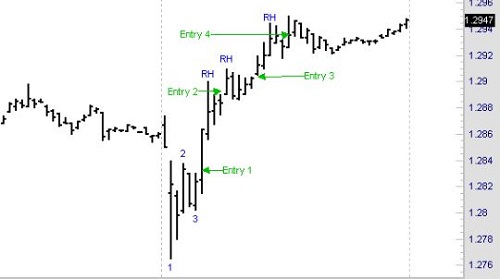
As you can see, Euro FX (10-minute chart) made a 1-2-3 low. On the bar marked 3, there was a Traders Trick entry to go long 1-tick above the high. I marked that "Entry 1."
Prices shot up and then corrected, giving me my first Ross hook (RH) of the day. Entry 2 from the Traders Trick, along with good trade management, offered an opportunity for a small win, but more than likely a breakeven trade.
Another RH formed a couple of bars later, which provided a second Traders Trick Entry. This time prices moved up nicely, and good profit was available. I labeled that Ross Hook "Entry 3."
Finally, you see Entry 4, which took place just ahead of exhaustion. The Close of the highest bar shows that momentum was no longer there. Still, the worst that could have happened with that trade was to break even. There were enough ticks to ensure that result.
The Traders Trick, along with The Law of Charts (TLOC), continue to provide opportunities for traders willing to learn to use them. Keep your eyes on the charts, they are the sources of the best trades.
© by Joe Ross. Re-transmission or reproduction of any part of this material is strictly prohibited without the prior written consent of Trading Educators, Inc.

Spread Scan with Commentary
by Master Trader Andy Jordan
Educator for Spreads, Options, Swing/Day Trading, and Editor of Traders Notebook
This week, let's examine one of the meats market: Lean Hogs.
.png?i=756)
As you can see on the chart above, Lean Hogs has been moving slightly higher since mid-November. Is this a change of direction or only a correction of the strong down-move in October/November? So far, we don't know, but as long as the 55.000 level holds, there is a good chance Lean Hogs will not move much lower. And that's all an options seller needs to know. With the Implied Volatility at a good level, aggressive traders might start to sell puts at the current level while more conservative traders might want to wait for the next up-move.
Find out more about how to manage this and other trades in our daily detailed trading newsletter Traders Notebook.
© by Andy Jordan. Re-transmission or reproduction of any part of this material is strictly prohibited without the prior written consent of Trading Educators, Inc.
Trading Article with Commentary
by Master Trader Andy Jordan
Educator for Spreads, Options, Swing/Day Trading, and Editor of Traders Notebook
Andy, if I get all my buy and sell signals to work properly, I should come out a winner, right?
Wrong! The perennial questions are, "Should I buy? Should I sell?" All too many traders focus their efforts on identifying buy and sell signals. In fact, that’s what most trading books consist of—some way to find buy and sell signals. Trading systems are usually all about "where to get in."
The research and analysis traders use is geared towards reaching the goal of getting that magic "base line" directive to guide their actions. How misguided can they be?
Any successful, experienced trader will tell you that although properly identifying buy/sell signals is important, it’s not the key to being successful. Instead, the way you manage each trade is what will determine your success.
Traders who take the baseline approach tend to believe that the success of their trading activity is dependent on following the right buy/sell signals at the right time. Clearly, it’s important that a trader be able to understand the process of generating signals and to use the methods involved. Realistically though, almost any trader can find a way to generate signals (whether using technical methods already out there, coming up with their own system, or using their platform’s automated signal generation tools).
Successful, experienced traders will tell you that your trade doesn't begin and end with a buy or sell. There’s a trade management process involved. For each trade you make, you’re making a group of decisions. The way you manage and time those decisions is what will determine the success of your trade. Let’s say two traders get the same signal at the same time, and act on it. One’s trade may result in profits, while the other's results in losses. How is this possible? It can occur because each trader made a different combination of decisions throughout the course of the trade. The decisions might include scaling in and/or out of the trade, using or not using trailing stop losses, setting or not setting profit objectives prior to entry, patience or lack thereof, etc. The trader who made the most effective overall combination of decisions will have the better trade results in the end. Of course, there are times when pure chance gives the better result to the worst trader.
It's very important to regard trading as a process, and to understand that as a trader, your efforts need to be focused on the activity of trading itself, as opposed to getting a quick base line answer. Because there are many things to take into consideration in making your trades successful, it’s essential that you educate and train yourself in all the different areas. Learn how to develop better trading plans and analysis methods, and then learn how to apply what you’ve developed to the process of making a trade – from the original impulse to enter or stay out of a trade to the control, of your thought processes and emotions in managing that trade.
© by Andy Jordan. Re-transmission or reproduction of any part of this material is strictly prohibited without the prior written consent of Trading Educators, Inc.
Ambush Method Trade and Performance Report
by Master Trader Marco Mayer
Educator for Forex and Futures, System Trader, and Creator of Ambush Trading Method
This week, let’s share some thoughts on support/resistance using the daily chart of the Australian Dollar Futures (6A, AUD/USD Spot Forex).
I’ve marked the most important price level in this market during the last couple of months, and that is 0.7150. Even if you don’t pay much attention to the concept of support and resistance levels in your trading, you should be aware of it.
Why? Because it’s simply too obvious to ignore. And if that is the case for you, be sure other traders are aware of it too. That is why you should have marked that exact level on your charts, because it is then a self-fulfilling prophecy. Whether you believe in it or not, others will!
How do you spot such a level of interest? Look for accumulations of swing highs/lows around the same price. On a daily chart it will never be exactly the same price, but fairly close. Also, look for levels that react on both sides, support that turns into resistance, and the other way around. The longer the timeframe in which you can spot these, the more important they usually are. Simply put, if you can see them on a weekly chart, they will also be obvious on a daily, on a 4-hour, and on an hourly chart. More traders will notice them. The other way around, you’ll have many potential levels on a 5-minute chart, but those trading on a daily chart won’t notice 90% of them (unless they mark the high/low of a day).
One more thing to notice here is how well Ambush traded at that 0.7150 level multiple times. It nicely got in around that price pretty much at the low of the days price, and then reversed at the support mark. This is to some degree accidental, since Ambush doesn’t use support/resistance directly, but it is surely a nice coincidence!
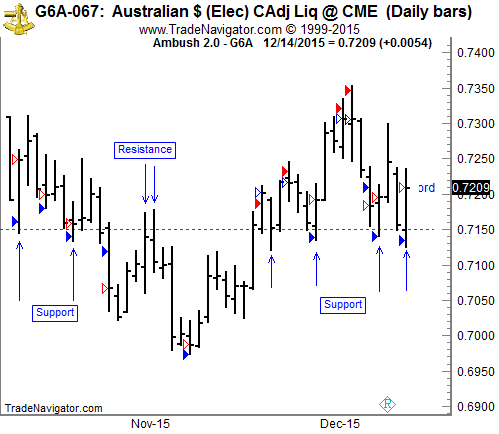
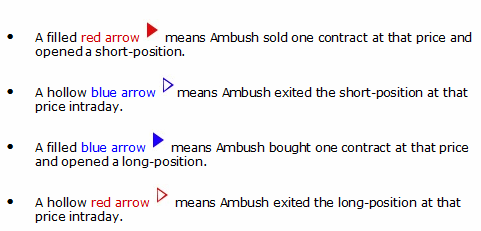
On the chart above are four different kinds of arrows:
Let's examine the results of those trades (including $10 for commissions and slippage round-turn) trading just one Australian Dollar Futures (6A) contract:
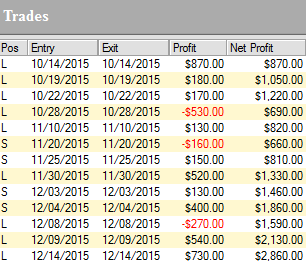
As you can see, Ambush managed to make a total of $2,860.00 profit (including $10 for commissions and slippage round-turn) trading just one contract without keeping any positions overnight!
Click on the link below to see the long-term performance of the Australian Dollar Futures (6A) and all other markets supported by Ambush:
View the Reports Now
© by Marco Mayer. Re-transmission or reproduction of any part of this material is strictly prohibited without the prior written consent of Trading Educators, Inc.
To view previous published Chart Scan newsletters, please log in or click on "Join Us," shown above, to subscribe to our free "Members Only" section.
A WEALTH OF INFORMATION & EDUCATION:
Joe Ross-Trading Educators' popular free Chart Scan Newsletter has been published since 2004.
Note: Unless otherwise noted, all charts used in Chart Scan commentary were created
by using Genesis Financial Technologies' Trade Navigator (with permission).
Legal Notice and Copyright 2015 Disclaimer - Published by Trading Educators, Inc.
Chart Scan is a complimentary educational newsletter.
© by Trading Educators, Inc. Re-transmission or reproduction of any part of this material is strictly prohibited without prior written consent.
Edition 601 - December 11, 2015

The holidays are approaching. As you prepare for your festivities, we hope you'll take the time to slow life down enough to enjoy and make many fond family memories. To help you with any last minute gift ideas, please visit our Traders Wish List.

The Law of Charts with Commentary
by Master Trader Joe Ross
Author, Trader, Trading Mentor, and Founder of Trading Educators, Inc.
Tradable Markets
Quite often I am asked about what condition a market has to be in to be tradable. Sometimes it is easier to show with a picture when a market is not tradable except for a very short-term scalper.
When prices have a "boxy" look, the market becomes very difficult to trade. What causes a boxy appearance? If you look at the chart below, I will attempt to explain.
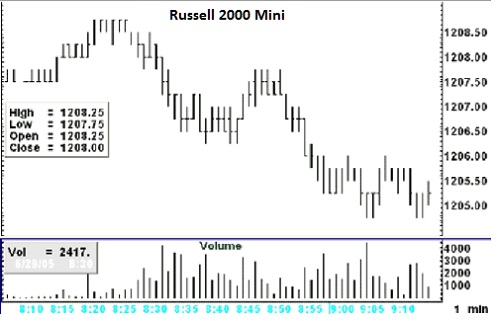
Notice the following:
- Volume at 8:30, the opening minute, is only 2,417. Three minutes later, the per-minute volume is 4,193, an acceptable amount it would seem. But is it? Volume does not take into consideration liquidity. Liquidity consists of both decent volume and good participation, meaning buyers are hitting the offer and sellers are hitting the bid. The volume of 4,193 might have involved as few as two traders.
- Prices tend to make multiple exact highs and lows, giving the chart a boxy look.
- Opens and Closes tend to cluster at the same level.
- Prices do not look much different from the way they looked in the early morning Globex trading.
If we go to a 5-minute chart, things do not look a whole lot better.
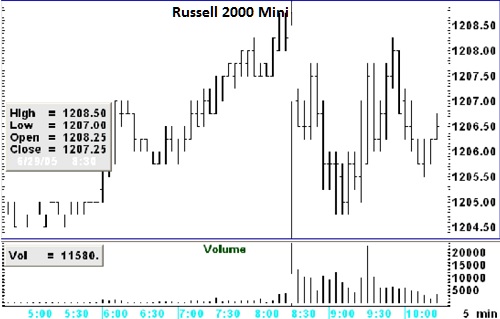
Volume in the first five minutes of trading was 11,580, which amounts to an average of only 2,316 contracts/minute. Not a very healthy volume for doing much of anything. The 5-minute chart displays the same type of problems we saw on the 1-minute chart: double highs and lows, and clusters of Opens and Closes. The boxiness of the 5-minute chart is a sign of lack of liquidity. This means that traders are not trading. The action that is going on is limited to a few traders who are literally picking each-others’ pockets.
The e-mini Russell 2000 has often been as you see it on the charts above. The situation goes back at least three years. Is it any wonder that 90% or more of newbies are getting their heads handed to them in this market? Unless you go out to the larger time frames, you are facing a very difficult situation.
© by Joe Ross. Re-transmission or reproduction of any part of this material is strictly prohibited without the prior written consent of Trading Educators, Inc.

Spread Scan with Commentary
by Master Trader Andy Jordan
Educator for Spreads, Options, Swing/Day Trading, and Editor of Traders Notebook
Last week we looked at the Japanese Yen, and we developed a trading idea using futures contracts on a breakout of the trading range. Trading the breakout idea using the Japanese Yen futures contract is high risk (about $1,000 per contract), and is not always suitable for traders with smaller trading accounts.
Traders with smaller accounts can use the Forex pair USD-JPY or the ETF with the symbol FXY, but keep in mind the ETF will not trade 24 hours (as does the Futures or the Forex pair).
Another possibility would be to use options. As you can see on the weekly chart below, the Implied Volatility for the Japanese Yen is very low at the moment. Therefore, I'd rather buy options instead of selling them (even if I am not really a friend of buying options). More specifically, I'd look into buying a March 82/84 call spread or buying a March 81/79 put spread, depending on the breakout.
Remember: we use far out-of-the-money strikes when we sell options, but we go very close with the strike when we buy options.
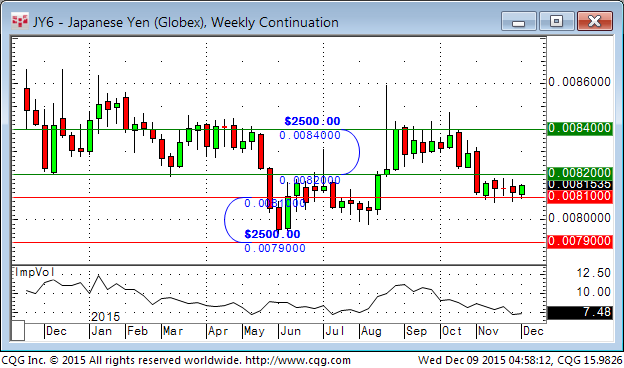
As of today, the price for spreads is approximately $700 to $800, but might be slightly higher on the breakout. The maximum profit we can make on the trade would be $2,500 – entry price.
The advantage of this strategy would be the maximum risk in form of the payed premium. The disadvantage is the limitation of the profits.
We can, of course, also buy a naked call or a naked put, but this would markedly increase the premium we have to pay for the options.
Profitable trades are attainable! To find out how to manage this and other trades, and also to receive our daily detailed trading newsletter, subscribe to Traders Notebook.
© by Andy Jordan. Re-transmission or reproduction of any part of this material is strictly prohibited without the prior written consent of Trading Educators, Inc.
Stealth Trader with Commentary
by Master Trader Andy Jordan
Educator for Spreads, Options, Swing/Day Trading, and Editor of Traders Notebook
On November 23rd, our "Stealth Trader" method generated an entry signal for the next trading day. We got long with 2 contracts on the December Russell 2000 mini (first blue arrow), and we reached our first target on the third day (first red arrow). We trailed the stop for the second lot at the low of each daily bar, and got stopped out on November 27 with a nice profit (second red arrow).
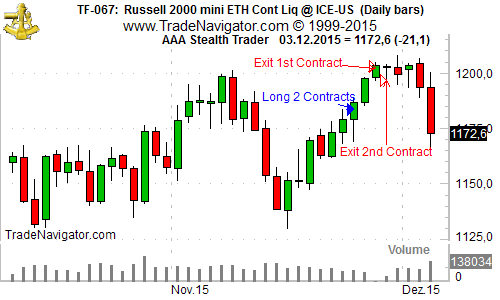
With an initial risk of approx. $1,500 per contract, the method generated a profit of $3,240 (trading two contracts).
Find out more about Stealth Trader!
© by Andy Jordan. Re-transmission or reproduction of any part of this material is strictly prohibited without the prior written consent of Trading Educators, Inc.
Trade Article
by Master Trader Marco Mayer
Educator for Forex and Futures, System Trader, and Creator of Ambush Trading Method
Hi Marco, I'm thinking of moving forward from a discretionary into a more systematic trading approach. Is it worth doing so?
That's a really good question, and one I thought about 5 years ago when I decided to dive into developing trading systems. I could tell you a lot about this topic, but here are some thoughts that might help you decide.
First of all, developing and trading systems is everything but easy. There is a steep learning curve with many challenges. If you don’t know how to program, it's even harder, since you need to learn some programming basics if you seriously want to do this.
Some more challenges are getting the right data, understanding which data to use for what (especially with futures, think about rolling contracts, etc.) and knowing the many pitfalls, such as how to avoid overfitting a system, and checking if the backtests are realistic and likely to work in the real markets. For example, you can’t imagine how easy it is to come up with a system that looks like magic in the backtest, but has zero value in the world of trading, because you didn’t think about slippage and commissions.
Now, having said all this, I personally am happy I made the transition, and wouldn't want to go back to 100% discretionary trading right now. I still enjoy it, but do only some day trading that’s not systematic. For me, the serious money is in trading systems. Here are some of the reasons:
-
A backtest will always be a backtest, but if you know how to do it right it will tell you a lot about what to expect:
- What drawdowns to expect in the future.
- When something is wrong, such as the markets changing.
- How much to risk per trade.
-
Psychologically, I find it easier to trade systematically, but don't think it's easy:
- I don’t have to make decisions every day, which is a big relief, especially on bad days.
- I don’t get burnout from watching the charts all day.
- I’m less likely to do something stupid from looking at live quotes all day.
- If there is a drawdown, I can look back and understand that it’s nothing unusual. When do you know that in discretionary trading?
-
I personally am not the most important factor anymore:
- If I am "the edge" everything depends on me and my moods, etc.
- If I have a bad day, my trading probably does too. But when I’m out of the zone for whatever reason, I can still run my systems as usual.
- And the biggest one: My trading takes just a couple of minutes a day. Even though I'm day trading some markets, I know at what time I have to place my orders, if any, and when to come back again. For some markets this is on different times each day, but it’s still just a couple of minutes in total. I am not tied to the screen anymore! A good example of such a method is the Ambush Method - it day trades, but you have to be there only at the open and the close.
Not having to babysit the markets all day gives me time to work on new systems, to improve things, or to simply do what a trader likes to do: enjoy the free time. Isn’t that why we all started?
Happy Trading!
Marco
If you don’t like to develop trading systems on your own, consider Marco’s Ambush Method. If you would like to learn about how to develop trading systems, then sign-up to be tutored by Marco to help speed up the process.
© by Marco Mayer. Re-transmission or reproduction of any part of this material is strictly prohibited without the prior written consent of Trading Educators, Inc.
To view previous published Chart Scan newsletters, please log in or click on "Join Us," shown above, to subscribe to our free "Members Only" section.
A WEALTH OF INFORMATION & EDUCATION:
Joe Ross-Trading Educators' popular free Chart Scan Newsletter has been published since 2004.
Note: Unless otherwise noted, all charts used in Chart Scan commentary were created
by using Genesis Financial Technologies' Trade Navigator (with permission).
Legal Notice and Copyright 2015 Disclaimer - Published by Trading Educators, Inc.
Chart Scan is a complimentary educational newsletter.
© by Trading Educators, Inc. Re-transmission or reproduction of any part of this material is strictly prohibited without prior written consent.
Edition 600 - December 04, 2015

This is our second newsletter using our new format and recently updated website. We've received a lot of positive feedback and have really appreciated everyone's patience while we work out a few kinks. Our CELEBRATION30 sale ends December 6, 2015. Be sure you don't miss this opportunity to save YOUR money! This edition is brought to you by our three Master Traders who are willing to share their knowledge and experience to guide you to your next level of trading. Success to you!

The Law of Charts with Commentary
by Master Trader Joe Ross
Author, Trader, Trading Mentor, and Founder of Trading Educators, Inc.
Coffee Trading
This week I will show you one of my favorite trades in Coffee, using the daily chart. I've been doing this one for many years, and it is a great trade. The trade is about inside bars, and the rules are really simple: buy one-tick above the high of an inside bar, or sell one-tick below the low of an inside bar. In case you don't know what an inside bar is, it is a bar that makes a lower high and a higher low than the one that preceded it.
You are looking for 50-100-ticks/contract - you decide based on recent volatility. Do a little back-checking to see what you could have gotten on the last 10 or 12 times this has happened.
Where does the Law of Charts (TLOC) come into the picture? Try to get in by using an intra-day Traders Trick Entry (TTE) just ahead of the breakout of the high or low of the inside bar.
Here's a daily coffee chart: if you look closely, you will see many inside bars.

I marked a couple of inside days for you to see what it is I'm talking about. Now it's your turn to go back to see what would have happened on the days there were inside bars. If only one end of the bar is inside, it doesn't count. Anything with an equal high or low does not qualify, but knowing how traders think, you will no doubt see that many of those work as well, and will mess around with the method.
We could easily sell this method, but we received so much flack for daring to sell one of our methods that I thought we should give you a freebie. Sometimes I wonder how Internet users think a company can pay its staff while just giving stuff away.
You should make enough by using this coffee method to pay for lots and lots of the resources we offer at Trading Educators.
I'll answer one and only one question about this method: if the breakout comes on both sides of the inside bar, you go both ways.
© by Joe Ross. Re-transmission or reproduction of any part of this material is strictly prohibited without the prior written consent of Trading Educators, Inc.
Trading Article with Commentary
by Master Trader Joe Ross
Author, Trader, Trading Mentor, and Founder of Trading Educators, Inc.
Planning Trades to Control Risk
The problem with many traders is that they have only half a plan, the easy half. They know how much profit they're willing to take, but they don't have the foggiest idea how much they're willing to lose. They're like a deer in the headlights, they just freeze and wait to get run over. Their plan for a position that goes south is, “Please God, let me out of this and I'll never do it again,” but that's wishful thinking, because if by chance the position turns around, they'll soon forget about their promises. They'll go back to thinking that they're geniuses, and they'll always do it again, which means that they're sure to get caught, and get caught bad.
I have a true story I’d like to share: It’s about a broker I knew and a Coffee trade he made. It goes like this:
I received a phone call from this guy moaning about a Coffee trade he was in. He was managing money and had all of his clients in this particular trade.
Coffee, at least at that time, was, and still can be, an illiquid and extremely volatile market, and is often best traded by people who have a genuine need to trade there. But he was in and in up to his neck in trouble. He said, “Joe! I don’t know what to do! If the Coffee goes down any more, I’m going to wipe out all of those accounts.” He told me he had been so sure the market would move up that he never even planned the amount of risk he was willing to take, and by the time he had determined where to put a protective stop, Coffee had shot past that point.
I told him I had no idea of how he could get out of his predicament, and that was an honest answer. I really did not know what he could do.
Apparently, he decided to pray! He called me back that evening and told me he had gone into the restroom, closed the door on the booth, and knelt down and implored God to get him out of the mess he was in. He promised that he would never again trade Coffee if God would just save his skin from disaster.
The following day, Coffee opened gap up, and moved to a point where he could get out at breakeven. He took the opportunity and got out. Later that day, Coffee moved even higher. Two weeks later, he was back trading it once again.
The broker had no plan for what he would do if the market moved against him. Whatever planning he did was done after, not before, entry into the market. His irresponsibility took unlimited risk with client accounts, having no idea of his exit point.
But perhaps worst of all, he was dishonest with both himself and his clients. He vowed to never trade that market again. Where were the discipline and self-control he needed to keep his promise?
How many of us do the same thing when we trade. We make mistakes, vow to never make them again, and then do the same dumb things all over again. We take risk without planning, or realizing just how much risk we are truly taking. Then the market teaches us a painful lesson. I think you would agree, markets are very good at doing that.
© by Joe Ross. Re-transmission or reproduction of any part of this material is strictly prohibited without the prior written consent of Trading Educators, Inc.

Spread Scan with Commentary
by Master Trader Andy Jordan
Educator for Spreads, Options, Swing/Day Trading, and Editor of Traders Notebook
Today we are looking at the Japanese Yen. As you can see on the chart below, the Yen has been trading sideways for some time (almost one month), and the volatility is very low. Traders might enter on a breakout either to the upside or the downside, with the stop at the other side of the range. First target to the downside would be 80,000 and to the upside 83,000. If the normal contract is too expensive for you, you can use the Forex or the ETF with the symbol FXY.
.png?i=027)
Profitable trades are attainable! To find out how to manage this and other trades, and also to receive our daily detailed trading newsletter, subscribe to Traders Notebook.
© by Andy Jordan. Re-transmission or reproduction of any part of this material is strictly prohibited without the prior written consent of Trading Educators, Inc.
Ambush Method Trade and Performance Report
by Master Trader Marco Mayer
Educator for Forex and Futures, System Trader, and Creator of Ambush Trading Method
This week we are looking at the Henry Hub Natural Gas Futures (NG) traded at the NYMEX.
There’s one question regarding Ambush that is frequently asked, and that is if Ambush can be combined with the Law of Charts (TLOC).
My answer to this is that not only can it be combined with other trading methods, but it’s actually a good idea to do so!
Let’s look at the example below. As you can see on the chart, we have been very happy with the various recent Ambush trades with positive results. But we’ve also seen a consolidation (red box) and a breakout giving us a Ross Hook (RH) on the first correction of that breakout. One way to enter here would have been by using the Traders Trick Entry (TTE)!

On the chart above are four different kinds of arrows:

Let's examine the results of those trades (including $10 for commissions and slippage round-turn) trading just one Henry Hub Natural Gas Futures (NG) contract:

As you can see, Ambush managed to make a total of $3,280 profit (including $10 for commissions and slippage round-turn) trading just one contract, without keeping any positions overnight!
Click on the link below and look at the menu on the right to see the long-term performance of the Henry Hub Natural Gas Futures (NG) and all other markets supported by Ambush:
View The Reports Now
© by Marco Mayer. Re-transmission or reproduction of any part of this material is strictly prohibited without the prior written consent of Trading Educators, Inc.
To view previous published Chart Scan newsletters, please log in or click on "Join Us," shown above, to subscribe to our free "Members Only" section.
A WEALTH OF INFORMATION & EDUCATION:
Joe Ross-Trading Educators' popular free Chart Scan Newsletter has been published since 2004.
Note: Unless otherwise noted, all charts used in Chart Scan commentary were created
by using Genesis Financial Technologies' Trade Navigator (with permission).
Legal Notice and Copyright 2015 Disclaimer - Published by Trading Educators, Inc.
Chart Scan is a complimentary educational newsletter.
© by Trading Educators, Inc. Re-transmission or reproduction of any part of this material is strictly prohibited without prior written consent.
Edition 598 - November 20, 2015

The team at Trading Educators is proud to announce the fresh, new look in our newsletter and website. You will still receive our high quality products and services with the most noticeable changes being an easier and more logical flow throughout our website. Happy Trading!
GRAND RE-OPENING SALE ~ 30% OFF*
Coupon Code: CELEBRATION30
Offer ends December 6, 2015
* This offer excludes 1-month subscription products and private tutoring

The Law of Charts with Commentary
by Master Trader Joe Ross
Author, Trader, Trading Mentor, and Founder of Trading Educators, Inc.
Old-Fashioned Chart Reading
The law of charts is to a large extent about chart reading, and chart reading incorporates some of the observations traders made over 100 years ago.
While these kinds of observations do not follow the strict rules of the Law of Charts, they are interesting, and it is exciting to see them work. Of course, we know that nothing works all the time, but it might be interesting to follow the chart of an investment (see the chart below).
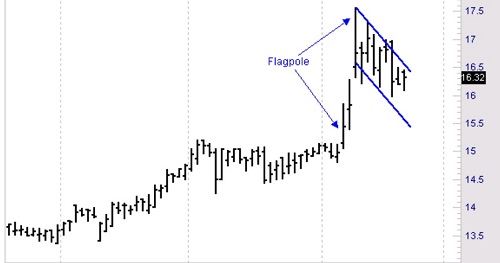
The “wisdom of the ages” states that following a breakout from consolidation, if prices shoot up creating what looks like a “flagpole,” and are then followed by a flag or pennant formation such as you see on the chart, when prices resume rising, they will rise again by the height of the flagpole. The flagpole begins its ascent at 15.20, which is a violation of the high of the consolidation. Prices then rise to a high of 17.56, so the total height of the flagpole is 2.36.
The low of the pennant formation is 15.98. Therefore the projection is that prices will rise to at least 18.34.
© by Joe Ross. Re-transmission or reproduction of any part of this material is strictly prohibited without the prior written consent of Trading Educators, Inc.

Spread Scan with Commentary
by Master Trader Andy Jordan
Educator for Spreads, Options, Swing/Day Trading, and Editor of Traders Notebook
This week, we're looking at LEJ16 – HEJ16: long April 2016 Live Cattle and short April 2016 Lean Hogs (CME at Globex).
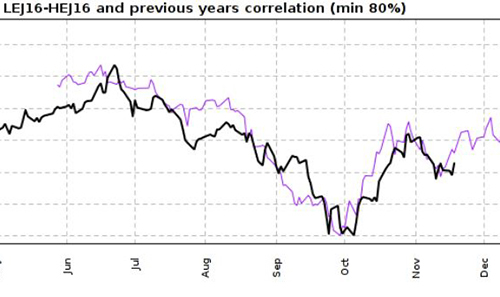
Today we consider an inter-market spread in the meats: long April 2016 Live Cattle and short April 2016 Lean Hogs (elec. symbols: LEJ16 – HEJ16). This spread has been nicely following the correlation chart (correlated with the years 1976 and 1983, see chart above) and we might see a strong up-move during the next few days. In addition to the close correlation to the years 1976 and 1983 there is a strong seasonal up-move in the time between 11/24 and 12/21.
Find out more about how to manage this and other trades in our daily detailed trading newsletter Traders Notebook.
© by Andy Jordan. Re-transmission or reproduction of any part of this material is strictly prohibited without the prior written consent of Trading Educators, Inc.
Stealth Trader with Commentary
by Master Trader Andy Jordan
Educator for Spreads, Options, Swing/Day Trading, and Editor of Traders Notebook
On November 4th, our method "Stealth Trader" generated an entry signal for the next trading day. We got short with 2 contracts: December Copper (first red arrow), and we reached our first target on the second day (first blue arrow). We are still in the trade with one contract using a simple trailing stop at the high of each daily bar (second blue arrow).
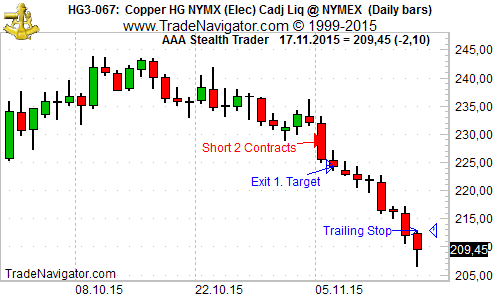
With an initial risk of approximately $1,100.00 per contract, the method generated a profit of $1,140.00 on the first contract, with an open equity of about $4,840.00 on the second contact.
Learn more about Stealth Trading!
© by Andy Jordan. Re-transmission or reproduction of any part of this material is strictly prohibited without the prior written consent of Trading Educators, Inc.
Trading Article
by Master Trader Marco Mayer
Educator for Forex and Futures, System Trader, and Creator of Ambush Trading Method
Hi Marco, looking at the successful large hedge funds who’re considered to be the best in the industry, is it really possible to outperform them?
That’s a really good question, and it can lead to some interesting insights - especially since the best performers often don't do better than making 10-15% a year, which for most retail traders with small accounts simply wouldn’t be worth the effort, right? What’s the point of making 10% on a $10,000 account in a year by day trading, when you’d make more by flipping burgers?
While most traders focus on what they consider the big advantage of large funds over retail traders, that is tons of capital, I have to strongly disagree. Nothing could be further from the truth, and talking to any successful CTA who started out with $100,000 and had a great performance for many years - as soon as the big money discovers them, that’s when things start to get much more difficult.
Imagine you have found a system that works great in a couple of markets like the DAX, Gold, and the E-Mini S&P 500. You have to get in and out of these markets multiple times a day. No problem to do that with 5 contracts in the DAX or gold, and for sure not in the S&P 500. You manage to achieve 50% a year for 3 years in a row. Of those 50%, 40% come out of the DAX and Gold trades, 10% you make in the ES.
At that point, big money gets interested in your fund, and now instead of managing half a million, you have 10 million to manage. Very quickly you start noticing the results of your system getting much worse due to lots of slippage in the DAX and Gold futures, and you’re forced to more actively trade the market which performed worst, the E-Mini S&P 500.
While more money comes in, you have to close the fund to new investors, think about new markets to trade, and how to adjust your system in the DAX and Gold markets. You develop new entry-techniques using limit-orders only, and limiting the trading times in those markets. This way you can still get a nice performance, but much less than before.
To make a long story short, yes, I think it’s possible to strongly outperform the big guys since it’s considerably easier to make 50% on a $10,000 account than on a $10,000,000 account! Think about it.
If you like, take it one step further and use that as an inspiration to think about what you can do by trading one contract in the DAX or any other small market, that you couldn’t do with 100 contracts. This might result in some interesting trading strategies...at least it did for me.
Happy Trading!
Marco
© by Marco Mayer. Re-transmission or reproduction of any part of this material is strictly prohibited without the prior written consent of Trading Educators, Inc.
To view previous published Chart Scan newsletters, please log in or click on "Join Us," shown above, to subscribe to our free "Members Only" section.
A WEALTH OF INFORMATION & EDUCATION:
Joe Ross-Trading Educators' popular free Chart Scan Newsletter has been published since 2004.
Note: Unless otherwise noted, all charts used in Chart Scan commentary were created
by using Genesis Financial Technologies' Trade Navigator (with permission).
Legal Notice and Copyright 2015 Disclaimer - Published by Trading Educators, Inc.
Chart Scan is a complimentary educational newsletter.
© by Trading Educators, Inc. Re-transmission or reproduction of any part of this material is strictly prohibited without prior written consent.
More...
Edition 599 - November 27, 2015

The team at Trading Educators is proud to announce the fresh, new look in our newsletter and website. You will still receive our high quality products and services with the most noticeable changes being an easier and more logical flow throughout our website. Happy Trading!

The Law of Charts with Commentary
by Master Trader Joe Ross
Author, Trader, Trading Mentor, and Founder of Trading Educators, Inc.
A 15-Minute Chart of the Euro/Dollar Forex Pair
"Trading by the Book" states that if prices break out of a trading range in one direction and then reverse and come through that range in the other direction, it is time to "sell the store."
However, looking at the chart below, we see that there was little way to know that such a thing would happen after the upside breakout of the trading range which was caused by an economic report.
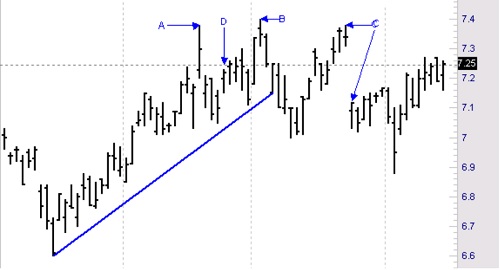
Nevertheless, the Law of Charts came to the rescue by providing a Reverse Ross hook.
The question is this: is the Reverse Ross hook telling us that momentum has truly changed, and should we risk going short based on a Traders Trick entry? Please note that a Reverse Ross hook can be somewhat different from a 1-2-3 high. A 1-2-3 high comes only at the end of a trend or a swing, but we have neither at the time in question.
We have an upside breakout of a trading range, and then a Ross hook due to the fact that following the breakout of the trading range, prices failed to go higher. So the formation I’ve labeled a-b-c is what is known as a Reverse Ross hook (RRh). The RRh is discussed in detail in my book "Trading the Ross Hook."
There is a reliable way to know with a high degree of certainty whether or not to use the Traders Trick to try to get into the trade. It is a specialized use of the stochastic study. The settings are nothing special, 5-3-3. It is the use that is special. If the fast stochastic has crossed below the slow stochastic at the time you seek to enter the trade, then it is a low risk opportunity to enter short using a tight stop for protection. The graph is not very clear because of the colors I used, but if you look closely, you can see the upper dotted line (the fast Stochastic) cross the lower line (the slow Stochastic). The result of taking the trade was a handsome profit.
© by Joe Ross. Re-transmission or reproduction of any part of this material is strictly prohibited without the prior written consent of Trading Educators, Inc.

Spread Scan with Commentary
by Master Trader Andy Jordan
Educator for Spreads, Options, Swing/Day Trading, and Editor of Traders Notebook
Sugar has been moving higher since September, almost reaching the January high. As we note from the chart below, Commercials are extremely net short at the moment, while the Large Speculators can be found at the other extreme to the long side. While this is not a guarantee that the market will turn around and move lower, there is at least a good chance that the market will not move much higher at the moment. We consider selling calls under these conditions, but with the idea of hedging the calls with some puts as soon as the market starts to shoot higher again.
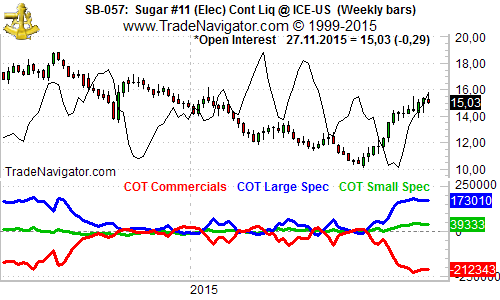
Find out more about how to manage this and other trades in our daily detailed trading newsletter Traders Notebook.
© by Andy Jordan. Re-transmission or reproduction of any part of this material is strictly prohibited without the prior written consent of Trading Educators, Inc.
Trading Article with Commentary
by Master Trader Andy Jordan
Educator for Spreads, Options, Swing/Day Trading, and Editor of Traders Notebook
Benefits of Long-Term Charts
The longer term charts can be very revealing, even if you are a shorter term trader. Longer term charts are educational, and definitely help you to see things in perspective. Pay attention to what you see, and analyze in accordance with the following questions:
Note the yearly ranges for the commodities you trade. What is this yearly high and low, are they higher highs, lows and closes compared with last year? Does the close confirm price action? What is the long-term trend? How does this year's range compare with the last three years' average range? Should next year have greater volatility than this year? How much, in dollars, was the price move from the annual lowest low to highest high? How much did you take out of that range? What should next year's high and low be for the commodities you trade, based on the yearly trend analysis?
These questions define the yearly long-term price bars, using the monthly price bars to answer them. Use weekly price bars to answer major trend questions for monthly highs and lows.
© by Andy Jordan. Re-transmission or reproduction of any part of this material is strictly prohibited without the prior written consent of Trading Educators, Inc.
Ambush Method Trade and Performance Report
by Master Trader Marco Mayer
Educator for Forex and Futures, System Trader, and Creator of Ambush Trading Method
It’s time to look at the stock market again, after all the examples about currencies and commodities! This week, I've chosen one of the less popular futures markets among traders, the EuroSTOXX 50, traded at Eurex.
It seems that retail traders usually prefer the DAX, since there’s more action, and the tick value is much higher. In my opinion, the DAX tick is too high for most traders, often leading to margin calls. Happily, there’s a Mini-DAX Futures now, which I think has a lot of potential!
For a strategy like Ambush that require larger stops, the EuroSTOXX is a much better choice for most traders. It’s also easier to predict, and has less noise and fewer crazy moves than the DAX. Plus, there’s a lot more volume in the EuroSTOXX.
Looking at the daily chart of the FESX, we can see tons of consolidations, hard to predict price moves, and many reversal-bars or other bars with long-tails. This is perfect for Ambush, which was built to exploit exactly that kind of market action!
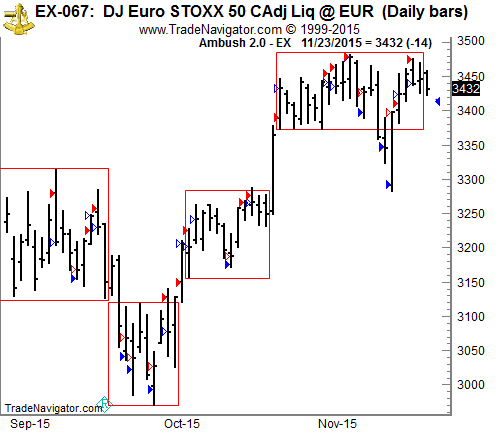
On the chart above are four different kinds of arrows:

Let's examine the results of those trades (including $10 for commissions and slippage round-turn) trading just one EuroSTOXX 50 Futures (FESX) contract:
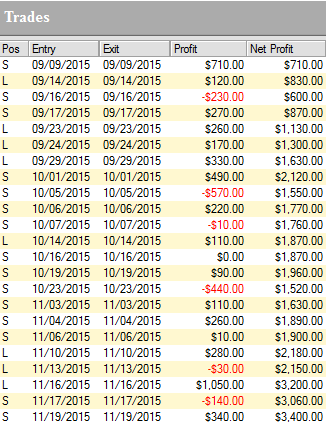
As you can see, Ambush managed to make a total of $3,400.00 profit (including $10 for commissions and slippage round-turn) trading just one contract without keeping any positions overnight!
Click on the link below to see the long-term performance of the EuroSTOXX 50 Futures (FESX) and all other markets supported by Ambush:
View The Reports Now
© by Marco Mayer. Re-transmission or reproduction of any part of this material is strictly prohibited without the prior written consent of Trading Educators, Inc.
To view previous published Chart Scan newsletters, please log in or click on "Join Us," shown above, to subscribe to our free "Members Only" section.
A WEALTH OF INFORMATION & EDUCATION:
Joe Ross-Trading Educators' popular free Chart Scan Newsletter has been published since 2004.
Note: Unless otherwise noted, all charts used in Chart Scan commentary were created
by using Genesis Financial Technologies' Trade Navigator (with permission).
Legal Notice and Copyright 2015 Disclaimer - Published by Trading Educators, Inc.
Chart Scan is a complimentary educational newsletter.
© by Trading Educators, Inc. Re-transmission or reproduction of any part of this material is strictly prohibited without prior written consent.
Enjoy Our Past Newsletter Editions
Edition 1081 - June 13, 2025
Edition 1080 - June 6, 2025
Edition 1079 - May 30, 2025
Edition 1078 - May 23, 2025
Edition 1077 - May 16, 2025
Edition 1076 - May 9, 2025
Edition 1075 - May 2, 2025
Edition 1074 - April 25, 2025
Edition 1073 - April 18, 2025
Edition 1072 - April 11, 2025
Edition 1071 - April 4, 2025
Edition 1070 - March 28, 2025
Edition 1069 - March 21, 2025
Edition 1068 - March 14, 2025
Edition 1067 - March 7, 2025
Edition 897 - September 10, 2021 SPECIAL EDITION - IN MEMORIAM


