

Newsletters (208)
Children categories
Edition 684 - July 21, 2017


Chart Scan with Commentary - Mutual Funds
by Master Trader Joe Ross
Author, Trader, Trading Mentor, and Founder of Trading Educators, Inc.
Developer of Instant Income Guaranteed
We received a question asking whether or not the Law of Charts works with Mutual funds. The answer is yes it does but the concept is more easily seen on a weekly chart because daily charts show only the Closing price for mutual funds.
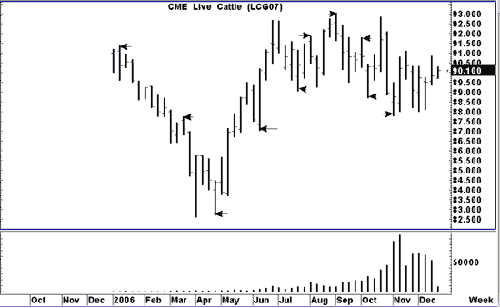
The chart shown is Oppenheimer Gold and Special Minerals Class Y mutual fund, which rises when the with the price of gold and other minerals, and falls and falls when the price of gold and other minerals fall. Please note: Some mutual funds are inverse funds where shares in the fund rise when prices fall, and fall when prices rise. The chart shows the entry on a breakout from a Trading Range on exactly the 29th weekly bar. The breakout is that long bar you see as prices break through the Trading Range. The Law of Charts states that breakouts from consolidations are most likely to occur on bars 21-29.
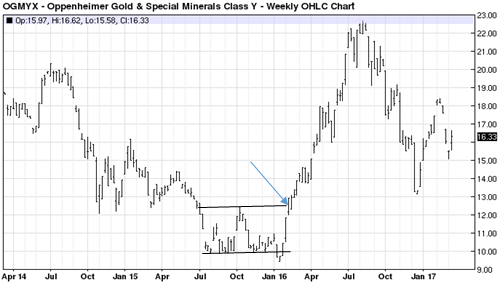
The arrow shows a potential entry one tick above the high of the range. Notice that share prices have recently formed a 1-2-3 low.
© by Joe Ross. Re-transmission or reproduction of any part of this material is strictly prohibited without the prior written consent of Trading Educators, Inc.
Trading Article - The Nature of the Trading Business
by Master Trader Joe Ross
Author, Trader, Trading Mentor, and Founder of Trading Educators, Inc.
Developer of Instant Income Guaranteed
Consider the following: As a trader you are in a business. Your strongest opponent has plenty of capital. He follows a program and he does it without emotion. He is totally aware of the fact that no one knows where the next tick will fall. Whereas he usually has good insights regarding the major forces that drive the market, he does not fool himself into thinking he can explain the vagrancies of price movement intraday or even from day to day. He knows that no one truly can. The successful trader has learned his lessons by actually trading. This is a business driven by fear, greed, and selfishness, and very few worthwhile pointers are given out by the industry, other traders, or the myriad of so-called trading gurus who plague the pages of trading magazines and pages of their websites. The most valuable information is closely guarded and not often put in books or on web pages. Learning about trading is a ‘forever’ experience. As the markets change and as we adjust to them, we learn. The learning is ongoing. It stops only when you no longer trade. During the time we trade we can always improve. Trading is a great business for those who master it, and those who master it are traders who have mastered themselves.
© by Joe Ross. Re-transmission or reproduction of any part of this material is strictly prohibited without the prior written consent of Trading Educators, Inc.

Instant Income Guaranteed - FITB Trade
Philippe Gautier: Administration and New Developments
Developer: Joe Ross
On 20th June 2017 we gave our IIG subscribers the following trade on Fifth Third Bancorp (FITB). We sold price insurance as follows:
- On 21st June 2017, we sold to open FITB Jul 21 2017 23P @ $0.15, with 30 days until expiration and our short strike 10% below price action.
- On 10th July 2017, we bought to close FITB Jul 21 2017 23P @ $0.05, after 19 days in the trade.
Profit: $10 per option
Margin: $460
Return on Margin Annualized: 41.76%
With implied volatility extremely low, we still managed to sell price insurance 10% below price action and below a major support level.
We have also added new types of trades for our IIG daily guidance since 2016, "no loss" propositions with unlimited upside potential, still using other people's money to trade.
Philippe

Receive daily trade recommendations - we do the research for you!
Instant Income Guaranteed
♦ SIGN UP TODAY! THIS IS WORTH THE INVESTMENT ♦
© by Joe Ross and Philippe Gautier. Re-transmission or reproduction of any part of this material is strictly prohibited without the prior written consent of Trading Educators, Inc.

Trading Idea - Soybean Oil (CBOT on Globex)
by Professional Trader Andy Jordan
Educator for Spreads, Options, Swing/Day Trading, and
Editor of Traders Notebook Complete and Traders Notebook Outrights
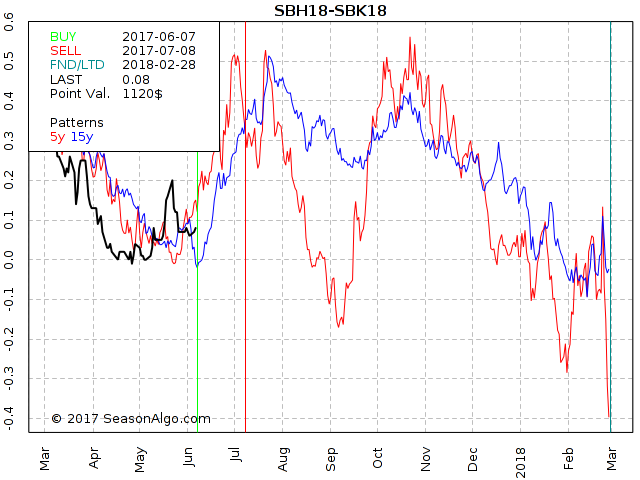
This week, we're looking at short ZLZ17 – ZLH18: short December 2017 and long March 2018 Soybean Oil (CBOT on Globex).

Today we consider a Soybean Oil calendar spread: short December 2017 and long March 2018 Soybean Oil (chart above). The spread has been trading sideways for a long time making slightly higher lows with highs around -0.2. For an entry it either needs to break to the down-side or move back up to the upper side of the range.
Also the seasonal statistic looks promissing with 14 winners during the last 15 years and a max. daily drawdown of only $192 in 2011.
Do you want to see how we manage this trade and how to get detailed trading instructions every day?
Traders Notebook Complete
Please visit the following link:
Yes, I would like additional information!
© by Andy Jordan. Re-transmission or reproduction of any part of this material is strictly prohibited without the prior written consent of Trading Educators, Inc.

Trading Article - Trading Related Questions
by Professional Trader Marco Mayer
Educator for Forex and Futures, Systematic Trader, and
Creator of Ambush Trading Method, Ambush Signals, and AlgoStrats.com
I would like to share a video that provides answers to trading related questions. Feel free to This email address is being protected from spambots. You need JavaScript enabled to view it. with any questions or whatever is on your mind about trading.
Happy Trading,
Marco
© by Marco Mayer. Re-transmission or reproduction of any part of this material is strictly prohibited without the prior written consent of Trading Educators, Inc.
Check out our Blog!
To view previous published Chart Scan newsletters, please log in or click on "Join Us,"
shown above, to subscribe to our free "Members Only" section.
A WEALTH OF INFORMATION & EDUCATION:
Joe Ross-Trading Educators' popular free Chart Scan Newsletter has been published since 2004.
Note: Unless otherwise noted, all charts used in Chart Scan commentary were created
by using Genesis Financial Technologies' Trade Navigator (with permission).
Legal Notice and Copyright 2017 Disclaimer - Published by Trading Educators, Inc.
Chart Scan is a complimentary educational newsletter.
© by Trading Educators, Inc. Re-transmission or reproduction of any part of this material is strictly prohibited without prior written consent.
Edition 683 - July 14, 2017

Chart Scan with Commentary - TTE Rule
by Master Trader Joe Ross
Author, Trader, Trading Mentor, and Founder of Trading Educators, Inc.
Developer of Instant Income Guaranteed
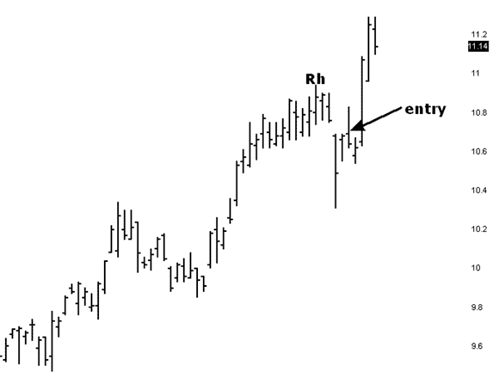
The chart below shows something I feel we need to learn about the Traders Trick (TTE). Prices reached a high of 10.94 and then retraced for two days. Those two days made identical highs [at 10.90]. Prices then dropped again, and again we had two identical highs [at 10.69]. The TTE rules say that after 4 bars of correction you are no longer to enter a trade based on the TTE. However, the rules also state that when expecting a continuation towards the upside, equal highs count as only one bar of correction (retracement). So, although we have 4 bars in the correction, because of the equal highs we count this as only two bars of correction. Now you can see why we made an entry 1 tick above 10.69. What happened afterwards is of no consequence to the rule I am showing you here. In accordance with your money and trade management, you made a little, took a loss, or made a lot on this trade. I will tell you only that we made a little.
© by Joe Ross. Re-transmission or reproduction of any part of this material is strictly prohibited without the prior written consent of Trading Educators, Inc.
Trading Article - Information Overload
by Master Trader Joe Ross
Author, Trader, Trading Mentor, and Founder of Trading Educators, Inc.
Developer of Instant Income Guaranteed
Do you do an awful lot of research into a market before you attempt to take a trade in it? Do you look at fundamentals and try to glean as much information as you can about the underlying? Do you feel that you are doing a more than adequate job of information seeking, but are still not as much as a breakeven trader? Are you beginning to feel that you are doing something wrong?
Well, it could be that you are suffering from information overload. It could also be that you are gathering information about the wrong things. People have a tendency to believe that the accuracy of their trading increases with more information. This is one of the illusions of knowledge—that more is somehow better—that more information increases your knowledge about something and improves your decision- making ability. But that is not necessarily true—increased levels of information do not always lead to greater knowledge. There are three reasons for this. First, people tend to interpret new information as confirmation of what they previously believed. You believe what you want to believe—you are biased, even if you are not conscious of the fact. Second, some information doesn't help us at all in making predictions, and can even mislead us. Finally, we often do not have the training, experience, or skills to interpret the information correctly.
You have to closely examine the kind of information you are looking at and determine its real value to the markets you are trying to trade. I have seen traders keeping elaborate records of everything they are doing as they trade. They keep files full of articles and reference materials which they pore over prior to making a trade. But is all this really necessary? I doubt it. It is much better to trade what you see without having to find justification for every trade through research.
© by Joe Ross. Re-transmission or reproduction of any part of this material is strictly prohibited without the prior written consent of Trading Educators, Inc.
Instant Income Guaranteed - EWW Trade
Philippe Gautier: Administration and New Developments
Developer: Joe Ross
On 14th June 2017 we gave our IIG subscribers the following trade on iShares MSCI Mexico Investable ETF (EWW). We sold price insurance as follows:
- On 15th June 2017, we sold to open EWW Jul 28, 2017 49.5P @ $0.38, with 43 days until expiration and our short strike 9% below price action.
- On 7th July 2017, we bought to close EWW Jul 28, 2017 49.5P @ $0.10, after 22 days in the trade.
Profit: $28 per option
Margin: $990
Return on Margin Annualized: 46.92%
We have also added new types of trades for our IIG daily guidance since 2016, "no loss" propositions with unlimited upside potential, still using other people's money to trade.
Philippe

Receive daily trade recommendations - we do the research for you!
Instant Income Guaranteed
♦ SIGN UP TODAY! THIS IS WORTH THE INVESTMENT ♦
© by Joe Ross and Philippe Gautier. Re-transmission or reproduction of any part of this material is strictly prohibited without the prior written consent of Trading Educators, Inc.
Latest Blog Post - Overtrading
by Professional Trader Andy Jordan
Educator for Spreads, Options, Swing/Day Trading, and
Editor of Traders Notebook Complete and Traders Notebook Outrights
My latest blog post points out 5 mistakes when it comes to overtrading. Read more.
© by Andy Jordan. Re-transmission or reproduction of any part of this material is strictly prohibited without the prior written consent of Trading Educators, Inc.
Trading Article - What you should know about winning percentage
by Professional Trader Marco Mayer
Educator for Forex and Futures, Systematic Trader, and
Creator of Ambush Trading Method, Ambush Signals, and AlgoStrats.com
The winning rate or percentage of winning trades are very common statistics. And while it can be a useful metric, it can also be misleading, so let's have a look!
The winning rate or winning percentage tells you how much percent of the trades in a backtest (or real past trades) have been winning trades. So if you have 100 trades in total, and 75 of those trades closed with a profit, you have a winning rate of 75%. Now the first thing to notice here is how those winning trades are defined. Are breakeven-trades included? What about commissions? If you have 100 winning trades in the E-Mini Dow Future and each of those trades was closed at 1 tick profit ($5) and you pay $7.50 per round turn, you actually lost money even if you hit your profit target 100% of the time.
Which leads us to the next question. What was your profit to loss ratio? Without knowing how much money was made on the winning trades and how much was lost on the losing trades, the winning rate is completely useless. Here’s an extreme example. Let’s say you have 90 out of 100 winning trades, a winning rate of 90%. Sounds great right? But what if on average you had an average profit of $100 per winning trade ($100 x 90 = $9000) but an average loss of 1000$ per losing trade ($1000 x 10 = $10000)? Right, you'd have lost $1000 even with a winning rate of 90%. Of course, this also works the other way around, if you only have 10% winners, but those are 10 times the size of your 90% losing trades, you’ll come out ahead!
Don't forget to always have a look at the profit/loss ratio and don't get all excited right away if you see a very high winning rate.
Happy Trading,
Marco
© by Marco Mayer. Re-transmission or reproduction of any part of this material is strictly prohibited without the prior written consent of Trading Educators, Inc.
Check out our Blog!
To view previous published Chart Scan newsletters, please log in or click on "Join Us,"
shown above, to subscribe to our free "Members Only" section.
A WEALTH OF INFORMATION & EDUCATION:
Joe Ross-Trading Educators' popular free Chart Scan Newsletter has been published since 2004.
Note: Unless otherwise noted, all charts used in Chart Scan commentary were created
by using Genesis Financial Technologies' Trade Navigator (with permission).
Legal Notice and Copyright 2017 Disclaimer - Published by Trading Educators, Inc.
Chart Scan is a complimentary educational newsletter.
© by Trading Educators, Inc. Re-transmission or reproduction of any part of this material is strictly prohibited without prior written consent.
Edition 682 - July 7, 2017

Chart Scan with Commentary - Strategy
by Master Trader Joe Ross
Author, Trader, Trading Mentor, and Founder of Trading Educators, Inc.
Developer of Instant Income Guaranteed
I had a bit of fun scalping the eMini S&P 15-minute chart. I figured out that the best time to do it was between 07:30 AM U.S. and 14:45 PM (Central Time). Sometimes the best trades are made simply by just looking around for stuff to do, and what I saw in the eMini S&P from past days gave me a chance to test a strategy I was thinking about using.
Caution: When using a strategy such as the one I will show you, don't expect it to work all the time, or for a very long time. No doubt, shortly after this issue of Chart Scan comes out, it will stop working. Do you want to know why? It's because if a lot of people jump onto it, the market will adjust, and the strategy will stop working.
There is a wise saying which came into being primarily since the advent of mechanical trading systems, and it goes something like this: "Your system will stop working when someone else builds his system based on your system." Can you see the truth in that? It is because of that reality that it is best to scout around for what may be working recently, and why it is a waste of time to backtest a system or method to see if it has worked for the last 10 years. You can't trade history you are forced to trade the present in an attempt to take advantage of the future.
When scalping, it is vital to understand the mind set needed for this kind of activity. You must not allow yourself to look for the big trade. You must not allow yourself to look for how much you can make by riding a winner. The discipline calls for seeking a set number of ticks, pips, or points, and then taking your money. You must have absolutely no regrets about missing out on what happens after you have taken your money--you must exit at your money objective. This is not to say that you cannot come up with a management scheme that allows for only part of your money to be taken at an objective, and then developing a scheme for trailing a stop in case the move continues. You might even have two objectives for a trade, maybe more.
The idea behind a scalp trade is to find a very high percentage trade and then use a lot of shares or contracts, so that you make a pile of money on only a very small move. You have to be fast, so I suggest you do this kind of scalping only in fully electronic markets like the eMini S&P. Also, be sure there is sufficient volume to enable your scalp. You will be badly hammered by the market if you go long with a lot of size in a market that is not trading sufficient volume to handle that size in the time interval you are trading.
Example: A market is trading a volume of only 70 contracts in a 15-minute period, and you enter with a 50 lot. You will definitely move the market, and there will be only 35 potential fills to take the other side of your trade. You would be overtrading.
Example: A stock is trading a volume of 9,000 shares in a 15-minute period, and you decide to enter a trade for 5,000 shares. Do you see what will happen to you? There are only 4,500 potential fills for your position. You would be overtrading.
With those things in mind, and probably a few I've forgotten, let's look at how I traded the eMini S&P.
I have placed arrows pointing to the available trades. My objective was to get .75 per trade on a lot of contracts. There were 6 trades in all, and 100% winners. One of the trades made only .50 and one made only .25. The remaining 4 trades made .75. Total made was 3.75 points. On the surface, that is not a lot for a day's work. But I did a lot of contracts. I'm not telling how many, but you can figure out for yourself how many you need to do. If you wanted to make $1,875 you would have had to trade a 10 lot. Of course, that would have been the gross amount. Commissions and fees would have reduced your take-home pay.
What was the magic method? Here it comes, but it is not the Holy Grail of trading. The five trades were all breakouts of inside bars, bought or sold at the high or low of the inside bar. Take a look:
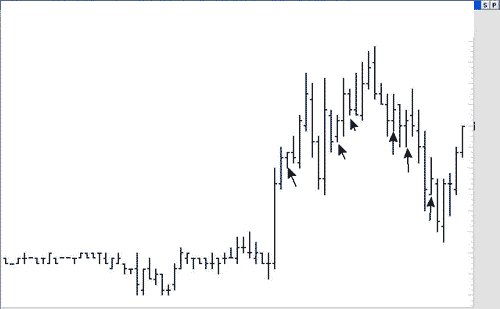
What does all this have to do with the Law of Charts? The Law of Charts states that the breakout of the high or low of any bar is an entry signal. In my book Day Trading, I describe major, intermediate and minor entry signals. Every book or article I've written, every seminar or webinar I've given, is and has been, in one way or another, based on the Law of Charts. If you haven't studied it, get it. There is no charge for it.
© by Joe Ross. Re-transmission or reproduction of any part of this material is strictly prohibited without the prior written consent of Trading Educators, Inc.
Trading Article - Pulling the Trigger
by Master Trader Joe Ross
Author, Trader, Trading Mentor, and Founder of Trading Educators, Inc.
Developer of Instant Income Guaranteed
Dear Joe, Sometimes I absolutely dread sitting down to trade. I have had so many bad experiences that I’m not sure I can pull the trigger. Is there anything I can do about it?
What happens to us as we trade colors the way we see things in the market and influences the way we approach them. We take a big hit in a particular market, and we decide never to trade there again. Or, when we have a great trade in a market, it produces pleasure, so we try to trade there again as soon as we can.
How do you envision the markets overall? More importantly, how do you conceive of your role in the market? Do you see the markets as potentially hazardous arenas in which you must be very, very careful? Do you see them as though everyone in them is out to take your money? Or do you view them as a place in which there is dynamic profit opportunity?
Each time you sit down to your trader workspace, do you feel uncomfortable and wish you were somewhere else? Or are you really eager to jump into your work, look over your charts, and get down to trading? Does plowing through new material feel like a lot of hard work, or does it excite you to learn new information that will add to your ability as a trader?
The way you envision the markets will have a powerful influence on your actions! So it's absolutely necessary for you to be very much aware of just what your perception is and what past experiences colored your perception. You need to honestly assess your vision of - and feelings towards - the markets and your role in them. It will surely be time well spent.
Here's something to think about: the longer you sit in front of your screen, the more bad experiences you are going to have. The thing that defeats most day traders is that of overtrading. As you continue to sit in front of your trading screen, your focus and your sensibilities become increasingly numb. The longer you sit there, the more the probabilities increase in favor of your making bad decisions and wrong trades.
Let me ask you a question that may put the entire situation into perspective for you. Have you ever seen old people in a nursing home sitting hour upon hour staring at the TV screen? If you haven't, can you picture what it would be like? Almost everyone has seen people who either by choice or circumstance, sit all day watching TV. They sit and watch the "boob tube" hour after hour. What do you suppose this is doing for their minds? Do you think they are becoming increasingly sharp? Is sitting there all day helping them to grow? What would you say is happening to their minds? Are they not going to suffer from an increasing amount of atrophy as they fail to think - as they fail to use their minds?
When I see a trader sitting in front of his trading screen all day long, it generates the same kind of picture for me as when I see someone watching TV all day. They are destroying their minds. At least with TV you might learn something. But what are you learning watching a cursor tick up and down hour after hour?
Trading is a terrible occupation if all you do is trade. Taking signals from a mechanical trading system is one of the most mind numbing, emotionally crippling things anyone can do. The shorter the time frame being watched, the worse it is. Is it any wonder that 90% or more of wannabe day traders last only 3-6 months in the market?
A successful trader has two major things going for him/her: 1. Plenty of money to have an excellent life-style. 2. Plenty of time to do some good in this world. But if you sit and trade all day, what do you have to show for it in the end? What have you produced that is of benefit to anyone but yourself?
I'll let you answer that. But my suggestion to you is that you strive to trade less, not more. Learn what the good trades look like, and then trade them only when they occur. And when they do occur, focus your money - trade as many contracts on the good trades as you can. Don't trade more of the time on lots of trades, trade lots of contracts less of the time on the good trades.
Use your time and money to help those less fortunate than you. After all is said and done, it is more blessed to give than to receive. Do you know what the word "bless" means? It is a verb meaning to "make happy." Paraphrased, that old saying translates to "you will be a happier person if you 'give,' than if all you do is strive to 'get.'" But if you are busy spending all your time on a 1-minute chart trying all day long to get, you're not going to be able to get much of the happiness that is available from giving.
© by Joe Ross. Re-transmission or reproduction of any part of this material is strictly prohibited without the prior written consent of Trading Educators, Inc.
Instant Income Guaranteed - TXT Trade
Philippe Gautier: Administration and New Developments
Developer: Joe Ross
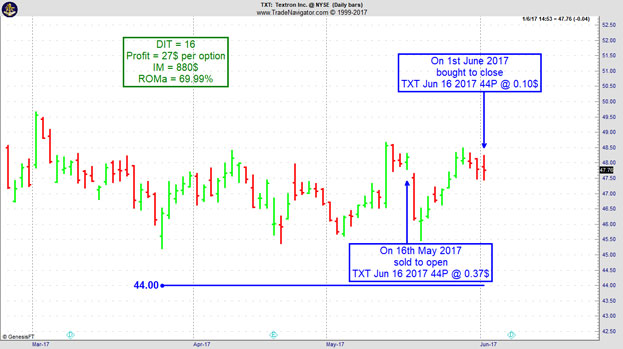
On 15th May 2017 we gave our IIG subscribers the following trade on Textron Inc. (TXT). We sold price insurance as follows:
- On 16th May 2017, we sold to open TXT Jun 16, 2017 44P @ $0.37, with 30 days until expiration and our short strike 8% below price action.
- On 1st June 2017, we bought to close TXT Jun 16, 2017 44P @ $0.10, after only 16 days in the trade, for quick premium compounding.
Profit: $27 per option
Margin: $880
Return on Margin Annualized: 69.99%
We have also added new types of trades for our IIG daily guidance since 2016, "no loss" propositions with unlimited upside potential, still using other people's money to trade.
Philippe
Receive daily trade recommendations - we do the research for you!
Instant Income Guaranteed
♦ SIGN UP TODAY! THIS IS WORTH THE INVESTMENT ♦
© by Joe Ross and Philippe Gautier. Re-transmission or reproduction of any part of this material is strictly prohibited without the prior written consent of Trading Educators, Inc.
Chart Scan Trading Idea - Cocoa trading at the ICE
by Professional Trader Andy Jordan
Educator for Spreads, Options, Swing/Day Trading, and
Editor of Traders Notebook Complete and Traders Notebook Outrights
This week, we're looking at Cocoa trading at the ICE. What caught my first attention was the net long position of the Commercials. As you can see on the chart below it is at an all time high with the Large Specs at an all time low.
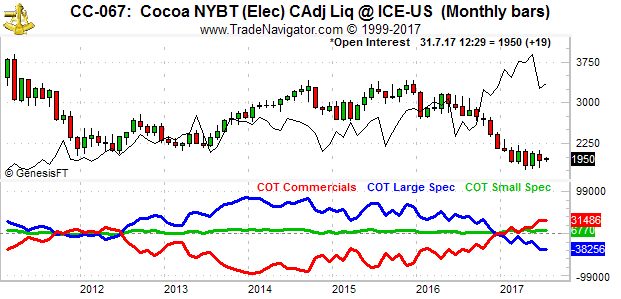
On the second chart below you can see that we are (slightly) in an up-trend since April with making (slightly) higher lows. The break above 1900 might be another sign for Cocoa to move higher.
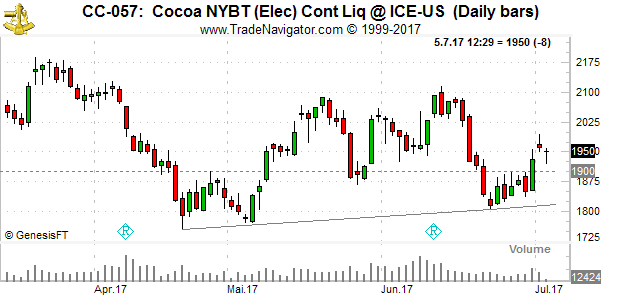
Because of above reasons you might want to look into selling Cocoa puts using a far out of the money strike price. I’d prefer the December puts with a delta of about 10.
Do you want to see how we manage this trade and how to get detailed trading instructions every day?
Please visit the following link:
Yes, I want additional information!
© by Andy Jordan. Re-transmission or reproduction of any part of this material is strictly prohibited without the prior written consent of Trading Educators, Inc.
by Professional Trader Marco Mayer
Educator for Forex and Futures, Systematic Trader, and
Creator of Ambush Trading Method, Ambush Signals, and AlgoStrats.com
In this video Marco reviews an "Outside Bars" pattern as an entry signal. He shows you how if it works as an entry signal in the Russell 2000 Mini Future and how to evaluate entry signals in general by using a systematic approach.
© by Marco Mayer. Re-transmission or reproduction of any part of this material is strictly prohibited without the prior written consent of Trading Educators, Inc.
Check out our Blog!
To view previous published Chart Scan newsletters, please log in or click on "Join Us,"
shown above, to subscribe to our free "Members Only" section.
A WEALTH OF INFORMATION & EDUCATION:
Joe Ross-Trading Educators' popular free Chart Scan Newsletter has been published since 2004.
Note: Unless otherwise noted, all charts used in Chart Scan commentary were created
by using Genesis Financial Technologies' Trade Navigator (with permission).
Legal Notice and Copyright 2017 Disclaimer - Published by Trading Educators, Inc.
Chart Scan is a complimentary educational newsletter.
© by Trading Educators, Inc. Re-transmission or reproduction of any part of this material is strictly prohibited without prior written consent.
Edition 681 - June 30, 2017

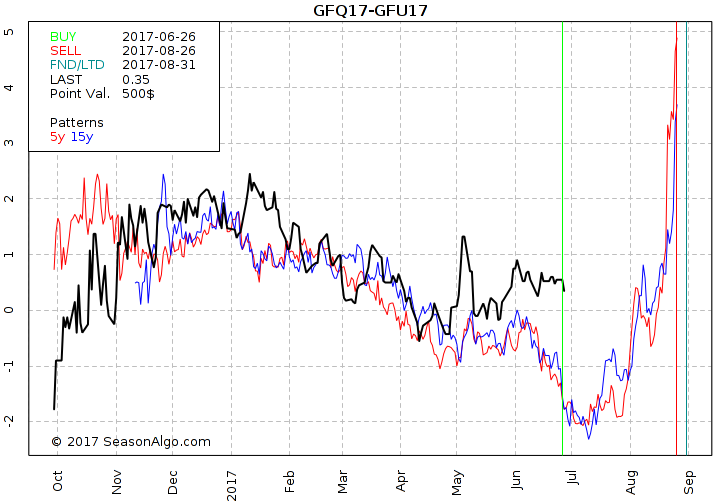
Chart Scan Trading Idea - Long GFQ17-GFU17 Feeder Cattle Spread
by Professional Trader Andy Jordan
Educator for Spreads, Options, Swing/Day Trading, and
Editor of Traders Notebook Complete and Traders Notebook Outrights
Today I am looking at a market that I don’t like to trade using outrights, but trade regularly with spreads. We are looking at the spread long August and short September Feeder Cattle with a seasonal time window between 06/26 and 08/26. Seasonality looks strong during that time and also the seasonal statistic looks promising. Because the time difference between both legs is very short (only 1 month) the spread is usually not very volatile and therefore the risk per spread contract at the lower range.
Do you want to see how we manage this trade and how to get detailed trading instructions every day? Please visit the following link: Yes, I want additional information!
© by Andy Jordan. Re-transmission or reproduction of any part of this material is strictly prohibited without the prior written consent of Trading Educators, Inc.
Andy Jordan's Blog Post - Some things that keep traders from "making it".
by Professional Trader Andy Jordan
Educator for Spreads, Options, Swing/Day Trading, and
Editor of Traders Notebook Complete and Traders Notebook Outrights
Find out the three psychological traits that prevent traders from becoming consistently successful. Read more.
Chart Scan with Commentary - Strategy
by Master Trader Joe Ross
Author, Trader, Trading Mentor, and Founder of Trading Educators, Inc.
Developer of Instant Income Guaranteed
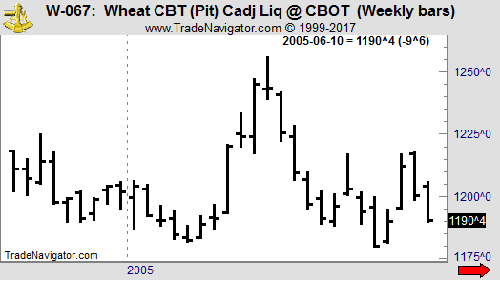
I was going through my portfolio of past Chart Scans when I came across a chart with a question from one of our students. The chart and my answer to his question are below.
Hey Joe! Wheat seems set to go lower. It has formed a 1-2 with a potential #3 high formation at the end of a swing. If prices end up with a lower high and a lower low next week, the 1-2-3 formation will be complete. Friday’s Close ended the week near the low of the week after having spiked higher earlier in the week. In an odd sort of way, we have a “spike reversal.”
I agree. You could call that a sort of spike reversal, but it seems to me you have already miss the best chance to go short. I took the liberty of marking the chart you sent with the appropriate entry point.
In my opinion, entering 1 tick below of the “spike reversal” would have given you a more certain entry. Entering that way would have you already short based on a Traders Trick Entry.
© by Joe Ross. Re-transmission or reproduction of any part of this material is strictly prohibited without the prior written consent of Trading Educators, Inc.
Trading Article - Rationalizing
by Master Trader Joe Ross
Author, Trader, Trading Mentor, and Founder of Trading Educators, Inc.
Developer of Instant Income Guaranteed
One of the most important things to learn in this life is how we ourselves behave, not only when we are acting on our own, but when we are part of the crowd. And what few of us understand is how many of our important daily actions are not thought out in advance. We are all attempting to survive in what is basically a hostile environment. Many of our actions are in response to some sort of stimulus, whether someone else’s words, or actions, or something physical like our computer going down while in the midst of a trade. It may be painful to admit, but in much of human behavior we act first and then rationalize what we did later. While we all try to be logical, in most instances the rationalization comes after the fact, if it comes at all, and in general it is not at all close to explaining why we acted in the way we did. It is tough to be honest with ourselves, but honesty with self holds one of the secrets to success. This is nowhere more true than in trading.
© by Joe Ross. Re-transmission or reproduction of any part of this material is strictly prohibited without the prior written consent of Trading Educators, Inc.
Instant Income Guaranteed - WY Trade
Philippe Gautier: Administration and New Developments
Developer: Joe Ross
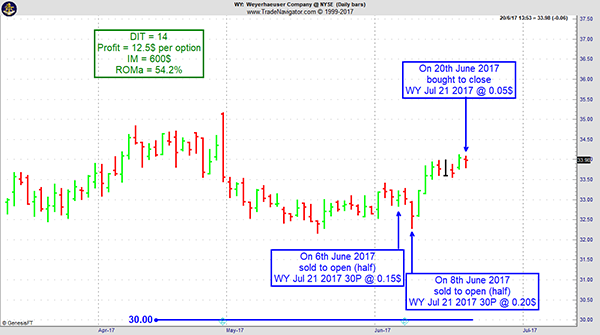
On 6th June 2017 we gave our IIG subscribers the following trade on Weyerhauser Company (WY), the stock being close to weekly and daily support zones. We decided to sell price insurance as follows:
- On 6th June 2017, we sold to open WY Jul 21 2017 30P @ $0.15, with 45 days until expiration and our short strike 10% below price action for half of our position.
- On a GTC order, on 8th jun 2017, we sold to open WY JuL 21, 2017 30p @ $0.20.
- On 20th June 2017, we bought to close WY Jul 21, 2017 30P @ $0.05, after only 14 days in the trade, for quick premium compounding.
Profit: $12.5 per option
Margin: $600
Return on Margin Annualized: 54.32%
We have also added new types of trades for our IIG daily guidance since 2016, "no loss" propositions with unlimited upside potential, still using other people's money to trade.
Philippe
Receive daily trade recommendations - we do the research for you!
Instant Income Guaranteed
♦ SIGN UP TODAY! THIS IS WORTH THE INVESTMENT ♦
© by Joe Ross and Philippe Gautier. Re-transmission or reproduction of any part of this material is strictly prohibited without the prior written consent of Trading Educators, Inc.
Ambush Traders dominate the E-Mini S&P 500 again in June!
by Professional Trader Marco Mayer
Educator for Forex and Futures, Systematic Trader, and
Creator of Ambush Trading Method, Ambush Signals, and AlgoStrats.com
Ambush just won’t stop making new equity highs in many markets, including the E-Mini S&P 500 this year.
And so it just happened again yesterday when Ambush Traders totally dominated the E-Mini S&P 500. You have to see THIS trade for yourself:
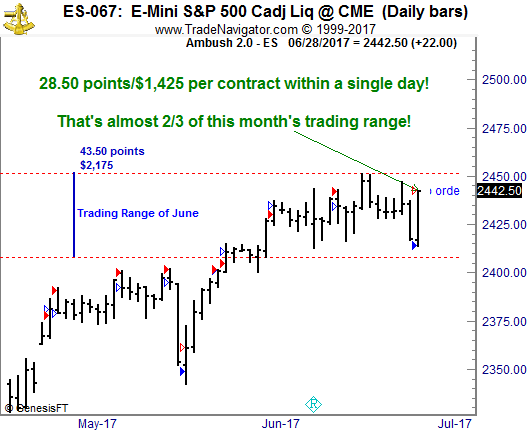
Let’s put this into perspective. June’s trading range (Difference between the highest high and the lowest low of the whole month so far) in the ES was about 43 1/2 points.
The Ambush trade you can see on the chart is 28 1/2 points. Yesterday, within just one day Ambush traders made almost 2/3 of the whole months trading range! That’s $1,425 with a single day trade!
That’s insane and honestly makes most day/swing/position traders who sit in front of their charts all day long getting in and out of the market look like fools.
Just think of most day traders sitting there all day long trying to scalp a point or two out of the E-Mini. Want to know what the result of their efforts is at the end of the trading day? Red eyes and hardly any trading profits due to the trading costs, a happy broker thankful for the commissions and if the high-frequency trading robots could laugh, they would!
Now compare that to the Ambush traders who just placed their orders at the market open and went to the beach! Relaxed eyes, hardly any commissions and about $1400 profits at the end of the day…
Want to become an Ambush Trader too?
Then simply sign up to Ambush Signals. It does all the work for you, allows you to customize what markets you want to see and has a position sizing tool implemented to automatically adjust the positions to your risk preferences.
Each day around 6:30 PM NY Time (yes, it's ready much earlier now than before) the Signals are available for you on the Dashboard. You can then place your orders and literally walk away until the markets close! Can you imagine a more comfortable way to day trade?
Happy Trading!
Marco
© by Marco Mayer. Re-transmission or reproduction of any part of this material is strictly prohibited without the prior written consent of Trading Educators, Inc.
Check out our Blog!
To view previous published Chart Scan newsletters, please log in or click on "Join Us,"
shown above, to subscribe to our free "Members Only" section.
A WEALTH OF INFORMATION & EDUCATION:
Joe Ross-Trading Educators' popular free Chart Scan Newsletter has been published since 2004.
Note: Unless otherwise noted, all charts used in Chart Scan commentary were created
by using Genesis Financial Technologies' Trade Navigator (with permission).
Legal Notice and Copyright 2017 Disclaimer - Published by Trading Educators, Inc.
Chart Scan is a complimentary educational newsletter.
© by Trading Educators, Inc. Re-transmission or reproduction of any part of this material is strictly prohibited without prior written consent.
Edition 680 - June 23, 2017

Hesitating Before a Trade
by Professional Trader Andy Jordan
Educator for Spreads, Options, Swing/Day Trading, and
Editor of Traders Notebook Complete and Traders Notebook Outrights
There are any number of reasons why a trader hesitates before a trade. The main one is lack of planning. Without a plan, there is no degree of confidence a trade will be successful, it’s all wishful thinking. Unless they are outright gamblers, traders usually have a strong need to protect their assets and avoid risk. This is especially true for beginning traders. It can take a long time to build up sufficient capital for serious trading. By that I mean sufficient capital to be able to trade for a living. It is quite understandable to fear losing all or part of your initial capital. Beginners tend to seek absolute certainty before taking a risk, and gaining true confidence in you ability to trade successfully can take time.
When it comes to short term trading, there isn't very much time for long deliberations. Market conditions are in continuous flux. Decisions need to be made relatively quickly, and if one waits too long to execute a trade, he or she may miss a significant opportunity. The reasons for hesitation are everywhere, and traders must be aware of them, and create a plan to prevent them.
Do you hesitate before a trade?
If so, Traders Notebook might help to overcome your fear to pull the trigger. With Traders Notebook you receive detailed trading recommendations for futures spreads, options, and outright trades on a daily basis with an excellent performance over many, many years.
We just made new equity highs with our spreads and options trading in Traders Notebook and we are on the best way to reach even higher levels this year.
And the best thing of all: you can start futures trading even with a small account of only $10k to $15k and build up your trading account slowly.

Click here to take advantage of our 30% off promotion!
© by Andy Jordan. Re-transmission or reproduction of any part of this material is strictly prohibited without the prior written consent of Trading Educators, Inc.
Chart Scan with Commentary - Measuring Bar
by Master Trader Joe Ross
Author, Trader, Trading Mentor, and Founder of Trading Educators, Inc.
Developer of Instant Income Guaranteed
I have shown you how it was that a #1 and a #2 point could both occur on the same bar. This week I am revisiting that chart with some additional information.
In my book Trading Optures and Futions I wrote that one of the ways to know when prices are in consolidation is through the observation of a measuring bar.
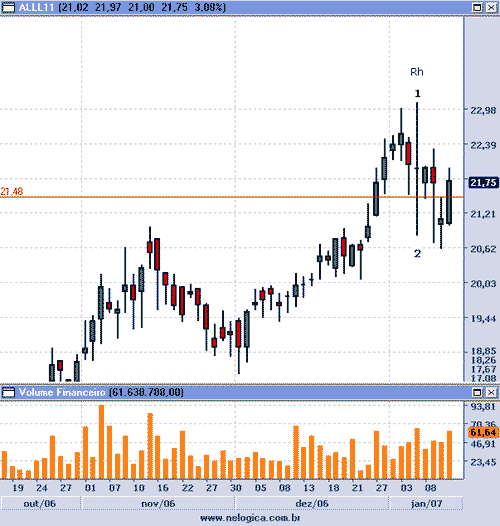
One of my students, who lives in Brazil, was kind enough to send this chart. The doji bar labeled 1-2 is a measuring bar. What it demonstrates is that we have consolidation when: following the measuring bar we have at least four opens, four closes, or both, all falling within the range of the measuring bar. On the chart above we see that as of the time I received the chart, prices were in consolidation for 8 days.
Another characteristic of consolidation is found when prices have formed both a 1-2-3 high formation followed by a 1-2-3 (I, II, III on the chart) low. The Law of Charts dictates that when prices are in consolidation, the trader should AVOID taking Traders Tricks ahead of the breakout of a #2 point. The reason is that the expectation from a 1-2-3 formation is some sort of consolidation.
© by Joe Ross. Re-transmission or reproduction of any part of this material is strictly prohibited without the prior written consent of Trading Educators, Inc.
Trading Article - Developing a Trading Style
by Master Trader Joe Ross
Author, Trader, Trading Mentor, and Founder of Trading Educators, Inc.
Developer of Instant Income Guaranteed
Master Traders develop a style that is a reflection of their education and character. Most individual trading styles are either positional or combinational and, rarely, a synthesis of both. However, there are other styles.
Positional traders take x amount of positions within a specific price area where the market is thought to be favorable to their trading strategy. This may occur on short term weakness when the longer trends are bullish. A known risk is assumed for a specific profit taking area. Positions remain until the losses or profits are taken or the price action analysis negates the trading strategy.
Combinational traders do not have the patience of positional traders, and want immediate profitable results or will exit the market quickly. These traders add additional orders as the market moves their way, building up large positions for fast two- to six-day price moves, then take profits and exit the market.
A third type of trader is a system trader, who adheres to a trading system discipline.
A fourth type of trader is the method trader. Methods differ from systems in that a method can be traded either as a system with no discretion, or traded with discretionary intervention. A method allows for a trader to be able to change parameters. A method gives full-disclosure of all its parameters and the logic behind the method. It should be realized that both systems and methods are based not so much upon a rationale as they are upon pure statistics, i.e., when a certain setup or pattern occurs, and you behave in a certain way, the result is statistically in accordance with the probable outcome.
The complete trader is able to combine all or parts of the above approaches with his own style. Trading mastery combines observation, scientific knowledge, good judgment, intuition, and creative instincts with decisive action.
© by Joe Ross. Re-transmission or reproduction of any part of this material is strictly prohibited without the prior written consent of Trading Educators, Inc.
Instant Income Guaranteed - KNX Trade
Philippe Gautier: Administration and New Developments
Developer: Joe Ross
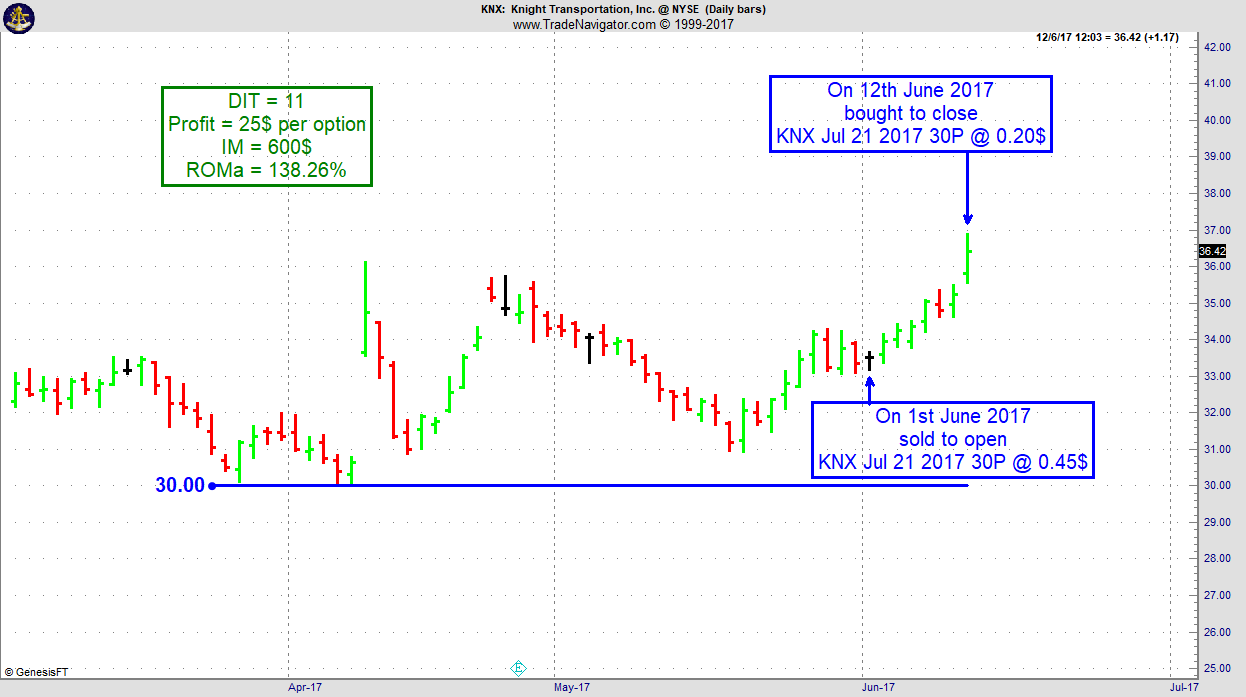
On 31st May 2017 we gave our IIG subscribers the following trade on Host Marriott Trust (KNX). We decided to sell price insurance as follows:
- On 1st June 2017, we sold to open KNX Jul 21 2017 30P @ $0.45, with 50 days until expiration and our short strike 10% below price action.
- On 12th June 2017, we bought to close KNX Jul 21 2017 30P @ $0.20, after only 11 days in the trade, for quick premium compounding.
Profit: $25 per option
Margin: $600
Return on Margin Annualized: 138.26%
We have also added new types of trades for our IIG daily guidance since 2016, "no loss" propositions with unlimited upside potential, still using other people's money to trade.
Philippe
Receive daily trade recommendations - we do the research for you!
Instant Income Guaranteed
♦ SIGN UP TODAY! THIS IS WORTH THE INVESTMENT ♦
© by Joe Ross and Philippe Gautier. Re-transmission or reproduction of any part of this material is strictly prohibited without the prior written consent of Trading Educators, Inc.
Video - Manual Backtesting Pitfalls
by Professional Trader Marco Mayer
Educator for Forex and Futures, Systematic Trader, and
Creator of Ambush Trading Method, Ambush Signals, and AlgoStrats.com
In this video, Marco talks about some of the most common pitfalls when doing manual backtesting. So if you ever wondered why your actual trading results don't match with the manual backtest you did, this is for you!
© by Marco Mayer. Re-transmission or reproduction of any part of this material is strictly prohibited without the prior written consent of Trading Educators, Inc.
Check out our Blog!
To view previous published Chart Scan newsletters, please log in or click on "Join Us,"
shown above, to subscribe to our free "Members Only" section.
A WEALTH OF INFORMATION & EDUCATION:
Joe Ross-Trading Educators' popular free Chart Scan Newsletter has been published since 2004.
Note: Unless otherwise noted, all charts used in Chart Scan commentary were created
by using Genesis Financial Technologies' Trade Navigator (with permission).
Legal Notice and Copyright 2017 Disclaimer - Published by Trading Educators, Inc.
Chart Scan is a complimentary educational newsletter.
© by Trading Educators, Inc. Re-transmission or reproduction of any part of this material is strictly prohibited without prior written consent.
Edition 679 - June 16, 2017

Chart Scan with Commentary - Lesson from the Past
by Master Trader Joe Ross
Author, Trader, Trading Mentor, and Founder of Trading Educators, Inc.
Developer of Instant Income Guaranteed
It is extremely important to pay attention to what you see. In the past I’ve written about anticipatory trading, and in this issue of Chart Scan I want to show you more about what I mean. The Law of Charts indicates that there will be many orders grouped above or below a weekly high. Since it is the job of the market to fill orders, you can anticipate that either the high or the low will be violated with considerable momentum in order to break through what, on a lesser time frame, will appear to be so-called "support" or "resistance."
Take a close look at the Weekly Live Cattle chart below. The chart is a continuous chart. I rarely bother to adjust my continuous charts, so when the contract month changes you will often see a gap like the one just prior to the last four bars on the chart.
For what I want to show you here, those gaps will not be important. They were important in 2007 and they are important even today.
I’ve drawn an arrow next to each bar that is of interest. What do you see that is "special" about the price bars I’ve pointed out?
I may have missed a few, but be aware that most of the time when one of these special bars occurred, prices moved strongly the following week in a direction opposite of the way they had been previously going. What is most interesting about these bars is what happens on the following bar, the one representing the next week’s price action.
The bars I have pointed out can occur whenever a new local high or low has been made. By local, I mean recent, not necessarily an all-time high or low, or even a contract high or low. Now, have I revealed to you the holy grail of turning points in the market?
No! I have merely pointed out "reversal bars." These are bars that make a new high, and close lower than they opened when a market has been moving up, or make a new low, and close higher than they opened when a market has been moving down. Such bars create an immediate or even longer term pivot point in the market.
Interestingly, when these occur on a weekly chart in Live Cattle, the following week sees a continuation of the price action in the direction of the reversal. Better yet is to see one of these reversals take place in conjunction with a seasonal entry signal.
Now go back and check that chart again. If you can’t see a way to make money on reversal bar anticipation, you should close out your account and use your margin money to purchase a seeing eye dog. When the reversal fails to follow through the next week, there is seldom anything to worry about. You simply are not able to get into the market, or you sustain a small loss if you are not able to watch.
Here’s another way to use the simple fact of a reversal bar, and a way that I regularly do use them.
Whenever I am holding a position in a trade, I tighten my profit protecting stops as soon as a reversal bar occurs or is in the making. I either protect a portion of my profits, or I move my stop to within one tick of the extreme of the reversal bar.
If you want to do something profitable right now, pick up your charts and see what would have happened to you in any market, in any time frame, simply using the concept of the reversal bar to get into a trade and to get out of a trade. However, there is a serious caution in the lesser time frames. In a trading range, you will find that the price bars will reverse every other bar or every two bars. In most cases you will not be able to obtain a trade using the technique as an entry signal, because prices will not continue in the direction of the reversal.
The best results will be found when prices begin to trend. How will you know when prices are beginning to trend? You will cease getting alternating reversal bars.
You might also want to look at previous issues of the Monthly Report to see if any of the reversal bars took place in conjunction with a seasonal entry signal. I looked a little way back and found that the Live Cattle contract reversed during the week of 3-27-96. The report called for a seasonal short trade entry on that date. The report also called for a seasonal short trade on 4-11-96 in the June Live Cattle contract, and sure enough, that week there was a reversal.
But I don't want to have all the fun, so I'll leave a few for you to do as research. Don't tell me you just sit in front of your screen all day and watch the markets. Heavens! You really ought to do some research, shouldn’t you???
© by Joe Ross. Re-transmission or reproduction of any part of this material is strictly prohibited without the prior written consent of Trading Educators, Inc.
Trading Article - A Great Lesson
by Master Trader Joe Ross
Author, Trader, Trading Mentor, and Founder of Trading Educators, Inc.
Developer of Instant Income Guaranteed
From a longtime friend and student:
"I thought that I’d pass on something that you might want to share with your trading community. I spent way too long thinking that range bars and/or tick bars were my way to the holy grail and I would like to tell you what I realized and why I think I was wrong."
"First some background: I got started down that path, because wasn’t seeing formations on the x minute charts with what I thought was adequate frequency. This all got started a few years ago and I haven’t gone back to look at those charts. Maybe it was just a slow period or maybe I misinterpreted what I needed to see. Regardless, in my attempt to find a solution, I looked at range and tick charts. You’ll probably remember that I came to Austin and showed the range charts to you and you agreed that they showed trades clearly. Tick charts showed different things, but they make beautiful TLOC formations."
"The fatal flaw is time coupled with charting inaccuracies. The time aspect is that the TLOC formations that one sees on those charts are fantastic, but they are impossible to manage in live trading. The challenge is that the beautiful formation that you see on a historical chart can take 30 minutes or 30 seconds to form. Therefore, you either fall asleep before the formation completes itself or you don’t have time to get the order placed. In addition, the tick change shape completely sometimes when Trade Navigator corrects or recalculates the data. It doesn’t happen often, but enough to cause a problem: a formation would look one way during live trading and then after the nightly update, it would look similar, but different enough to change how I would have traded it."
"Another aspect is that when trading those charts, you must be "on" 100% of the time that you are trading, because you never know how long it will be before a tradeable formation happens. With time charts, you know that you have a few minutes while the bar completes, so you can unplug from time to time."
"I don’t know why I didn’t figure this out sooner."
"I went back to minutes and there’s plenty of action, so I’m back in business. The tick charts seem like they might be useful to see inside a reversal bar, but not on their own. You might have already put this somewhere in a blog post, but I wanted to pass on my experience."
Limit Offer!
Further your education with "The Law of Charts In-Depth" Recorded Webinar and use coupon code during checkout, Take50 to receive 50% off your purchase (offer is good until 6/19/2017).
Through this recorded webinar The Law of Charts, we will show how YOU how to win consistently in any market and in any time frame. What it takes to create charts that exactly fit your trading style and level of comfort. The content of this intensive, in-depth recorded webinar takes the "The Law of Charts" to the next step. You'll feel like your attending a private seminar with Joe Ross himself. Don't miss out, use coupon code during checkout, Take50 to receive 50% off!
© by Joe Ross. Re-transmission or reproduction of any part of this material is strictly prohibited without the prior written consent of Trading Educators, Inc.
Instant Income Guaranteed - TSO Trade
Philippe Gautier: Administration and New Developments
Developer: Joe Ross
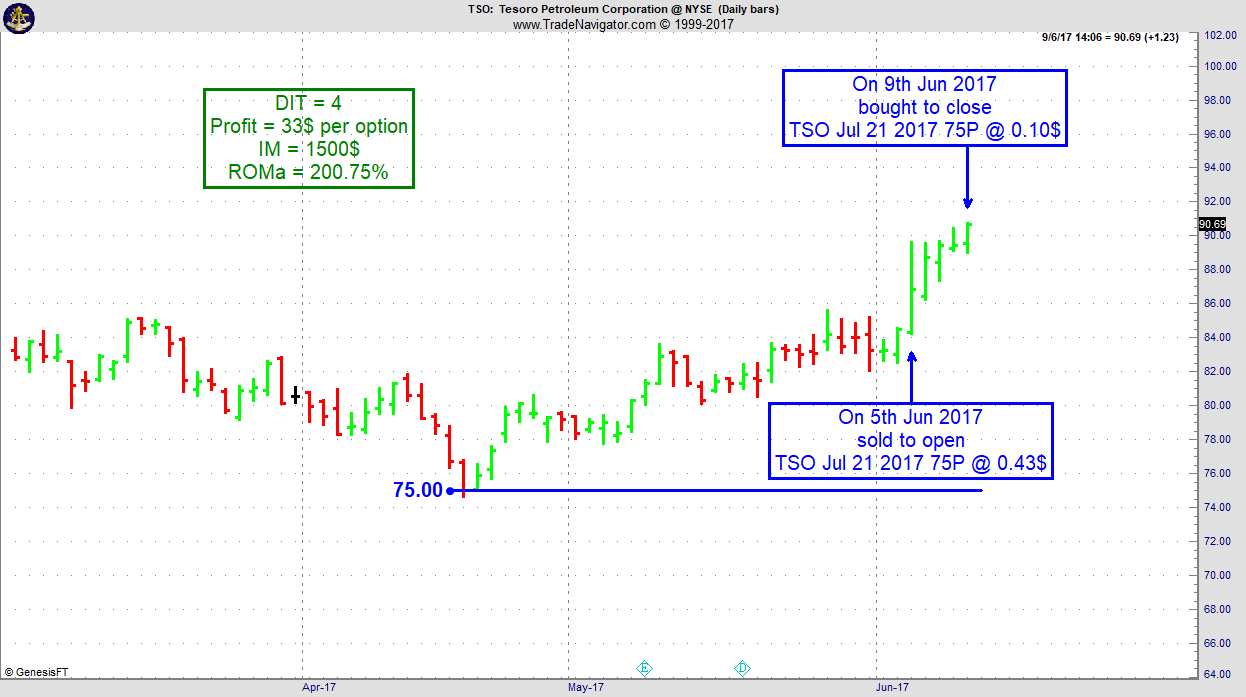
On 4th June 2017 we gave our IIG subscribers the following trade on Tesoro Petroleum Corporation (TSO). We decided to sell price insurance as follows:
- On 5th June 2017, we sold to open TSO Jul 21, 2017 75P @ $0.43, with 46 days until expiration and our short strike 11% below price action
- On 9th June 2017, we bought to close TSO Jul 21, 2017 75P @ $0.10, after only 4 days in the trade, for quick premium compounding.
Profit: $33 per option
Margin: $1,500
Return on Margin Annualized: 200.75%
We have also added new types of trades for our IIG daily guidance since 2016, "no loss" propositions with unlimited upside potential, still using other people's money to trade.
Philippe
Receive daily trade recommendations - we do the research for you!
Instant Income Guaranteed
♦ SIGN UP TODAY! THIS IS WORTH THE INVESTMENT ♦
© by Joe Ross and Philippe Gautier. Re-transmission or reproduction of any part of this material is strictly prohibited without the prior written consent of Trading Educators, Inc.
Blog Post - The Crush Spread
by Professional Trader Andy Jordan
Educator for Spreads, Options, Swing/Day Trading, and
Editor of Traders Notebook Complete and Traders Notebook Outrights
Find out what it means when trading a crush spread. Read more.
© by Andy Jordan. Re-transmission or reproduction of any part of this material is strictly prohibited without the prior written consent of Trading Educators, Inc.
by Professional Trader Marco Mayer
Educator for Forex and Futures, Systematic Trader, and
Creator of Ambush Trading Method, Ambush Signals, and AlgoStrats.com
In this Q&A series, Marco answers a follow-up question related to Pinbars, gives recommendations on Forex brokers and talks about why it's so hard to trade successfully on a 5-minute chart. Enjoy!
© by Marco Mayer. Re-transmission or reproduction of any part of this material is strictly prohibited without the prior written consent of Trading Educators, Inc.
Weekend Special for Father's Day!
Coupon Code: specialoffer
30% off when you purchase one or more:
Trading is a Business
Day Trading S&P 500
Stealth Trader
Life Index for Traders
Offer ends 6/19/2017
Check out our Blog!
To view previous published Chart Scan newsletters, please log in or click on "Join Us,"
shown above, to subscribe to our free "Members Only" section.
A WEALTH OF INFORMATION & EDUCATION:
Joe Ross-Trading Educators' popular free Chart Scan Newsletter has been published since 2004.
Note: Unless otherwise noted, all charts used in Chart Scan commentary were created
by using Genesis Financial Technologies' Trade Navigator (with permission).
Legal Notice and Copyright 2017 Disclaimer - Published by Trading Educators, Inc.
Chart Scan is a complimentary educational newsletter.
© by Trading Educators, Inc. Re-transmission or reproduction of any part of this material is strictly prohibited without prior written consent.
Edition 678 - June 9, 2017

Chart Scan with Commentary - Classic Another Chart Revelation
by Master Trader Joe Ross
Author, Trader, Trading Mentor, and Founder of Trading Educators, Inc.
Developer of Instant Income Guaranteed
In one of my books I discuss the formation called "Cup with Handle." It is a formation that has been known about for a long time, and was first mentioned by that name by the publisher of "Investor's Business Daily." Actually the cup with handle is often nothing more than a head with a right shoulder. Lots of times the left shoulder is missing or, as in the case of the daily chart below, the left shoulder is there but very small and shallow. Notice this is an upside down head with a right shoulder to go long.
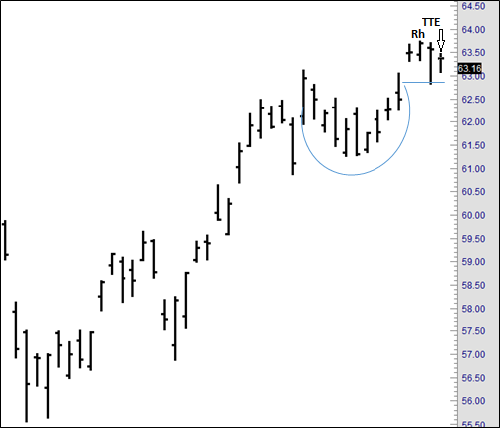
If you look closely you will see that the high of the cup "handle" is also a Ross Hook. Two days after the Ross Hook there was a Traders Trick Entry to go long at 63.40.
© by Joe Ross. Re-transmission or reproduction of any part of this material is strictly prohibited without the prior written consent of Trading Educators, Inc.
Trading Article - Protecting Profits
by Master Trader Joe Ross
Author, Trader, Trading Mentor, and Founder of Trading Educators, Inc.
Developer of Instant Income Guaranteed
Over the years, I've had the most profitable results by always making an attempt to receive pay for the risk I am taking. I want to be paid to trade. Being "paid to trade" has become a slogan at Trading Educators. The moment you can realize some profit from a trade, the sooner the pressure is off. You sleep well during nights where you have taken some money out of the trade during the day. You make fewer mistakes. Your growth in your confidence and faith in what you are doing, and seeing that what you are doing is succeeding, do wonders for your feeling of well-being.
If a trade gives you $1000 from a risk you have assumed in the market, never give them back more than $500. If someone gives you $2000, keep $1200; $3000, keep $2100; $4000, keep $3200; $5000, keep $4500. Remember the Point of Diminishing Returns as applied to trading. Never allow a $1000 per contract open equity profit to become a loss. As the market moves further beyond the Point of Diminishing Returns, the probability of a short-term trend reversal increases exponentially. The best market moves make the majority of their initial profits in 2 to 6 days. Therefore, a higher percentage of profits needs to be protected as the market moves higher and you approach at least a temporary end to the current move. Traders feel good about themselves to the degree they control trade profits and losses. This is the psychological Law of Control applied to the trade decision-making process.
© by Joe Ross. Re-transmission or reproduction of any part of this material is strictly prohibited without the prior written consent of Trading Educators, Inc.
Instant Income Guaranteed - MDLZ Trade
Philippe Gautier: Administration and New Developments
Developer: Joe Ross
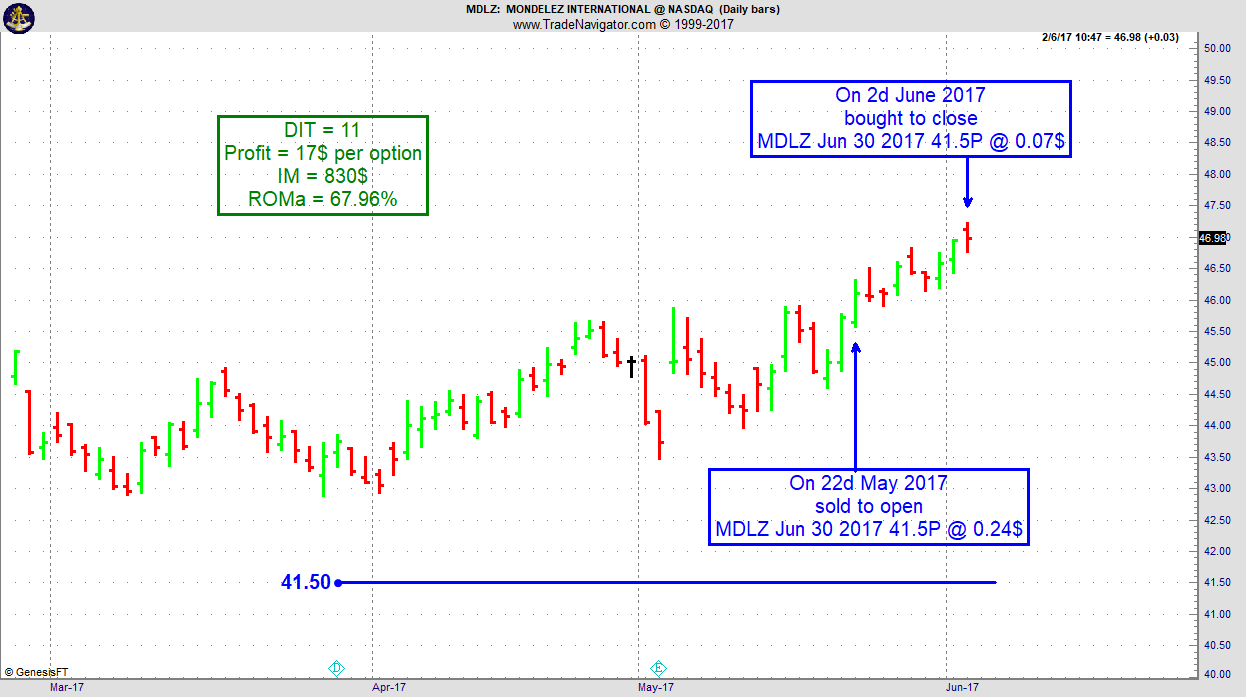
On 21st May 2017 we gave our IIG subscribers the following trade on Mondelez International (MDLZ). We decided to sell price insurance as follows:
- On 22d May 2017, we sold to open MDLZ Jun 30 2017 41.5P @ $0.24, with 38 days until expiration and our short strike 9% below price action.
- On 2nd June 2017, we bought to close MDLZ Jun 30, 2017 41.5P @ $0.07, after 11 days in the trade, for quick premium compounding..
Profit: $17 per option
Margin: $830
Return on Margin Annualized: 67.96%
We have also added new types of trades for our IIG daily guidance since 2016, "no loss" propositions with unlimited upside potential, still using other people's money to trade.
Philippe
Receive daily trade recommendations - we do the research for you!
Instant Income Guaranteed
♦ SIGN UP TODAY! THIS IS WORTH THE INVESTMENT ♦
© by Joe Ross and Philippe Gautier. Re-transmission or reproduction of any part of this material is strictly prohibited without the prior written consent of Trading Educators, Inc.
Trading Idea - Sugar spread long March and short May 2018
by Professional Trader Andy Jordan
Educator for Spreads, Options, Swing/Day Trading, and
Editor of Traders Notebook Complete and Traders Notebook Outrights
Sugar is one of the markets I use mainly for spreads. In general, the Soft markets are not easy to trade and, because of exchange data fee costs of about $110, expensive. The calendar spread catches my interest because we are right at the beginning of the seasonal time window (06/07-07/08), the statistic regarding seasonality looks promising with very small draw-downs in the past and also the chart looks like the spread might turn to the up-side soon.
Do you want to know how we trade this spread in Traders Notebook?
Did you know Traders Notebook Complete had its most profitable year in 2016?
Learn how to manage this trade by getting daily detailed trading instructions, learn more!
© by Andy Jordan. Re-transmission or reproduction of any part of this material is strictly prohibited without the prior written consent of Trading Educators, Inc.
Trading Article - 5 Tips to Improve your Day Trading
by Professional Trader Marco Mayer
Educator for Forex and Futures, Systematic Trader, and
Creator of Ambush Trading Method, Ambush Signals, and AlgoStrats.com
Day trading has always been a tough game, requiring a very strong psyche, discipline and a high level of trading skills to succeed in.
Nowadays though it's even harder due to the stronger competition, not only by humans but especially by computers trading at a speed a human trader simply can not match up to. High-Frequency Trading is happening in literally all of the popular markets out there and like Chess, scalping has become a game where humans cannot win against the AIs anymore. Add to that the speed/location advantage of the HFT shops and the odds of success decrease even more.
My advice is to forget about scalping. Even without the trading bots, odds of success to make money scalping are very low as the trading costs involved are incredibly hard to overcome. To not get completely killed by trading costs you need to trade in very liquid markets. But that's exactly where the robots are.
But not everything is lost, maybe all you have to do is to slightly adapt as a day trader. Here are some of the things you can do:
- The longer your trades last, the higher your profits (and losses) will be on average. It's a simple fact, if your trades last 4 hours on average, you'll be much more likely to catch a big move than if you average trade lasts 5 minutes. This way the HFTs can't hurt you as much anymore and also trading costs will have much less of an impact.
- You don't have to do 20 trades per day to be a successful day trader, quite the opposite! The more you trade, the higher your trading costs and believe me these trading costs will kill you in the long run.
- Don't get married to a specific market, instead, diversify your day trading over different, uncorrelated markets. This will strongly increase your chances of success as you'll stop seeing opportunities in a market where there aren't any.
- Day trade only markets that provide a good bang for the buck. I do this by looking at the average daily range of a market in relation to the average trading costs.
- Trade the news. I know you often hear the opposite advice but if you learn how to do this right, trading the news is one of the best ways to day trade. Just look at the markets, especially currencies. Isn't it true that most big moves happen right when some economic report is coming out? Sure, volatility explodes and liquidity often isn't that great. But hey, isn't high volatility exactly what you're looking for as a day trader? Now first you need to do your homework of course and have a plan ready on how to trade each of the specific news events.
Happy Trading!
Marco
© by Marco Mayer. Re-transmission or reproduction of any part of this material is strictly prohibited without the prior written consent of Trading Educators, Inc.
Check out our Blog!
To view previous published Chart Scan newsletters, please log in or click on "Join Us,"
shown above, to subscribe to our free "Members Only" section.
A WEALTH OF INFORMATION & EDUCATION:
Joe Ross-Trading Educators' popular free Chart Scan Newsletter has been published since 2004.
Note: Unless otherwise noted, all charts used in Chart Scan commentary were created
by using Genesis Financial Technologies' Trade Navigator (with permission).
Legal Notice and Copyright 2017 Disclaimer - Published by Trading Educators, Inc.
Chart Scan is a complimentary educational newsletter.
© by Trading Educators, Inc. Re-transmission or reproduction of any part of this material is strictly prohibited without prior written consent.
Edition 677 - June 2, 2017

Chart Scan with Commentary - Decisions, Decisions
by Master Trader Joe Ross
Author, Trader, Trading Mentor, and Founder of Trading Educators, Inc.
Developer of Instant Income Guaranteed

The day the arrow is pointing to was a Friday and it created a very nice Traders Trick Entry to go long on Monday, one tick above Friday’s high. During the Sunday/Monday night prices traded as you see them above. Should you leave the TTE in place, or should you get out? I opted to leave my order in place at 1252.90. My reasons: 1) I anticipated a follow-through of the momentum begun on Friday. 2) The TTE in this instance offers a very low risk trade. I use a tight protective stop in the event I’m wrong.
The chart below shows what happened on Monday. Prices reached 1255.90, or $300 per contract, more than enough for a profitable scalp trade. Since I was scalping, I was all in and all out at 1255.90. Will gold prices move higher? Should I have stayed in the trade to see? Not if I was scalping. When I’m scalping I take what I can get and leave the rest for someone else. There are plenty of trades to be had, you simply have to look for them.

30% Off Webinars
Use Coupon Code During Checkout: summer30
Offer Ends June 6, 2017
The Law of Charts In-Depth
Trading All Markets
Traders Trick Advanced Concepts
Traders with More Special Set-Ups
© by Joe Ross. Re-transmission or reproduction of any part of this material is strictly prohibited without the prior written consent of Trading Educators, Inc.
Trading Article - More About Losses
by Master Trader Joe Ross
Author, Trader, Trading Mentor, and Founder of Trading Educators, Inc.
Developer of Instant Income Guaranteed
How should you feel about losses? I once read somewhere that you are supposed to love losses. Does that make sense to you? It doesn't to me.
The worst aspect of losing is that it tends to create pessimism. Traders should feel bad when they lose money only if they fought the market trend, or violated their own trading strategies. The best traders have a healthy "so what, big deal!" attitude that maintains a sense of humor about losses. There is no reason to feel bad about losses if the trading discipline was correctly used. On the other hand, there is no reason to learn to love them either.
Analyze losses, learn from them, and then let them go; move on, that's the best thing to do.
Understanding man's relationship to time is one of life's most important challenges. When man becomes free of time's constraints, he lives life to the fullest and achieves goals on his own terms. Pessimism traps traders in the past, destroys their present, and robs them of the future. Imagine a world without time where the thought of death is not a finality of existence. If money were not the reason for your work-related behavior, then who are you? Where are you and what are you doing? Who shares this existence with you? In the philosophical sense, man creates himself and his existence when he takes responsibility for his actions and his time. Think how any individuals create order, structure, and discipline in their lives. How will you allow a trading loss today affect your life five years from today?
Thinking the wrong way can become self-fulfilling. The trouble with self-fulfillment is that many people have a self-destructive streak. Accident-prone drivers keep destroying their cars, and self-destructive traders keep destroying their accounts. Markets offer unlimited opportunities for self-sabotage, as well as for self-fulfillment. Acting out your internal conflicts in the marketplace is a very expensive proposition.
Traders who are not at peace with themselves often try to fulfill their contradictory wishes in the market. If you do not know where you are going, you will wind up somewhere you never wanted to be.
Every business has losses. I cannot think of any that don't. Shoplifting, embezzlement, internal pilferage, lawsuits, bad debts, spoilage, etc., I'm sure you can think of even more. You name it and businesses have one or more of the many ways to experience losses. Most businesses expect and accept such losses as part of doing business. Why, then, is it such a big deal when you have a loss in trading? If you know the answer to that, please let me know.
The way I handle a loss is this: I examine it, make every attempt to learn from it, and ascertain whether I had the loss by straying from my trading plan. If I have strayed, I reinforce my resolve to stick with my plan. If I have not strayed, then I learn from it what I can, and shrug it off as a cost of business. It is not an expense, it is a cost, and if you don't know the difference you need to take a course or read a book on the basics of accounting.
© by Joe Ross. Re-transmission or reproduction of any part of this material is strictly prohibited without the prior written consent of Trading Educators, Inc.
30% Off Books and eBooks
Use Coupon Code During Checkout: summer30
Offer Ends June 6, 2017
Instant Income Guaranteed - GRMN Trade
Philippe Gautier: Administration and New Developments
Developer: Joe Ross
On 8th May 2017, we gave our IIG subscribers the following trade on Garmin Ltd (GRMN). We decided to sell price insurance as follows:
- On 9th May 2017, we tried to sell to open GRMN Jun 16 2017 47.5P @ $0.24-$0.26; some subscribers were filled but I decided not to accept less than $0.26 and was not filled on that day.
- On 18th May 2017, I sold to open GRMN Jun 16, 2017 47.5P @ $0.32 or $32 per option sold on a Good Till Cancelled order.
- On 26th May 2017, we bought to close GRMN Jun 16, 2017 47.5P @ $0.07, after 8 days in the trade (or longer for those who entered on 18th May 2017), for quick premium compounding.
Profit: $25 per option
Margin: $950
Return on Margin Annualized: 120.07%
We have also added new types of trades for our IIG daily guidance since 2016, "no loss" propositions with unlimited upside potential, still using other people's money to trade..
Philippe

Receive daily trade recommendations - we do the research for you!
Instant Income Guaranteed
♦ SIGN UP TODAY! THIS IS WORTH THE INVESTMENT ♦
Receive 30% Off
Instant Income Guaranteed
Use Coupon Code During Checkout:
summer30
Offer Ends June 6, 2017
© by Joe Ross and Philippe Gautier. Re-transmission or reproduction of any part of this material is strictly prohibited without the prior written consent of Trading Educators, Inc.
Blog Post - Emotions with Winning and Losing
by Professional Trader Andy Jordan
Educator for Spreads, Options, Swing/Day Trading, and
Editor of Traders Notebook Complete and Traders Notebook Outrights
What kinds of emotions go with winning and losing? Read more.
© by Andy Jordan. Re-transmission or reproduction of any part of this material is strictly prohibited without the prior written consent of Trading Educators, Inc.
30% Off Stealth Trader and Combo
Use Coupon Code During Checkout: summer30
Offer Ends June 6, 2017
Stealth Trader
Stealth/Ambush Combo
Trading Error: Averaging into a Losing Position
by Professional Trader Marco Mayer
Educator for Forex and Futures, Systematic Trader, and
Creator of Ambush Trading Method, Ambush Signals, and AlgoStrats.com
In this video, Marco talks about one of the most common, and also one of the most deadly mistakes traders can make, and that's averaging into a losing position. He also gives you some insights as to why this is so tempting, and shows you why you should avoid it at all costs.
If you should you have any questions, don't hesitate to send me an email, This email address is being protected from spambots. You need JavaScript enabled to view it..
Happy Trading!
Marco
© by Marco Mayer. Re-transmission or reproduction of any part of this material is strictly prohibited without the prior written consent of Trading Educators, Inc.

30% Off Books
Use Coupon Code During Checkout: summer30
Offer Ends June 6, 2017
Check out our Blog!
To view previous published Chart Scan newsletters, please log in or click on "Join Us,"
shown above, to subscribe to our free "Members Only" section.
A WEALTH OF INFORMATION & EDUCATION:
Joe Ross-Trading Educators' popular free Chart Scan Newsletter has been published since 2004.
Note: Unless otherwise noted, all charts used in Chart Scan commentary were created
by using Genesis Financial Technologies' Trade Navigator (with permission).
Legal Notice and Copyright 2017 Disclaimer - Published by Trading Educators, Inc.
Chart Scan is a complimentary educational newsletter.
© by Trading Educators, Inc. Re-transmission or reproduction of any part of this material is strictly prohibited without prior written consent.
Edition 676 - May 26, 2017

Spread Trading Idea: ZMF18-ZMH18
by Professional Trader Andy Jordan
Educator for Spreads, Options, Swing/Day Trading, and
Editor of Traders Notebook Complete and Traders Notebook Outrights
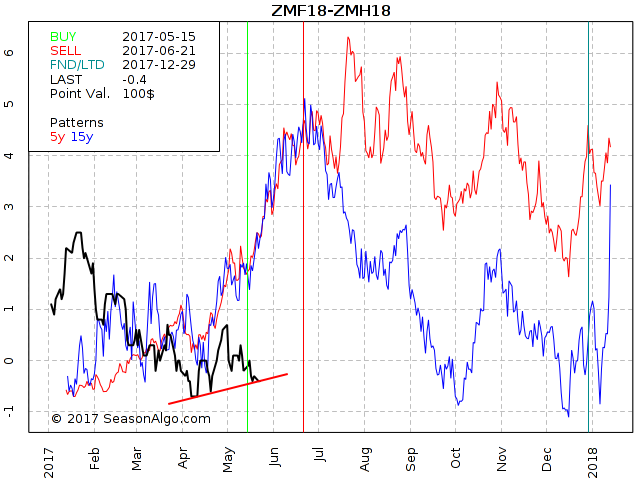
Chart Scan Trading Idea: ZMF18-ZMH18, long January and short March 2018 Soybean Meal
Today I want to have a closer look at a Soybean Meal spread using 2018 contracts. While the spread doesn’t show much volume, you can easily trade 10 or 20 contracts without any problem and bid/ask with only 1-tick away (nevertheless, I recommend the use of limit orders).
So far, the spread has not made its strong seasonal move to the up-side but at least it is showing higher lows for the last few weeks. We are in an up-trend since April as shown by the red line even if the up-trend is not very strong. Personally, I would wait what happens next before entering the trade but keep in mind the seasonal time window will already close in about 4 weeks and this doesn’t give the spread much time to develop. The spread seems promising with 15 winning years out of 15 (seasonally speaking) and because volatility is low, it may also work for the once with small trading accounts.
© by Andy Jordan. Re-transmission or reproduction of any part of this material is strictly prohibited without the prior written consent of Trading Educators, Inc.
Blog Post - Money Management
by Professional Trader Andy Jordan
Educator for Spreads, Options, Swing/Day Trading, and
Editor of Traders Notebook Complete and Traders Notebook Outrights
Don't confuse money management with trade management. Read more.
© by Andy Jordan. Re-transmission or reproduction of any part of this material is strictly prohibited without the prior written consent of Trading Educators, Inc.
Trading Error: Trading Your P&L
by Professional Trader Marco Mayer
Educator for Forex and Futures, Systematic Trader, and
Creator of Ambush Trading Method, Ambush Signals, and AlgoStrats.com
In this video, Marco talks about another very common trading mistake, and that's trading your P&L instead of the actual market. If you're struggling to become a winning trader, this might be an eye-opener, especially if you're a breakeven trader right now.
If you should you have any questions, don't hesitate to send me an email, This email address is being protected from spambots. You need JavaScript enabled to view it..
Happy Trading!
Marco
© by Marco Mayer. Re-transmission or reproduction of any part of this material is strictly prohibited without the prior written consent of Trading Educators, Inc.
Trading Article - Second Look
by Master Trader Joe Ross
Author, Trader, Trading Mentor, and Founder of Trading Educators, Inc.
Developer of Instant Income Guaranteed
Taking a second look at potential trades at times results in “why didn’t I see this before?”
For instance, what if you are looking at a market as it approaches a support area? Isn’t it reasonable to ask yourself, “If this market breaks through and I am long, what will I do?” Ask yourself how such an event would change the picture. If you have a position, will you still want to hold it? If you have no position, will this cause you to take a position opposite what was the trend? If it will, then why not place an order entry just the other side of that support area? Very often, when prices approach support from what has been a trading range, they are already in a counter trend within the confines of the trading range. That means a breakout of the trading range would be a continuation of a newly formed minor trend.
After a second look, I will put my work aside before looking at my charts again. Then I make a plan for the orders I want to place.
I make sure my trading platform is working. To do this, I issue an order I know will come back as “unable.” I also check to see if my phone line is working by making a call to my cell phone. In the event of an emergency, I want to be able to call my broker.
Another thing I do is to quickly check the news to see if there is anything that has come out or is reported to come out that might affect my trades. I want to know if any reports are due or any speeches scheduled that might affect the market in which I intend to trade.
I do all this before I enter a trade. But do you know what most traders do? They do their analysis after the trade is made. Too often, they do it when the trade is already going against them.
How many times have you entered a trade, and then said to yourself, “Oh no, why didn’t I see that before?” How could you have seen it if you hadn’t looked, and looked again, and thought about it, and then perhaps looked one more time?
Also, many traders do their analysis after entering the trade in search of a justification for having entered. “Now I’m in the trade, let’s see if I can find out a couple of good reasons as to why!”
If you want to be a successful trader, you have to be hard: Hard on yourself. I don’t mean that you have to be browbeat yourself, or tell yourself you are a loser and can’t win. I don’t mean you have to blame yourself for everything that happens to you when you are trading. Some problems and situations are unavoidable. You just have to be firm with yourself in all that you do. You can’t afford to be a mouse about the way you do things. You need strong self-discipline and self-control. This is a business; you must be businesslike in conducting your affairs.
As a business person, you must manage your business. One of the main functions of management is planning. You have to plan your trades. Other things to look for as you go through your charts are: Tradable formations and setups. Look for reversal bars that indicate a move may be ending. Look for a drop in volume that may indicate illiquidity, or perhaps a coming change of direction. Watch all the things that you can that reveal to you the kinds of information that are needed for the way you trade. These should all be part of your plan.
Some people give more thought to choosing which flavor ice cream to eat than to which market to enter and how and when to do it.
By not taking the time for preparation, you end up not having enough time to weigh the pros and cons or really familiarize yourself with what you are getting into.
You don’t have time to realize that prices have supported two ticks away from your entry about forty times in the past. You don’t have time to see that you are trading right into overhead selling. You don’t have time to notice that if prices break out of a consolidation area just ahead of yesterday’s high or low, they will also probably violate yesterday’s high or low. You don’t have time to see where prices are in relation to the trend line. You don’t have time to really grasp the overall trend, or the correction that is going counter trend. You don’t have time to really consider where you will place your stop. You don’t have time to read the market and to see what it might be telling you.
All of these things can be done ahead of time. If you do not do your homework, you will end up chasing markets in a desperate attempt to get into “the big move.”
© by Joe Ross. Re-transmission or reproduction of any part of this material is strictly prohibited without the prior written consent of Trading Educators, Inc.
Instant Income Guaranteed - KSU Trade
Philippe Gautier: Administration and New Developments
Developer: Joe Ross
On 25th April 2017 we gave our IIG subscribers the following trade on Kansas City Southern (KSU). We decided to sell price insurance as follows:
- On 26th April 2017, we sold to open KSU Jun 16 2017 80P @ $0.75, i.e. $75 per option sold, with 50 days to expiration, and our short strike below a major support zone about 11% below price action, making the trade pretty safe in spite of a low implied volatility environment.
- On 15th May 2017, we bought to close KSU Jun 16, 2017 80P @ $0.30, after 19 days in the trade, for quick premium compounding.
Profit: $45 per option
Margin: $1,600
Return on Margin Annualized: 54.03%
We have also added new types of trades for our IIG daily guidance since 2016, "no loss" propositions with unlimited upside potential, still using other people's money to trade.
Philippe
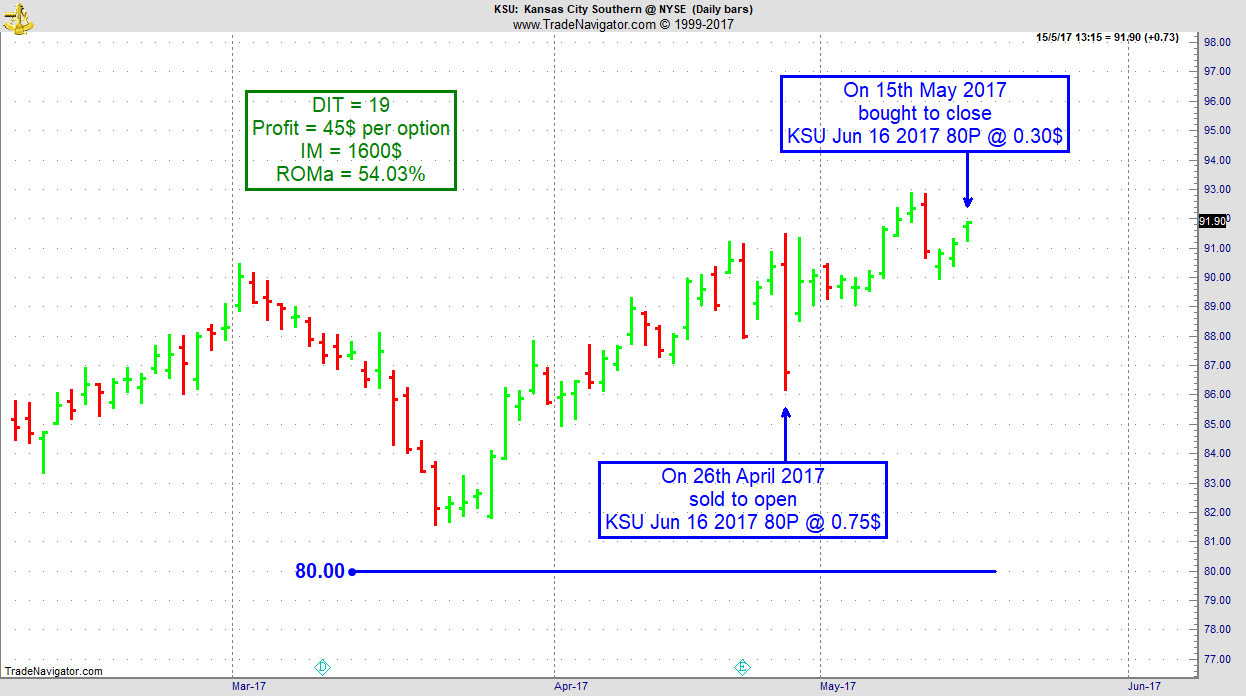
Receive daily trade recommendations - we do the research for you!
Instant Income Guaranteed
♦ SIGN UP TODAY! THIS IS WORTH THE INVESTMENT ♦
© by Joe Ross and Philippe Gautier. Re-transmission or reproduction of any part of this material is strictly prohibited without the prior written consent of Trading Educators, Inc.
Check out our Blog!
To view previous published Chart Scan newsletters, please log in or click on "Join Us,"
shown above, to subscribe to our free "Members Only" section.
A WEALTH OF INFORMATION & EDUCATION:
Joe Ross-Trading Educators' popular free Chart Scan Newsletter has been published since 2004.
Note: Unless otherwise noted, all charts used in Chart Scan commentary were created
by using Genesis Financial Technologies' Trade Navigator (with permission).
Legal Notice and Copyright 2017 Disclaimer - Published by Trading Educators, Inc.
Chart Scan is a complimentary educational newsletter.
© by Trading Educators, Inc. Re-transmission or reproduction of any part of this material is strictly prohibited without prior written consent.
Edition 675 - May 19, 2017

Ambush Traders are Celebrating!
by Professional Trader Marco Mayer
Educator for Forex and Futures, Systematic Trader, and
Creator of Ambush Trading Method, Ambush Signals, and AlgoStrats.com
Ambush just made new all time equity highs all over the place for the first time in 2017!
As you might know, there are three sample Portfolios I came up with a couple of years ago to show the power of diversified trading with Ambush. It simply doesn't make sense to trade just one market and to hope that one is going to be the big winner of the year. That's why trading multiple markets is so important and one of the key principles to successful trading in the long-term.
You can learn more about the details of these portfolios and see the updated long-term performance here.
Now all of the Futures portfolios just hit new all-time equity highs! As you can see all of them had a slow start in 2017, going more or less nowhere for two months. But then the fun started and during the last month they really took off!
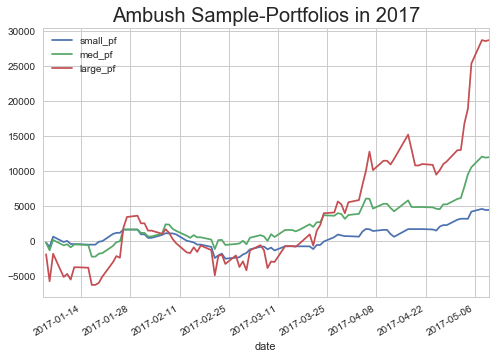
Here's an overview of how Ambush performed in each of the Futures markets (trading one contract) so far in 2017. And as you can see the performance is widely spread across the markets. The only two markets that didn't come out ahead yet are GC (Gold) and FGBM (Euro Bobl).
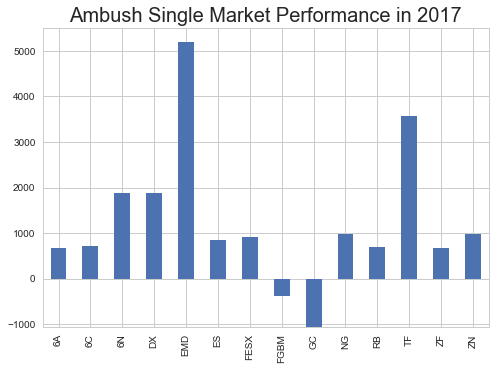
Join the Ambush success story and become an Ambush Trader!
The easiest way to follow Ambush is, of course, Ambush Signals. It does all the work for you, allows you to customize what markets you want to see and has a position sizing tool implemented to automatically adjust the positions to your risk preferences.
Each day around 18:30 NY Time (yes, it's ready much earlier now than before) the Signals are available for you on the Dashboard. You can then place your orders and literally walk away until the markets close! Remember that all Ambush trades are day trades, can you imagine a more comfortable way to day trade?
I look forward to welcoming you as an Ambush Trader! Here's something for you to celebrate with us right from the beginning:
Sign up now and on the check-out (credit card payment only) use one of these:
Coupon Code:
- Monthly Subscription: use "ambsigmonth20" to get $20 off the first month
- 3 Month Subscription: use "ambsigthree50" to get $50 off the first 3 months
If you’d prefer to generate the signals on your own and want to know the exact trading rules of Ambush, we also have a special offer for the Ambush eBook:
Coupon Code:
- Ambush eBook: use "ambush200" to get $200 off the Ambush eBook
This is the first Ambush Signals Promo ever and all Coupon codes are valid only until Sunday. Hurry up and don’t miss out on this rare opportunity!
If you should you have any questions, don't hesitate to send me an email, This email address is being protected from spambots. You need JavaScript enabled to view it..
Happy Trading!
Marco
© by Marco Mayer. Re-transmission or reproduction of any part of this material is strictly prohibited without the prior written consent of Trading Educators, Inc.
Blog Post - How do you go about making trading decisions?
by Professional Trader Andy Jordan
Educator for Spreads, Options, Swing/Day Trading, and
Editor of Traders Notebook Complete and Traders Notebook Outrights
In time, your trading decisions will become better and better. Read more.
© by Andy Jordan. Re-transmission or reproduction of any part of this material is strictly prohibited without the prior written consent of Trading Educators, Inc.
Chart Scan with Commentary - Trade Selection
by Master Trader Joe Ross
Author, Trader, Trading Mentor, and Founder of Trading Educators, Inc.
Developer of Instant Income Guaranteed
I often receive the question: "Hey Joe! How do I choose a good trade?" Traders write, "How can I tell if the trade will be a good one?" My answer is that I don't know how you can tell, but there is a way I can tell, and I'll share it with you.
I look for both probability and momentum. When dealing with futures, I look for a trend in any market and in one or more time frames that is producing sufficient movement for me to make some money. When dealing with stocks, it is much easier to find momentum. There are numerous sources of data telling you about stocks making new highs or stocks having the most movement.
It seem obvious that a stock moving to new highs, or one being among the most active, is experiencing something in its fundamentals to cause it to move. So my first filter, that of momentum, is already screened for me.
Next, I want to look at probability. What I want to know is: "What kind of a pattern follows the making of a new high?" Does the stock correct on profit taking and, if so, how much does it correct? Does it correct as far as the previous support area? If so, how often does it do that?
Last week I was looking at a stock. Did I know anything about that company? No, I didn't, and I didn't care to know. The stock was making a new 52 week high. That's all I needed to know.
If you look at the chart below you can see that following the making of a new high, it never, as far as we can see on the chart, corrected below a previous support area (arrows). So the probabilities are in my favor if I buy that stock. Also, I know where to place my stop - below the last support!
Okay, so when should I consider buying this stock? Well, it usually corrects for 3-4 days, and I want to grab it when it begins to move toward the new high. So I will place a buy order just above each bar of the correction (Traders Trick). When filled, I will hold that stock until it reaches my objective, which, by the way, is never very great. I will definitely sell part of my position as soon as possible so that I am paid to trade and am no longer under pressure or stress. From there I will trail a stop until I'm stopped out. I let the market show me where to put my stop. It is always under the most recent support unless I see something that shows me clearly that the move is over.
Are there any other filters I use? Yes! I use volume as a filter. I want to see at least 500,000 shares trading every day. I also use price as a filter. I recommend that you stay with stocks that fit within your capitalization. You simply can't afford to over trade your capital. If you do, it's gambling, not trading. As your account grows, realize this: higher priced stocks move more than lower priced stocks. It is much easier to get a $1 move on a $60 stock than it is on a $20 stock.
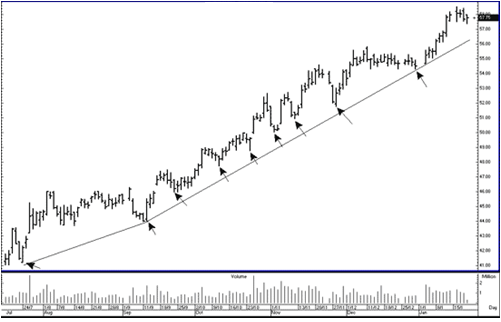
© by Joe Ross. Re-transmission or reproduction of any part of this material is strictly prohibited without the prior written consent of Trading Educators, Inc.
Trading Article - Creativity in your Trading-the Spiritual Factor
by Master Trader Joe Ross
Author, Trader, Trading Mentor, and Founder of Trading Educators, Inc.
Developer of Instant Income Guaranteed
I was asked the following question: “Joe, is it important to be creative in your trading?”
I’m not sure I can describe it in terms of importance. The creative process is somewhat of a mystery, even to scientists who study it, but that is only because scientists do not recognize the spiritual factors of our lives and consequently in our trading.
The Bible says: “There is a spirit in man.” Man is made up of body, soul, and spirit. In a moment we will look at how the spirit in man affects the soul of man and ultimately the body, but first we must understand what constitutes the soul!
The soul consists of three components: 1. the mind; 2. the heart, and 3. the will.
There are a few common characteristics that all creative persons possess, but for the most part, exactly how the creative mind makes earthshaking discoveries is through the impulse of the spirit. Those impulses come as “inspiration.”
A few prerequisites are necessary. The mind should be focused. New ideas need to flow freely through the mind, and there needs to be a wide range of ideas, so that they can be combined and re-combined in new ways.
New and creative trading ideas are important for a trader to be able to stay ahead of the crowd, so doing whatever you can to prepare your mind to consider new ideas will help to develop creative trading strategies that are essential to profitable trading.
Many great discoveries were made by what may appear to have been lucky observations. However, there is nothing having to do with luck about such discoveries. Those great discoveries are inspired; inspired is what we call the impulse that comes from the spiritual component of man. The word inspired itself means in-breathed. That breath derives from the spirit in man. Without a trained eye the observation might have been missed, but because the mind of the discoverer was continuously mulling over ideas, he or she saw something new in what might be termed an ordinary event. The discovery derives from inspiration, and inspiration comes from the spirit.
Discovering new trading ideas is the end result of creativity. You must get your creative impulses flowing in order to see a new idea. To get your creative impulses flowing you prepare your thinking processes, getting your mind ready to make a creative observation. But it is from your spirit that you get the impulse, i.e., the impetus that stirs your mind to creativity.
The spirit in man is what gives man intellect. It is the spirit in man that makes him vastly different from every other species on earth. No other creature reasons as man does; no other creature philosophizes. No other creature creates music, art, or literature. Man is the only earthly creature who can truly invent, plan, and organize anything he can imagine to do.
Animals operate on instinct. All spiders of a kind weave the same web. All bears of a kind hibernate. All animals mate by instinct, but man reproduces willfully and with pleasure. I could go on and on about the differences between man and the other creatures that inhabit this planet, but surely by now you can see that the difference is vast.
In some ways, your mind is like a water pump. You prime a pump to get the water flowing, and once it's started, it flows continuously. You must similarly prime your mind to get ideas flowing. It is your spirit that primes the pump of your mind. Various ideas in your mind are stored in a hierarchical structure. Information is stored together in various sectors of your mind, depending on its meaning. When you aren't thinking of a particular topic, it's hard to bring information about that topic into consciousness; it lies there dormant and hidden. However, when you make a definite effort to think carefully about a specific topic, or a closely related topic, and start running through the possibilities, new possibilities become apparent. Your mind scans various concepts and ideas, almost unconsciously. Suddenly this wealth of information combines and you see something new. For example, suppose you develop a trading idea about how you might make profitable trades by taking the breakout of reversal price bars. Once you get the basic idea in your mind, you unconsciously use your spirit to prime your mind to get your creativity flowing. For example, you begin looking at reversal bars in various markets and in different time frames to find support for your idea. As you look through the charts, the information you see will prime other related information. Other ideas will then come together, and you'll make an unplanned discovery that can serve as a basis for yet another trading strategy.
The main point is that you must set your thinking processes in motion to come up with a creative new idea. The more your mind is active, the more likely you'll make creative new discoveries. Knowing about the creative process and how your spirit sets it in motion gives you power. Some people feel dejected because they can't seem to think creatively. But with understanding of the spirit and with effort they can think creatively. They just need to know how to do it. Here are the steps:
- Be physically relaxed and get into a meditative mood.
- Be free of anxiety; allow your mind to wander, but do not empty your mind.
- Allow the thought processes to flow, that way you can allow your spirit to prime your mind in order to start the process. If you’re looking at a chart, ask yourself: “What do I really see here? What is this chart telling me?”
It takes a bit of practice, but soon you will see that the spiritual component of who you are will begin to inspire ideas into your mind. As your mind grasps the potential of the ideas, your emotions (your heart) will reflect those ideas. You will become excited and your body will find the energy and your mind will find the will to pursue your new discovery. You may even find yourself saying: “Why didn’t I see this before?”
© by Joe Ross. Re-transmission or reproduction of any part of this material is strictly prohibited without the prior written consent of Trading Educators, Inc.
Instant Income Guaranteed - HAS Trade
Philippe Gautier: Administration and New Developments
Developer: Joe Ross
On 24th April 2017, we gave our IIG subscribers the following trade on Hasbro Inc (HAS). We decided to sell price insurance as follows:
- On 25th April 2017, we sold to open HAS Jun 16 2017 90P @ $0.45, i.e. $45 per option sold, with 51 days to expiration, and our short strike below a major support zone and 12% below price action.
- On 10th May 2017, we bought to close HAS Jun 16 2017 90P @ $0.10, after 15 days in the trade, for quick premium compounding.
Profit: $35 per option
Margin: $1,800
Return on Margin Annualized: 47.31%
This trade was safe and had a decent return in a pretty low volatility environment ($VIX around 10).
We have also added new types of trades for our IIG daily guidance since 2016, "no loss" propositions with unlimited upside potential, still using other people's money to trade.
Philippe
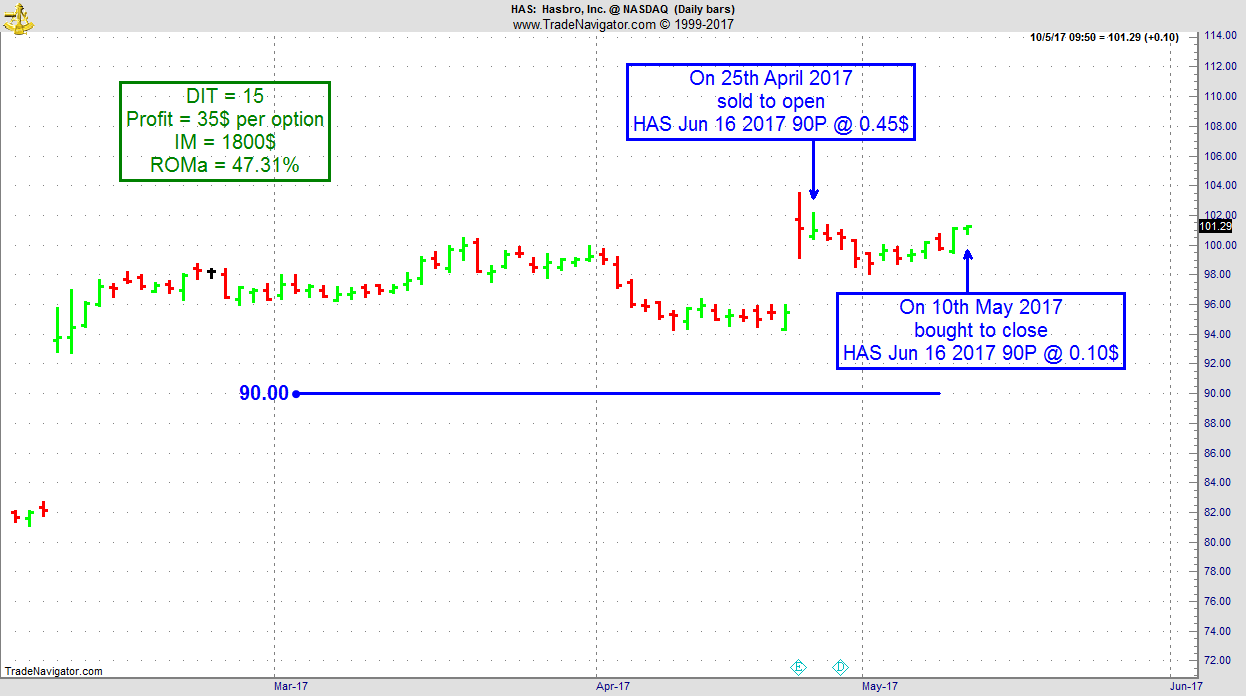
Receive daily trade recommendations - we do the research for you!
Instant Income Guaranteed
♦ SIGN UP TODAY! THIS IS WORTH THE INVESTMENT ♦
© by Joe Ross and Philippe Gautier. Re-transmission or reproduction of any part of this material is strictly prohibited without the prior written consent of Trading Educators, Inc.
Check out our Blog!
To view previous published Chart Scan newsletters, please log in or click on "Join Us,"
shown above, to subscribe to our free "Members Only" section.
A WEALTH OF INFORMATION & EDUCATION:
Joe Ross-Trading Educators' popular free Chart Scan Newsletter has been published since 2004.
Note: Unless otherwise noted, all charts used in Chart Scan commentary were created
by using Genesis Financial Technologies' Trade Navigator (with permission).
Legal Notice and Copyright 2017 Disclaimer - Published by Trading Educators, Inc.
Chart Scan is a complimentary educational newsletter.
© by Trading Educators, Inc. Re-transmission or reproduction of any part of this material is strictly prohibited without prior written consent.
More...
Edition 674 - May 12, 2017

Chart Scan with Commentary - 1-2 on Same Bar
by Master Trader Joe Ross
Author, Trader, Trading Mentor, and Founder of Trading Educators, Inc.
Developer of Instant Income Guaranteed
A couple of times this past week, people have asked me to explain how two points can possibly be on one bar using the Law of Charts. Since this question invariably comes up from time to time, I decided to show you how it can happen. First we will look at a chart sent to me by one of our students in Brazil. The chart shows a #1 and a #2 point existing on a single bar. Next you will see a hand drawn chart I made to answer a question, in which you will see a #2 and #3 point existing on the same bar.

The Law of Charts dictates that the #1 point of a 1-2-3 high formation must be equal to or in itself be the highest high. Following the bar labeled 1-2, we see first a higher low followed by a higher high, thus creating the 1-2 on the same bar.
In the chart below, we note that the Law of Charts dictates that the #2 point must be equal to or in itself be the lowest low following the #1 point. Following the bar labeled 2-3, we have first a higher low followed by a higher high, thus creating the 2-3 on the same bar.
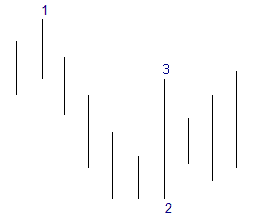
© by Joe Ross. Re-transmission or reproduction of any part of this material is strictly prohibited without the prior written consent of Trading Educators, Inc.
Instant Income Guaranteed - BG Trade
Philippe Gautier: Administration and New Developments
Developer: Joe Ross
On 11th July 2016, we gave our subscribers a new type of trade on Bunge Limited (BG), to play the recovery of the agricultural sector.
We entered a "complex position" for a net credit (still working with OPM, i.e. other people's money, as usual), but with unlimited upside potential.
- On 12th July 2016, we entered the trade for a credit of $3.25 (or $325 per position).
- On 1st December 2016, we took partial profits on our long position.
- On 28th December 2016, we took new partial profits on our long position.
- On 20th April 2017, we closed our short position (no more margin requirement for the trade).
- On 3rd May 2017 we closed our last long position.
Profit: $908
Margin: $1,721
Return on Margin Annualized: 65.29%
These are low maintenance, low stress trades with lots of upside potential.
We presently have 24 of these trades opened and we closed 5 already.
Philippe
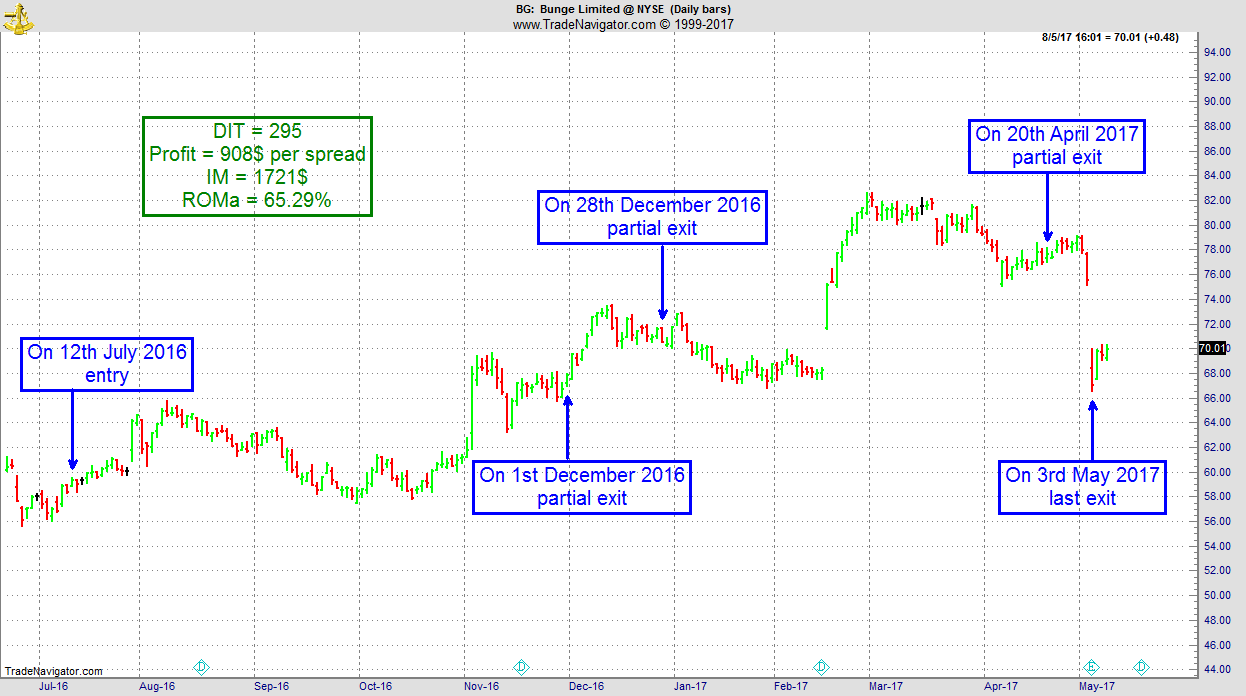
Receive daily trade recommendations - we do the research for you!
Instant Income Guaranteed
♦ SIGN UP TODAY! THIS IS WORTH THE INVESTMENT ♦
© by Joe Ross. Re-transmission or reproduction of any part of this material is strictly prohibited without the prior written consent of Trading Educators, Inc.
Blog Post - Is it really possible to be consistently profitable?
by Professional Trader Andy Jordan
Educator for Spreads, Options, Swing/Day Trading, and
Editor of Traders Notebook Complete and Traders Notebook Outrights
Find out the consequences to negative thinking. Read more.
© by Andy Jordan. Re-transmission or reproduction of any part of this material is strictly prohibited without the prior written consent of Trading Educators, Inc.
8 Tips on How to be an Open-Minded Trader
by Professional Trader Marco Mayer
Educator for Forex and Futures, Systematic Trader, and
Creator of Ambush Trading Method, Ambush Signals, and AlgoStrats.com
In my last article, I wrote about why it is so important to stay as open-minded as possible as a trader.
But that is easier said than done, so here are 8 tips you can actively follow on how to be more open-minded:
- Question everything and never stop doing so. There’s only one way to continue improving and that’s to constantly question your beliefs about trading and yourself. If you think you figured something out forever, you’re probably in trouble! That strategy that has been working for years might have stopped doing so. Maybe a market you’re trading in has changed in a significant way and you need to adopt.
- Doing so you have to be completely honest with yourself and your trading and scrutinize everything to make sure your trading and your beliefs about the markets are as close to reality as possible. You do want to know when you’re wrong or have made a mistake right away. Even if that truth might hurt. If you’ve been working on a trading strategy for weeks you want it to work, you want that edge to be true. But the fact is that if it’s not, you do want to know that, otherwise the markets will take it apart for you!
- Never stop learning. The markets, it’s participants and the trading technology evolves quickly. To stay ahead of the game you have to know what’s going on. Read new books that come out, watch videos, read articles and blog posts. There might even be some interesting posts on Twitter, Facebook, and other social media sites.
- But while doing so never believe any "truth" you hear or read about the markets before you have verified it for yourself. Doesn’t matter if it’s on TV, a trading book, a forum or from Paul Tudor Jones himself. In my experience, most of the information you can get for free or for significant amounts of money is absolutely worthless in terms of potential real trading profits. That’s why you need to scrutinize all of it.
- Workout, meditate or do whatever helps you to reset your brain on a daily basis. Find some method that works for you and make it into a routine. This will create the space in your head that’s required to come up with unique ideas.
- Try to get completely away from the markets for longer periods at least twice a year. After trying to crack the markets for months we all tend to get stuck and stop seeing the simple solutions. This is when you need a break so you can start from scratch again. You’ll find that very often you’ll solve the problem you’ve been working on right away after the break. Go on vacation, visit your parents, travel! Whatever helps you to free your thoughts from the markets for a while. For me, hiking does the job.
- Relax. This might be the best and the hardest to follow advice. Of course, it’s necessary to think through everything in a logical way when it comes to trading. And this works fine, but the best trading ideas/ideas for a new system usually come by themselves and as a surprise. You can not force these and thinking hard will take you only to a certain point. At some point, you have to relax and trust in your subconscious (or whatever you want to call it) to work this out for you. That’s when the magic can happen and an idea/solution you never thought about before is suddenly there. Eureka!
- Get in touch with other traders. Talking to someone else about trading who understands what you’re talking about can be very helpful. You can exchange ideas, get completely new perspectives and if you’re talking with someone honest get your ideas and views challenged. This can be very helpful as it forces you to clarify your trading thoughts that can be quite vague. Just having someone ask you "why?" and "how?" a couple of times might save you from wasting weeks of time. And of course, it’s fun to meet other traders!
As always, should you have any questions or feedback, don't hesitate to send me an email, This email address is being protected from spambots. You need JavaScript enabled to view it..
Happy Trading!
Marco
© by Marco Mayer. Re-transmission or reproduction of any part of this material is strictly prohibited without the prior written consent of Trading Educators, Inc.
Check out our Blog!
To view previous published Chart Scan newsletters, please log in or click on "Join Us,"
shown above, to subscribe to our free "Members Only" section.
A WEALTH OF INFORMATION & EDUCATION:
Joe Ross-Trading Educators' popular free Chart Scan Newsletter has been published since 2004.
Note: Unless otherwise noted, all charts used in Chart Scan commentary were created
by using Genesis Financial Technologies' Trade Navigator (with permission).
Legal Notice and Copyright 2017 Disclaimer - Published by Trading Educators, Inc.
Chart Scan is a complimentary educational newsletter.
© by Trading Educators, Inc. Re-transmission or reproduction of any part of this material is strictly prohibited without prior written consent.
Edition 673 - May 5, 2017

AlgoStrats:FX Free Trial & April Report
by Professional Trader Marco Mayer
Educator for Forex and Futures, Systematic Trader, and
Creator of Ambush Trading Method, Ambush Signals, and AlgoStrats.com
Another month passed by and as there have been some exciting changes happening at AlgoStrats:FX I wanted to give you a quick update.
First of all, we are offering you a Free Trial starting now until May 10th. Go ahead and join us for free! If you already have an account, you can simply login with your existing account. If you don’t have one yet, register here. And if you forgot your password, you can go here to reset it.
I've been quite excited about the month of April as I have been working on some major changes to AlgoStrats:FX during the last couple of months which have finally all been implemented in March.
To learn more about what changed in AlgoStrats:FX 2.0 and how it actually performed in April, check out this video:
That's it! As always, should you have any questions or feedback, don't hesitate to send me an email, This email address is being protected from spambots. You need JavaScript enabled to view it..
Happy Trading!
Marco
Join the AlgoStrats:FX Free Trial
© by Marco Mayer. Re-transmission or reproduction of any part of this material is strictly prohibited without the prior written consent of Trading Educators, Inc.
Trading Idea - Selling Soybean Oil Puts
by Professional Trader Andy Jordan
Educator for Spreads, Options, Swing/Day Trading, and
Editor of Traders Notebook Complete and Traders Notebook Outrights
It took a while until the July Soybean Oil broke out of the range, but with the break and close above 32.30 Soybean Oil might move higher. Also the Implied Volatility is high in Soybean Oil compared to other markets. I would not want to touch Currencies or Financial markets until the French Presidential Election on May 5, but I don’t see any high risk for the Soybean Oil market.
In Traders Notebook we have started to sell July puts with a strike price at 30.00.
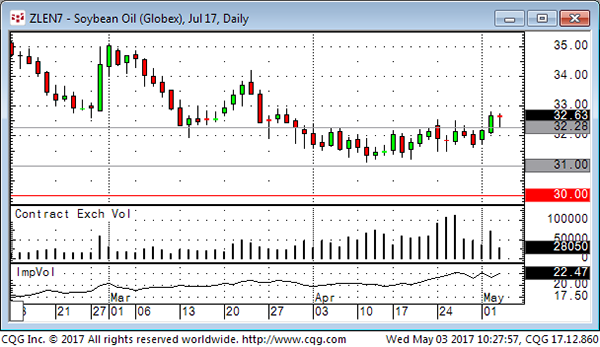
Do you want to see how we manage this trade and do you want to get detailed trading instructions every day?
Please visit our website for additional information:
Traders Notebook
Blog Post - Kramer (from the Seinfeld show) on the Swiss Franc
by Professional Trader Andy Jordan
Educator for Spreads, Options, Swing/Day Trading, and
Editor of Traders Notebook Complete and Traders Notebook Outrights
“Hello, Kramer? You got a minute? Take a look at the Swiss Franc chart what do you think?” Read more.
© by Andy Jordan. Re-transmission or reproduction of any part of this material is strictly prohibited without the prior written consent of Trading Educators, Inc.
Chart Scan with Commentary - Gaps
by Master Trader Joe Ross
Author, Trader, Trading Mentor, and Founder of Trading Educators, Inc.
Developer of Instant Income Guaranteed
I don't know where the term "stop-gap" originated, but I do know that it certainly applies to the markets. It seems that when traders see a gap, they are not sure of where to place their protective stop, so many of them place it at one end or in the middle of the gap. Remember, if you will, that it is the job of the market to fill orders; prices almost surely will move to fill the gap. I once read somewhere that gaps are always filled. The use of the word "always" usually gives me the chills. Virtually nothing in the markets is "always."
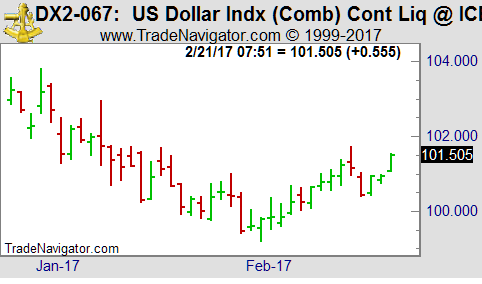
I'm looking at a March 2017 Dollar Index chart on February 21, 2017, and I see prices having just made a gap. Will that gap be filled? I really don't know. There is nothing in my notes that states that "gaps must be filled!" However, to state that gaps are usually filled would be true, and that is what I see as possibly happening.
Gaps on daily charts are less frequent now that more and more markets are becoming fully electronic and trading pretty much around the clock. This means that when you do see a gap, it has more significance than in the past. The question we receive most often is, "What should I do about gap openings?" "Should I trade the back-fill?" In the past, it was true that trading the back-filling of a gap was right 50% of the time and wrong 50% of the time.
However, you always have to pay the commission, so it did not pay to trade on the back-fill unless you could prove by testing that it paid you to do so in any one individual market.
Now that gaps occur less frequently, it is crucial to test what happens in a particular market when a gap occurs, especially as trading continues to increasingly trade 24-hours.
One question you will want to ask, market-by-market, is "Does this market usually move in the direction of the gap following the back-fill, or does it move in the opposite direction from the gap following the back-fill?"
© by Joe Ross. Re-transmission or reproduction of any part of this material is strictly prohibited without the prior written consent of Trading Educators, Inc.
Trading Article - Time stops in intraday trading
by Master Trader Joe Ross
Author, Trader, Trading Mentor, and Founder of Trading Educators, Inc.
Developer of Instant Income Guaranteed
For the most part, trader’s stops are based on money, ticks, pips or some percentage of their trading account. All of these are money management stops. In this respect, the level selected for the stop should take into consideration your risk tolerance.
However, very few traders use time stops in addition to money management stops. Time stops are trade management stops.
Using a time stop is quite simple. You apply a stop to your intraday positions which has nothing whatsoever to do with price. With a time stop, you decide how much time since entry is enough for your position to have moved in the direction you anticipated.
When you are trading there are two ways to be wrong:
- You can be wrong about direction
- You can be wrong in your timing.
Think about how many times you have entered a position, then saw your money management protective stop get hit for a loss, only to see the market turn around, and go in your desired direction; a most discouraging situation. You were right about the direction it was your timing that was wrong!
The idea behind the use of a time stop is that it has been proven that the longer an intraday trade remains suspended between a profit and a loss the more likely it is that the position will produce a loss.
The use of a time stop goes hand-in-hand with having a defined trading plan. You should have a well-defined setup or entry signal, a definite profit objective, and a money management stop loss. The stop loss can be fixed or trailing, as you prefer.
The question almost always comes up: “How long should I give the trade to materialize before I simply exit?”
The answer is that you make that determination through study and testing of your chosen market and time frame. If you trade in more than one market, then you make the determination for each market and time frame in which you actually trade.
Experience has shown that the best time to get out—win or lose—is when trading slows down while you are still in the position.
What we want to gain by using a time stop is a reason to exit those trades which are hanging around break even, but have are not really going anywhere—doing nothing to encourage us to stay in the trade. Profits are made when there is momentum in the direction of our profit objective. If momentum decreases, simply get out. You will find that some of the time you will exit with a profit and other times with a loss. Either one will be small and inconsequential in the long run.
When a market becomes volatile a time stop may be as little as 1 minute. If volatility is low, you may choose 5 or 10 minutes for the trade to go your way.
Even when using a time frame as long as 60 minutes in a less volatile environment, your time stop is not likely to be more than 30 minutes.
The major objection to the use of time stops is that they can involve a lot of in-and-out trading. It is true that positions are exited even when they are not actually losing money, simply because they have run out of time to materialize. I have no argument against that point, it is valid.
However, experience dictates that sitting in front of a screen hoping that a position reaches your profit objective, more often turns into a loss than into a profit. You certainly don’t want to be holding a position when liquidity dries up, the market suddenly becomes volatile, or you see an entry signal for a trade in the direction adverse, to your current position.
You should become aware of those times when liquidity dries up. Typically, it will be around the lunch hours of the major trading centers. Also be aware of when reports or news releases are scheduled to come out. Ten to fifteen minutes before a report or news release is due to come out, liquidity will dry up as traders wait to see what is in the report.
Keep in mind that although electronic markets are open for extended hours, traders are not willing to trade during all those hours, so liquidity tends to dry up during the hours when a lot of traders are simply asleep. Traders are creatures of habit. They still tend to trade the most during the hours they traded during the years prior to electronic trading.
The use of time stops adds a dimension to your trading that few traders ever employ. If you use them wisely they can definitely improve your trading. Time stops quickly dispatch non-performing positions and reduce the burden carrying a position that is going nowhere.
Instant Income Guaranteed - TSO Trade
Philippe Gautier: Administration and New Developments
Developer: Joe Ross
Underlying stocks don't always go straight up or sideways after our entry. So it is of utmost importance to choose our short put strikes carefully.
On 19th March 2017, we gave our IIG subscribers the following trade on Tesoro Petroleum Corporation (TSO). We decided to sell price insurance as follows:
- On 20th March 2017, we sold to open TSO Apr 28 2017 75P @ $0.40, i.e. $40 per option sold, with 38 days to expiration, and our short strike below a major support zone and 12% below price action.
- On 24th April 2017, we bought to close TSO Apr 28 2017 75P @ $0.10, after 35 days in the trade.
Our short strike was never violated during the life of the trade (lowest daily low 11 ticks above $75 put strike).
Profit: $30 per option
Margin: $1,500
Return on Margin Annualized: 20.86%
We have also added new types of trades for our IIG daily guidance since 2016, "no loss" propositions with unlimited upside potential, still using other people's money to trade.
Philippe
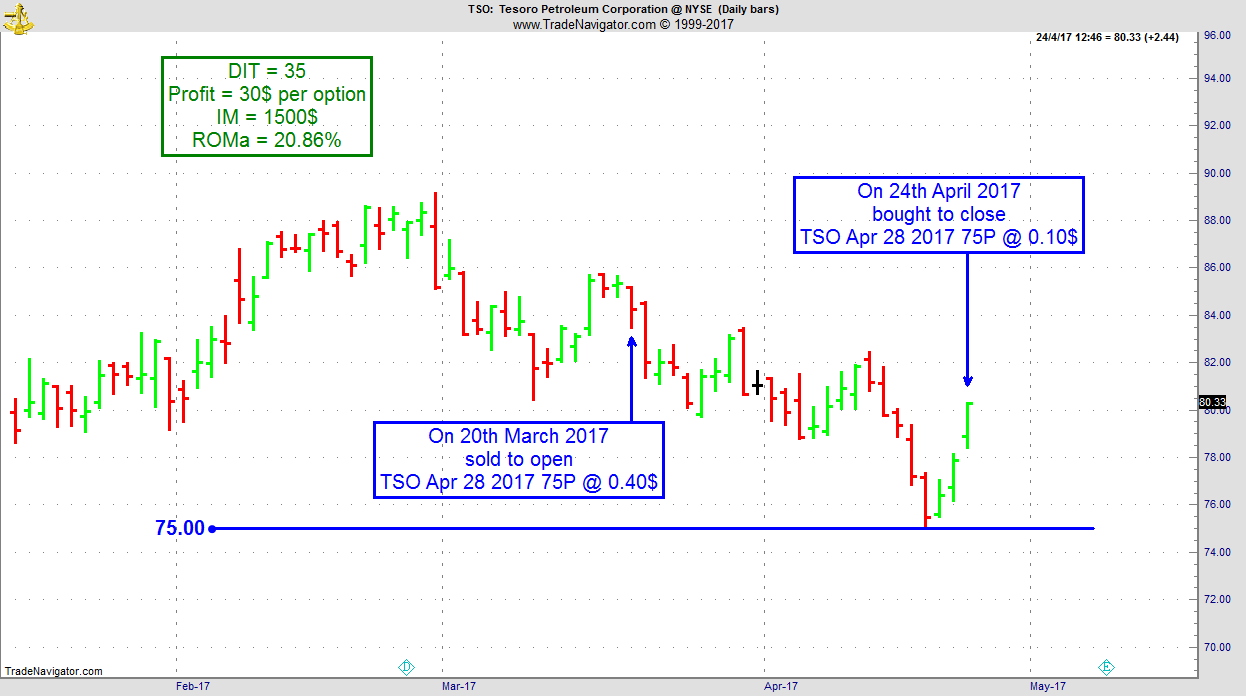
Receive daily trade recommendations - we do the research for you!
Instant Income Guaranteed
♦ SIGN UP TODAY! THIS IS WORTH THE INVESTMENT ♦
© by Joe Ross. Re-transmission or reproduction of any part of this material is strictly prohibited without the prior written consent of Trading Educators, Inc.
Check out our Blog!
To view previous published Chart Scan newsletters, please log in or click on "Join Us,"
shown above, to subscribe to our free "Members Only" section.
A WEALTH OF INFORMATION & EDUCATION:
Joe Ross-Trading Educators' popular free Chart Scan Newsletter has been published since 2004.
Note: Unless otherwise noted, all charts used in Chart Scan commentary were created
by using Genesis Financial Technologies' Trade Navigator (with permission).
Legal Notice and Copyright 2017 Disclaimer - Published by Trading Educators, Inc.
Chart Scan is a complimentary educational newsletter.
© by Trading Educators, Inc. Re-transmission or reproduction of any part of this material is strictly prohibited without prior written consent.
Edition 672 - April 28, 2017
Chart Scan with Commentary - The Secret of Reduced Margin Spreads
by Master Trader Joe Ross
Author, Trader, Trading Mentor, and Founder of Trading Educators, Inc.
One of the best kept secrets in trading is that of reduced margin spreads. You cannot name many ways to trade that provides more safety or a greater return on margin than does a reduced margin spread, while also being one of the least time- consuming ways to trade. Have you ever asked yourself why it is that many of the largest, most powerful traders trade spreads? I’m going to show you why!
WHAT IS A REDUCED MARGIN SPREAD?
Because of perceived lower volatility, exchanges grant reduced margins on certain types of spreads. Spreads consist of being long in one or more contracts of one market and short in one or more contracts of the same market but in different months—an Intramarket spread; or being long in one or more contracts of one market and short one or more contracts of a different market, and in the same or different months—an Intermarket spread.
DISTORTIONS ABOUT SPREADS
There are some distortions about spread trading that need to be dispelled. If we get them out of the way, I can show you the tremendous advantages spread trading has over any other form of trading.
It is said that spreads do not move as much as outright futures. I agree 100% with that statement. However, I believe that spreads trend much more often than outright futures, they trend much more dramatically than outright futures, and they trend for longer periods of time than do the outright futures. For these reasons you can make much more money with spreads than with the outrights.
The second distortion about spread trading goes like this: “You have to pay double commissions when you trade spreads.” Yes! You have to pay two commissions for every spread you enter in the market. So what? You are trading two contracts instead of one. You pay two commissions because you are trading two separate contracts, one in one place and the other in an entirely different place. Paying two commissions for two separate trades is hardly unfair. Let me tell you what is unfair—paying a round turn commission for an option that expires worthless. Why don’t you hear people complaining about that? You pay for a round turn, and you receive only half a turn. Doesn’t make a lot of sense, does it?
ADVANTAGES OF SPREAD TRADING
There are so many advantages to trading reduced margin spreads that I hope I don’t run out of room here before I can tell you all of them. Let’s begin with return on margin, i.e., yield.
Yield: As I write this, the margin to trade an outright futures position in crude oil is $4,725, whereas a spread trade in crude oil requires only $540, only 11.4% as much. If crude oil futures move one full point, that move is worth $1,000. If a crude oil spread moves one full point, that move is worth $1,000. That means either a 1-point favorable move in crude oil futures or a 1-point favorable move in a crude oil spread earns the trader $1,000. However, the difference in return on margin is extraordinary: In the futures the return is $1,000/$4,725=21%. For the spread, the return is $1000/540=185%. Think about that!
Leverage: This leads us to the next benefit of spread trading—with the same amount of margin, you could have traded 4 soybean spreads instead of one soybean futures. How’s that for leverage? Instead of making $250 on a five-point move, you could have made $1,000. Reduced margin spreads offer a much more efficient use of your margin money.
Trend: Earlier I said that spreads tend to trend much more dramatically than outright futures contracts. Not only that, but they trend more often than do outright futures. I don’t have room here to show you the dozens of sharply trending spreads that can regularly be found in the markets, so we’ll have to settle for a recent one. You’ll have to take my word for it that this sort of trending happens frequently when trading spreads.
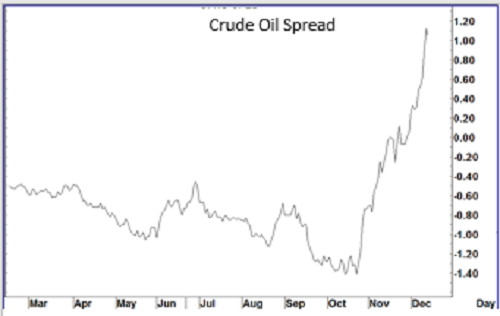
Opportunities: Because spreads tend to trend more often and more dramatically than do outright futures contracts, they offer more opportunities for earning money, and they do so without the interference and noise caused by computerized trading, scalpers, and market movers. Spreads avoid the “noise” in the markets. There are numerous reduced margin spread opportunities, enough to keep almost any trader busy. And it is the lack of interference by market makers and shakers that leads us to one of the most important advantage of trading spreads, whether they be reduced margin or full margin.
Invisibility: One of the primary problems with any kind of trading in the outrights, whether it be in futures or stocks, is that of stop running. The insiders love it when they can see your order. Even when your entry or exit is held mentally, they know where it is. They are keenly aware of where people place their orders. That is why they love Fibonacci and Gann traders. They know precisely where those people will place their orders. The same is true for anyone who uses one of the more commonly known indicators. The insiders fade moving average crossovers, and so-called overbought and oversold—regardless of which indicator is used to show either of those conditions. They know when prices have reached the outer limits of the Bollinger Bands, and they know the location of supposed support and resistance, etc. But with spreads, they have no idea of the location of your orders. You are long in one market and short in another. Your position is invisible to the insiders. They can’t run your stop, because you don’t have one. You cannot place a stop order in the market when trading spreads! Your exit point is entirely mental; it exists exclusively in your head. In that respect, spread trading is a purer form of trading. It is the closest thing in trading to having a level playing field. Could that be the reason you hardly ever hear about spread trading?
Liquidity: Attempting to trade in “thin” illiquid markets is one of the surest ways to encounter serious stop running and bizarre price movements. However, other than occasional problems with getting filled, spread trading does not suffer from a lack of liquidity—which in itself creates more trading opportunities. I would never consider taking an outright position in feeder cattle. Feeders are a thin, illiquid market normally best left to professional interests. But a reduced margin (feeder cattle)-(live cattle) spread is something I look for all the time. Some of the moves in this particular spread are incredible. They are worth hundreds and even thousands of dollars per spread, several times a year. They are highly seasonal in nature due to the birth and growth cycles of cattle. The same thing is true of spreading both live and feeder cattle against lean hogs. These spreads are seasonal, which brings us to the next great advantage to spread trading - seasonality.
Seasonality: Whereas seasonality doesn’t always take place as planned, i.e., seasonality can come early, late, or not at all, but when it is happening, you can see it. It is obvious when a seasonal trade is working as expected. Seasonality is not subject to the whims of man. Seasonality is one of the strongest reasons for trading spreads. Crops are planted within a given period of time. Calves and piglets are born according to their birth cycle and they grow according to their growth cycle. Even futures based on financial instruments are seasonal, and many of them offer reduced margin spreads.
Inversion: Along with seasonality comes the huge profits that can be made when an underlying market become inverted (goes into backwardation). This is true for any agricultural commodity as well as any financial instrument. I don’t have space here to explain inversion, but when it occurs, which is commonplace, the spread between front and back months can widen tremendously, thereby offering marvelous profit-making opportunities to the spread trader. As if that weren’t enough, the same opportunity becomes available when the period of backwardation ends and the relationship between front and back months returns to normal.
Probabilities: If we eliminate those trades in the outrights in which you get yourself whipsawed in a sideways market and maybe win or lose a little, the actual odds of winning on any trade is 50%. If you are long and prices move down, you lose. Conversely, if you are short and prices move up, you lose. It doesn’t matter how accurate is your trade selection, the bottom line is that your chances of being right once you enter a trade are one in two. However, when you enter a spread you are not primarily concerned with the direction of prices. Your primary concern is with the direction of the spread.
With a spread you can make money when both legs of the spread are moving up, both legs are moving down, when both legs are moving sideways but one more so than the other, or best of all, when the leg you are long is moving up and the leg you are short is moving down! As long as the leg you are long is moving better than the leg you are short, you will have a winning trade. There is only one situation in which you can lose with a spread, and that is to be dead wrong about both legs. So with a spread you can win even if you were wrong about the direction of price movement, as long as you’re not too wrong. The chart gives you an idea of what I’m talking about. Both months of this natural gas trade were moving down, but the spread was widening and moving up.
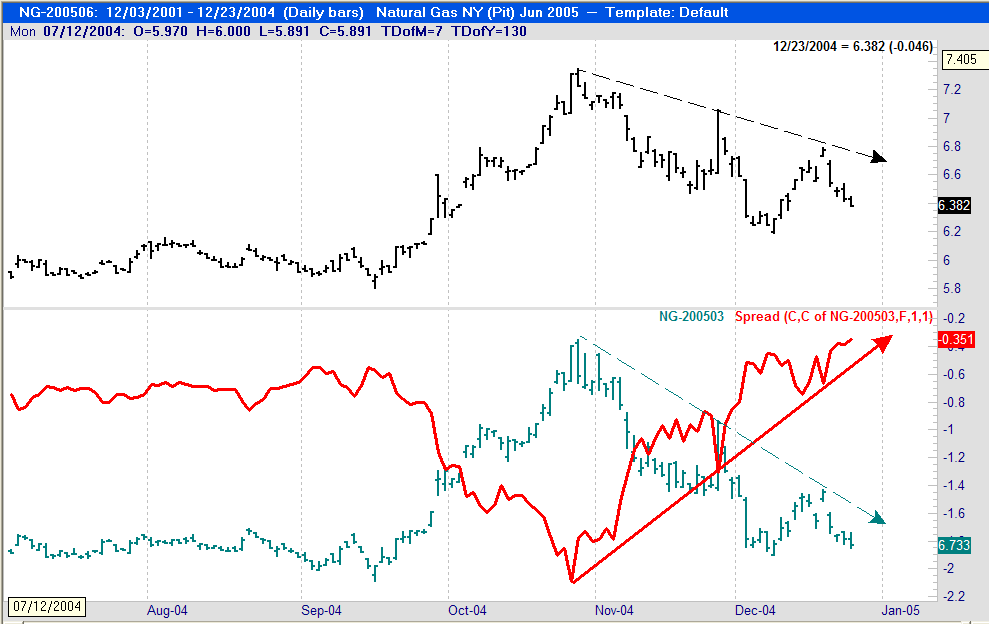
(Source Genesis Financial Data Systems)
There are additional opportunities in spread trading, including spreads that require full margin. You can trade spreads with stock indexes, sector funds, and single stock futures. Did you know you can daytrade stock index spreads? These are topics for another day and another time.
Unfortunately, either by accident or design, much of the truth of spread trading has been lost over the years. There are many more aspects to it than I have touched on here. Furthermore, there are some wonderful and inexpensive tools available that make spread trading a delight. Spread trading is one of the most relaxed ways to trade. It rarely takes more than 1-2 hours of your time each day, and more often than not, we are talking about only minutes per day to seek out and trade the wonderful opportunities that are available in reduced margin spreads.
Now that I’ve told you about spreads, my secret is no longer a secret.
To learn more about Spreads, click here!
© by Joe Ross. Re-transmission or reproduction of any part of this material is strictly prohibited without the prior written consent of Trading Educators, Inc.
Instant Income Guaranteed - HST Trade
Developer: Joe Ross
Administration and New Developments: Philippe Gautier
On 16th November 2016 we gave our IIG subscribers the following trade on Host Marriott Financial Trust (HST). We decided to sell price insurance as follows:
- On 17th November 2016, we sold to open HST Jan 20 2017 14P @ $0.15, i.e. $15 per option sold, with 63 days to expiration, and our short strike below a major support zone and 18% below price action, making the trade very safe.
- On 7th December 2016, we bought to close HST Jan 20 2017 14P @ $0.05, after 20 days in the trade, for quick premium compounding.
Profit: $10 per option
Margin: $280
Return on Margin Annualized: 65.18%
This trade was suitable for small accounts.
We have also added new types of trades for our IIG daily guidance since 2016, "no loss" propositions with unlimited upside potential, still using other people's money to trade.
Philippe
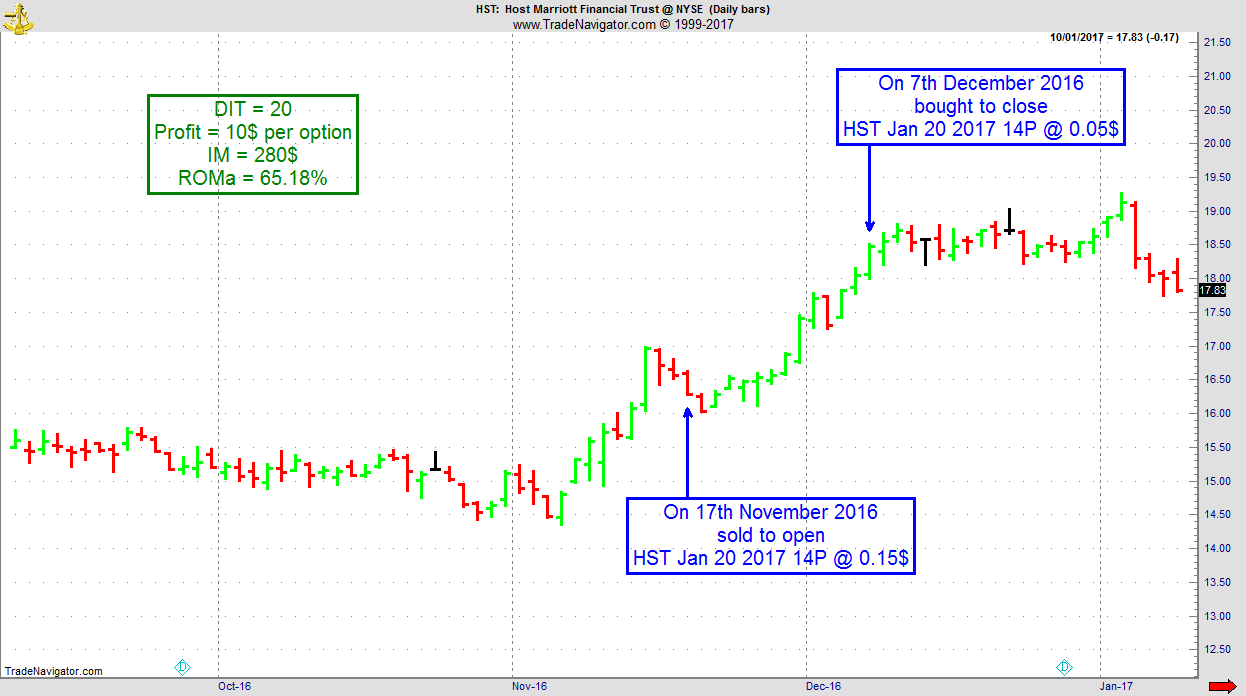
Receive daily trade recommendations - we do the research for you!
Instant Income Guaranteed
♦ SIGN UP TODAY! THIS IS WORTH THE INVESTMENT ♦
© by Joe Ross. Re-transmission or reproduction of any part of this material is strictly prohibited without the prior written consent of Trading Educators, Inc.
by Professional Trader Marco Mayer
Educator for Forex and Futures, Systematic Trader, and
Creator of Ambush Trading Method, Ambush Signals, and AlgoStrats.com
One of the lessons I learned the hard way in trading is that to become and to stay successful as a trader, you have to be very open-minded. Unfortunately, this is easier said than done and many traders fail to stay open-minded in the long run.
This is a very common trap for traders you're having success early in their trading career. Maybe you started trading back in the early 90s when the stock markets moved from one high to the next. You learned a very simple long-only strategy to trade stocks and of course, you were very successful doing that. But in the year 2000 everything changed and that super bull markets turned into an ugly bear market. A completely new environment to trade in and guess what your long-only trading strategy stops working. But as you've been making nice money with it for almost 10 years it's very hard to stop trading it. On every little profit you make, you start hoping it might work again. But as the stock markets continue to collapse, so does your equity.
That trader can hardly be blamed for not being open-minded enough to see that and stop trading the strategy before it's too late. It's a very difficult thing to do. And that's why most traders who've had a very good start usually give it all back to the markets later on.
But there are also traders who've been around for a while that should know better by now. Still, they believe that only one way of trading is right and try to stick to it forever, happily ignoring all the facts telling them the opposite. Often, they're the ones who love hanging out in trading forums to tell everyone the truth about trading. Whenever someone wants to tell you "the truth about the markets", run as fast as you can!
If there is a truth in trading and the markets, it can be summarized in "it changes all the time". Whenever you think you've seen it all, something new happens. Truths like "bonds and stock market are highly correlated" simply become untrue. Whole markets become illiquid or disappear. Trading costs is another factor that can make markets untradeable (or tradable) for a specific strategy. And of course, market participants change all the time.
Because of that, trading strategies that worked for years can simply stop working. It will be very interesting to see what happens to many traders/strategies/hedge funds that are currently relying on some kind of long-only stock market strategies when things become ugly again.
So that's one of the reasons you have to stay flexible and open-minded in this business. Markets change. If you don't adapt, you won't survive.
But you also need an open mind to be successful in developing trading strategies and looking for market edges. Very often you'll find that the very opposite of what you believe or read in a trading book is actually true. But you won't find that out if you're not ready to challenge what you believe to the true right now. Is a certain chart pattern that is categorized as "bullish" all over the internet actually "bullish"? Or might the truth be that chances of success are much higher fading that signal? Go ahead and find out!
Also if a strategy looks like the worst strategy ever, maybe it's going to be a good one if you do the opposite? The same is true for indicators, think of new ways to use them. Maybe it's actually meaningless if an indicator hits a specific value where it's supposed to be "overbought" but it's an excellent indicator to show a change in momentum by looking at its change from one period to the next?
Other things traders tend to get attached to are specific markets or trading styles. "I trade only the EUR/USD and I never hold a trade overnight". Good luck with that! This means you'll hit some very serious drawdowns (or have to completely stop trading if you have a filter for that) whenever the volatility of EUR/USD gets too low to profitably day trade in that market. And these periods can last for years! As this can be true for whole asset groups like currencies, it's always good to be able to switch to wherever the action is (energy markets, bonds, stock indices for example).
Of course, when it comes to the actual execution part of trading, there's no room for you to be open-minded. Here you have to be 100% disciplined and stick to your rules and risk management. If you're open-minded about how much you'll risk on the next trade, you've clearly overdone it :)
Happy Trading!
Marco
© by Marco Mayer. Re-transmission or reproduction of any part of this material is strictly prohibited without the prior written consent of Trading Educators, Inc.
Blog Post - Avoiding Stress
by Professional Trader Andy Jordan
Educator for Spreads, Options, Swing/Day Trading, and
Editor of Traders Notebook Complete and Traders Notebook Outrights
Humans are not machines, stress is evident and how to avoid it is explained in Andy's latest blog post. Read more.
© by Andy Jordan. Re-transmission or reproduction of any part of this material is strictly prohibited without the prior written consent of Trading Educators, Inc.
Check out our Blog!
To view previous published Chart Scan newsletters, please log in or click on "Join Us,"
shown above, to subscribe to our free "Members Only" section.
A WEALTH OF INFORMATION & EDUCATION:
Joe Ross-Trading Educators' popular free Chart Scan Newsletter has been published since 2004.
Note: Unless otherwise noted, all charts used in Chart Scan commentary were created
by using Genesis Financial Technologies' Trade Navigator (with permission).
Legal Notice and Copyright 2017 Disclaimer - Published by Trading Educators, Inc.
Chart Scan is a complimentary educational newsletter.
© by Trading Educators, Inc. Re-transmission or reproduction of any part of this material is strictly prohibited without prior written consent.
Edition 671 - April 21, 2017

Click on the above picture or here to view our Home Page!
Trading Idea: Short ESM7 (June E-Mini S&P 500)
by Professional Trader Andy Jordan
Educator for Spreads, Options, Swing/Day Trading, and
Editor of Traders Notebook Complete and Traders Notebook Outrights
When we look at the ES on the weekly chart we notice the completed 1-2-3 high formation in March and we see the possible Ross Hook to the down-side.
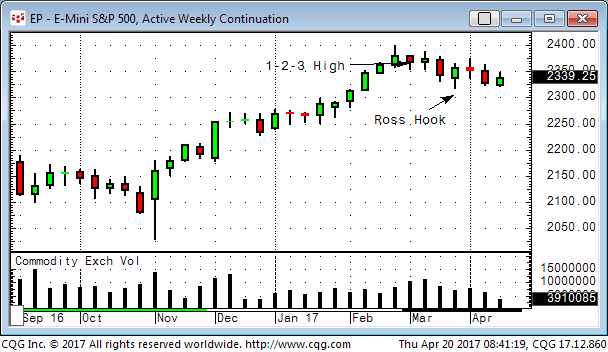
When we look at the daily chart we see, that we also have a Ross Hook to the down-side as well and therefore a short entry might make sense.
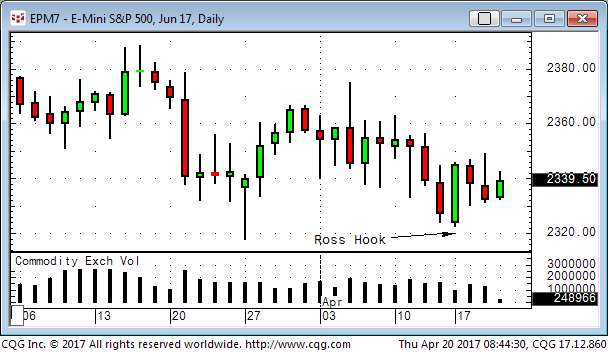
How to manage the entry and the trade depend on what time frame you use for your trading, but an idea could be to use 30- or 60-minute charts to time the entry on a shorter time frame and to reduce the risk. Of course you can use 15-minute or 120-minute charts as well, it depend all on your preferences. A first target could be the March 27 low and if we break lower 2300 could also be possible.
Learn from an expert - receive his daily trade recommendations!
Traders Notebook Complete
© by Andy Jordan. Re-transmission or reproduction of any part of this material is strictly prohibited without the prior written consent of Trading Educators, Inc.
FREE Webinar by Andy Jordan
Futures Spread Trading - A Dynamic but Overlooked Aspect Of Trading
April 24, 2017
1:00 PM, EDT
Trading calendar spreads and/or inter-commodity spreads is one of the less volatile, more conservative, more reliable ways of trading. Join Andy Jordan, professional trader and trading coach, as he explains and demonstrates the advantages of spread trading and how to use spreads in today’s markets. Andy has been trading futures spreads for more then 15 years and is the “spread guru” at Trading Educators.
Go to our Home Page and scroll down to our "Register Today" button
Lead By Example!
Our Traders Know How to Relax When Not Trading
Andy Jordan recently went to the beach!

No Laptop, No Markets….Just Beeeeer!
Check out more of my vacation pics!
Chart Scan with Commentary - Planning: A Key to Successful Trading
by Master Trader Joe Ross
Author, Trader, Trading Mentor, and Founder of Trading Educators, Inc.
From time to time I get some very interesting confessions. Here is a very recent one, along with a solution.
“I had been looking at a profitable trade setup all day. I studied indicator after indicator looking for confirmation, even though I know many are correlated and redundant. But I just kept on searching. I thought, ‘Maybe I missed something.’ My account is now so small that I just wanted to be sure that this was the right trade. My thought was that I must take into consideration anything and everything that could cause this trade to fail. I can’t afford to lose any more money. What should I do?”
Like most traders in this kind of situation, there is a need to have the ability to make a decision, but it is difficult to do if the trader is undercapitalized and in the position of making trading decisions out of fear and uncertainty.
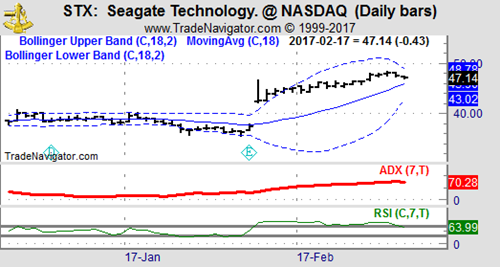
Many traders suffer from too much analysis. They are looking at so many things, they can no longer see straight. If a trader keeps on over-analyzing trades, “analysis paralysis” may set in and develop into a deep-seated psychological problem.
Carefully analyzing the possible consequences of trading decisions is healthy, but it becomes unhealthy when it is overdone. When it comes to trading, it’s important to have a clearly defined trading plan. Be as certain as is possible that any given trade is not going to wipe out the trading account. That is one of the reasons we suggest the use of a time stop when trading in addition to a money stop. When using both types of stops they clearly define the signs and signals that indicate a trading plan is not working, suggesting that the trade should be closed out in order to protect trading capital. It is important to realize that a trader might not only be wrong about the direction of prices but that it is also possible to be wrong about the timing of an entry into a market. Either one can end up in a losing trade.
Trading, by its very nature, is uncertain. There is little that can be described as security for traders. Every trade is a new event, and every entry is an entirely new business. A trader does not have the luxury of living from past accomplishments. Each day the business starts over again. You cannot build up a list of faithful repeat customers in this business. The only things that are carried forward are experience and hopefully, lessons learned.
Trading is not for anyone who has an unquenchable thirst for certainty. Uncertainty in trading is co-equal with insecurity. If money represents security to a trader, that trader has a real problem. Most advisors will agree that trading should be done only with money that the trader can afford to lose. Sadly, not many follow that advice. Losing money not only costs the trader financial security, but emotional security as well.
I often tell people that I have mentally divorced myself from the money involved in trading. I often don’t know until the end of the month whether I have won or lost money. I trained myself to think of trading as an endeavor in which I strive to make points. Only later are those points translated to dollars. In that sense, for me trading is making point. As long as I’m making more points than I’m losing, I feel good about my trading. Of course, I keep in mind that when I’m trading in more than one market those points are not always of equal value. I also never lose sight of the fact that trading is a serious business.
Insecurity among traders who over-analyze manifests in a search for the holy grail of trading, desperately seeking the right indicator or the perfect trade setup, as on the chart below. The problem is that even when something that looks good is seen, there is no feeling of certainty that the trade is sufficiently perfect to act upon. Why? Because the real lack is confidence in the ability to trade what may be clearly seen, as well as a lack of self-confidence, and because of fear of the pain of another loss.
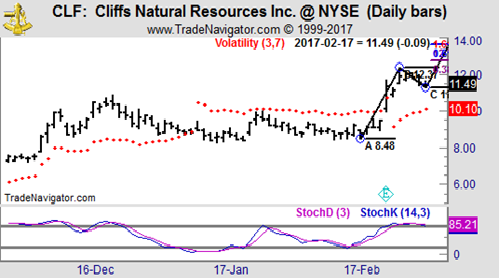
I was taught to do my analytical work at a time when markets were not day traded and were not electronic. I had to adapt to the realities of markets as they are traded today.
First, I go through all my charts to get an overview of the markets. During that time, I look for trending markets. Trend lines are sometimes placed on the charts as best I can do them. This action can help me to identify the trend. These days it is easily done with software.
Next, I go through all my charts looking for “against the grain” moves—the intermediate trend that goes against the longer term trend. This alerts me to prices that might soon resume trending.
Then I go through all my charts looking for Ross hooks. I mark each hook with a bright red “h.” This, too, is possible to do with computer software. Then, in light of the size of my margin account, I try to select those markets that appear to have the greatest potential, and I place order entry stops where I have determined I can make a suitable entry. These are resting orders in the market. I try to never miss a pre-hook entry.
How do I know which markets have the greatest potential? The answer is simple. I select those markets that have the strongest trend lines along with the most consistent daily price range—a price-range sufficient for me to take my piece out of the market.
Now there is a trick to this. I don’t want too steep a rise or fall because in a rising market too steep often signals that the end of a move is near. Prices that break out too fast and go straight up rarely give an opportunity for entry before they start to chop around in congestion. If prices have been going up steadily, and suddenly that angle steepens—goes parabolic, prices are giving a warning that the move may soon be over. In down markets I am willing to allow a steeper angle, because often a market will move down a lot faster than it moved up.
What I want most is nicely trending markets that are making a retracement. Then I can attempt an entry as the market retraces.
Sometimes I have to wait a relatively long time before prices begin trending, depending on the time frame I am trading. The only thing that changes is that the shorter the time frame the shorter the wait for prices to start trending. There will usually be at least a couple of markets in a trending condition, but there are times when there are none.
Yet I do my homework every day. The only way to know when an important breakout, the beginning of a trend, might occur is to perform my daily analytical work.
Finally, I will set my work aside and take a break. After a break, when my head has cleared a bit, I will look at my charts again. I will then do my best to come up with a trading plan. I will try to think through what I am going to do. I will ask myself lots of “what ifs.” I try to anticipate what might happen in the market. Often that kind of thinking will cause me to eliminate some of my potential trades.
© by Joe Ross. Re-transmission or reproduction of any part of this material is strictly prohibited without the prior written consent of Trading Educators, Inc.
Trading Error: Trading Your P&L
by Professional Trader Marco Mayer
Educator for Forex and Futures, Systematic Trader, and
Creator of Ambush Trading Method, Ambush Signals, and AlgoStrats.com
In this video, Marco talks about another very common trading mistake, and that's trading your P&L instead of the actual market. If you're struggling to become a winning trader, this might be an eye-opener, especially if you're a breakeven trader right now.
© by Marco Mayer. Re-transmission or reproduction of any part of this material is strictly prohibited without the prior written consent of Trading Educators, Inc.
Check out our Blog!
To view previous published Chart Scan newsletters, please log in or click on "Join Us,"
shown above, to subscribe to our free "Members Only" section.
A WEALTH OF INFORMATION & EDUCATION:
Joe Ross-Trading Educators' popular free Chart Scan Newsletter has been published since 2004.
Note: Unless otherwise noted, all charts used in Chart Scan commentary were created
by using Genesis Financial Technologies' Trade Navigator (with permission).
Legal Notice and Copyright 2017 Disclaimer - Published by Trading Educators, Inc.
Chart Scan is a complimentary educational newsletter.
© by Trading Educators, Inc. Re-transmission or reproduction of any part of this material is strictly prohibited without prior written consent.

