

Newsletters (208)
Children categories
Edition 670 - April 14, 2017


Can you ever be sure that you have an edge in trading?
by Professional Trader Marco Mayer
Educator for Forex and Futures, Systematic Trader, and
Creator of Ambush Trading Method, Ambush Signals, and AlgoStrats.com
Thank you for your feedback on my last article "Having an edge in the markets". Some of you have been brave enough to take that article to the next logical step and ask the question most traders hardly dare to ask.
Here's an email I got: "I have experienced all the things you described. The thing that I always wonder about is how do you know if you have a real trading edge? Every time I have a winning period and then move into a period of drawdown I start asking myself, "Do I really have an edge or am I now just giving everything back because I don't?". Is there a way to have an assurance that your methodology has an edge? Is it possible to have that confidence?"
Definitely, one of the hard questions when it comes to trading. And one that makes most traders feel very uncomfortable for a reason. I myself kind of blanked out each time it came to my mind for years. Why? Probably because I already knew that I wouldn't like the answer too much. And it's much easier to just move on with some magical thinking and decide to "trust in your guru" or "believe what you've read in a book".
But one day every honest trader has to face this, so let's not lose time and dive right into it.
First, let's redefine the question. I'll assume you have read the last article and if you didn't, now is a good time to do so. In the article, we discussed that a casino has an edge at the roulette table, a real edge that is indisputable and 100% real. You can explain it in a few sentences, it has been there 10 years ago and will still be there in 10 years as long as the rules of the game don't change. The house has an advantage, and the owners of the casino can be 100% confident about this.
How's the situation in trading? Are there edges equal to the house advantage of a casino? And the answer is actually yes, here are a couple of examples:
- When most trading still happened in the pits, traders who had a seat at the exchange and were trading directly from the pit had an edge. They could see the big players placing their orders, immediately see/hear/feel when the market started to move and jump on the move early. By the time the retail traders called in their orders to join the trend they could already cash in. Notice that almost all of these successful pit traders failed to make money when they were forced to trade in front of a computer screen without that locational advantage. Many of them are now trading gurus...
- Market makers who were front-running orders. These are almost gone these days in electronic trading, but HFT trading algorithms have actually taken their place. They usually have a very small speed advantage, being a bit closer to the exchanges than everyone else. And a huge part of their game is running the same strategies as the human market makers did back in the days. With smaller amounts but a lot faster and at much higher frequency.
- Arbitrage opportunities, trading the same stock but on different exchanges for example to exploit price differences. This was a really nice edge but the margins got smaller and smaller over the years as the markets became more efficient. Nowadays there still are some opportunities in markets like cryptocurrencies or developing markets in countries that are just opening up to the global world. But they're not easy to find and the profit margins usually are very small.
There's more, but the truth is that all of that kind of sure thing edges I know of are gone or too expensive to exploit for a private trader. One example of this is HFT trading where you need a serious amount of money to get a fast enough connection to the exchanges and super cheap trading costs to make this really work. Unless you have that, HFT trading is a sure way to ruin due to the trading costs you have to pay and getting beaten constantly by faster HFT trading algorithms.
Now let's move on to the kind of edges most of us are looking for on a daily basis. These aren't sure thing edges like the one the casino has. Let's call them speculative edges. One might be that during a certain time of the month's stocks tend to move higher. Or a chart pattern that increases the odds of prices to move in a certain direction. Or a trader who believes he has exceptional gut instincts about where the markets will move. It could also be a specific system/method like the well-known turtle system.
What differentiates all of these speculative edges from the ones we discussed before is that they're always uncertain. A trading method like the turtle system might work for a decade and then stop working. The reason for this might be that too many people are doing the same thing or because the markets change. The same can be said of a chart pattern. Markets, market participants and market relationships change all the time. Some markets even completely disappear. And so do market inefficiencies.
Because of that, truth is you can never be sure if what you believe to be an edge actually still is an edge.
But there are things you can do to increase the odds of an edge being valid and to make this a bit less of an issue.
First of all, don't just blindly believe and bet your money on a chart pattern/method/idea because it's on some website, a trading guru tells you about it or you find it in a magazine/book. I can honestly say that I've looked at most of what's out there in the trading world (for free and expensive/premium products). Truth is that even when you ignore the obvious bullshit it’s very hard to find any real edges in what's on offer out there.
Also just because something sounds logical and reasonable doesn't mean it will actually give you an edge. This is a very common scheme in the trading education world. We all love these little stories and explanations as for other areas of life, this actually works quite well. But not in trading.
Here's an example: "this price pattern shows you clearly that the big players in this market bought at price X, after which prices moved higher very strongly. So the bulls clearly won and the traders who are short have to cover their position once price Y is hit." Sounds logical, makes some sense, could be true right? But all of this is just an interpretation of what everyone can see on a price chart. It doesn't mean that bla-bla actually has any predictive value. The opposite could be as true!
So what to do? I suggest to always backtest and validate any trading idea. Yes, you'll still just look at the past and backtesting has its flaws but it surely puts you ahead of a trader who doesn't backtest at all. If you don't believe in backtesting, simply ask yourself if you would still trade a chart pattern if you'd know that it lost money every year for the last 10 years in the market and timeframe you plan to trade it. I wouldn't and that's why I want to know at least that much before betting my money on an idea.
Backtesting the right way is not easy. You need to learn how to do it as well as possible, knowing it's limitations and flaws. Do your best to avoid over optimizing, make sure your backtest is statistically sound and you have enough trade samples (no, 30 is not enough). Evaluate trading costs correctly and use high-quality historical data. Depending on the strategy, use out of sample validation, walk-forward optimization, cross validations and monte carlo simulations.
If you're doing proper backtesting, you'll be way ahead of all the traders out there who just blindly trade some signal. You'll know a lot more about the possibly good signals and you'll have filtered out tons of strategies that you now know for sure have no edge whatsoever.
Even now though you'll still not know for sure if your strategy really has an edge or not. You've done all you can to strongly improve the odds but it still is a speculative edge and should be treated as such.
That’s why I see trading systems as investments. After having done my research, I might decide to invest in a trading system. And like investing in stocks, I'll diversify as good as possible by investing in multiple systems. This way if some of my systems are actually just "data accidents" that somehow still made it through my strict system development process, it's not going to be a disaster as long as the other systems perform as expected.
I believe that's as close as you can come to a sure thing edge as a speculative trader. Of course, that's not what traders want to hear but it's always much better to know and be aware of what’s true rather than to ignore it.
Happy Trading!
Marco
PS: If you know of any sure thing trading edges out there, please email me, This email address is being protected from spambots. You need JavaScript enabled to view it.!
© by Marco Mayer. Re-transmission or reproduction of any part of this material is strictly prohibited without the prior written consent of Trading Educators, Inc.

When it comes to trading...more-less-confused.
by Professional Trader Andy Jordan
Educator for Spreads, Options, Swing/Day Trading, and
Editor of Traders Notebook Complete and Traders Notebook Outrights
When it comes to trading it seems that the more you know, the less you know, and the more you become confused.
People have the tendency to believe that the accuracy of their forecasts increases with more information. This is the illusion of knowledge - that more information increases your knowledge about something and improves your decisions. However, this is not always the case - increased levels of information do not necessarily lead to greater knowledge. There are three reasons for this. First, some information does not help us make predictions and can even mislead us. Second, many people may not have the training, experience, or skills to interpret the information. And, finally, people tend to interpret new information as confirmation of their prior beliefs.
© by Andy Jordan. Re-transmission or reproduction of any part of this material is strictly prohibited without the prior written consent of Trading Educators, Inc.

Chart Scan with Commentary - Why don’t more people know about spreads?
by Master Trader Joe Ross
Author, Trader, Trading Mentor, and Founder of Trading Educators, Inc.
Could it be that those who are in the know don’t want YOU to know?
Spreads are kind of a strange thing to be writing about in a trading newsletter the goes out mostly to traders who are probably trading everything and anything except spreads. You see, trading spreads on futures contracts is mostly for people "in the know," but there are few who know much about spread trading.
Since spreads can be traded strictly using spread orders shortly after the Open or during the Close, it really doesn’t matter where you live on this planet should you care to take advantage of spread trading. But why would you want to do that? I suppose I’d better answer my own question: It’s because of the many, many advantages spread trading has over every other kind of trading I’ve seen in my decades of trading experience.
It’s truly amazing that people don’t know much about spread trading, and please don’t confuse it with "spread betting", they are not at all the same thing. What’s startling about it is that there is more refined information about trade selection when it comes to spreads than you can find in any other trading venue. With so much great information available about which spreads to enter, you have to wonder why so few people know about spreads.
A spread is the arithmetic difference between the prices of two outright contracts. You simply subtract the one you want to sell short from the one you want to buy long. Technically, you can spread any two contracts you care to, but normally a spread is done between two futures contracts that are in some way related to one another. The reason for using futures to do spreads is that the US exchanges offer substantially reduced margins for trading them.
Trading futures spreads brings you a whole new trading experience. Is there anyone out there who would not want to trade free of any costs for data? It is possible when trading spreads.
Can you imagine situations where even though prices in the underlying are moving sideways, you will be trading a chart that is trending? For the most part, isn’t it the trend where you make the most money? The fact is that spreads trend more steeply, more often, and for longer periods of time than the trends in the outrights. You see when a spread trends, it trends based on reality and not on market manipulation by those able to move prices.
As an example of how long spreads can trend, let’s look at a weekly chart of being long the Japanese yen futures contract for March, 2009 spread against being short an Australian dollar contract for March, 2009. These currencies are traded in Chicago at the CME Exchange. Of course, prior to the March, 2009 contract, you would have been in the December, 2008 contract, and before that in the September, 2008 contract. The uptrend began in August, 2008 and at the time I wrote this it was still going. The scale on the right shows actual dollars earned by the spread. It moved from approximately US$25,000 to US$75,000 (US$50,000+) profits at the time of this writing.
Prior to that uptrend, it would have been best to have been long the Australian dollar and short the Japanese yen (that trade lasted from some time prior to June 2004 until July of 2007, a period of more than 3 years.
Here’s another advantage of trading spreads: Market manipulation has no effect on spreads. Neither does stop running. Whether it be shares, forex, futures, or options, stop running is the major enemy of most traders in the outright futures of any market you care to trade!
You read that right, spreads are immune to stop running. In fact, there are no stop orders in spread trading. There are only entry and exit points. When you trade spreads you become invisible to the market manipulators.
I want to tell you about some of the many additional benefits of spread trading but first we need to identify the various kinds of spreads, because they go from very low risk to somewhat riskier. Reduced margins are available among the following:
- Intramarket Spreads
- Intermarket Spreads
- Inter-exchange Spreads
Intramarket spread are generally the least risky. They involve two contracts having different months, but of the same underlying. June Crude Oil – August Crude Oil would be such a spread. A slightly more risky intramarket spread would be an old-crop year – new-crop year Soybean spread, i.e., October 2006 Soybeans – March 2007 Soybeans. The Soybean crop year runs from November of one year to September of the following year.
Increasing just slightly in risk would be an Intermarket spread between Chicago Wheat and Kansas City Wheat. Note that this is also an Inter-exchange spread, as the two are traded on different exchanges. But the one variety of wheat is in a sense closely related to the other variety of wheat, and so margins to trade the spread, which in turn reflect risk, are extremely low.
While all reduced margin spreads carry lower risk than the risk for any outright futures contract, I need to tell you about the spreads that carry the most risk. These would be some spreads in the currencies. Even though they are Intermarket spreads, currencies are not necessarily sufficiently related to offer extremely low risk. The risk on some currency spreads comes close to that of the outrights. Yet for others, which are related by virtue of seasonal economic factors, the risk is considerably less. For example, the Canadian dollar – Australian dollar spread does not see excessive adverse movements. These two nations are both what some traders call "commodity countries". The spreads between their currencies is seasonally related. When it is summer in Canada, it is winter in Australia and vice-versa. Trade between the two nations is also a factor in the spread. Swiss franc – euro spreads are also good, as the two are closely related. The Swiss, because their major trading partners are the other Europeans, cannot afford to allow their currency to become too expensive.
Risk, in spreads is a product of how closely related are the two legs of the spread.
Low margins are one of the greatest advantages of trading spreads, which in turn means you are getting more efficient use of your trading capital.
Margins on spreads carry as much as a 95% reduction as compared with margins for trading the outright futures. There are only a handful of spreads that have reductions in margin that are less than 50% of those for trading in the outrights.
When it comes to planning, spreads have no equal. Are you aware that you can plan spread trades days, weeks, and months in advance? You will know when they should be entered, and what the chart should look like when it is time to enter.
You can trade spreads without ever having to use an indicator, point and figure, or candlesticks. A simple line chart is all you’ll ever need and to make things even easier, if the spread line isn’t rising you are not making any money. You never trade a spread if the line on the chart isn’t going up.
In the area of trade selection, you will find that you never have to enter a spread trade with less than 80% probability of winning based on how the spread traded seasonally in the past. In fact, there are spreads that have been winners in 15 out of the last 15 years. You can also trade spreads that offer an 80% or greater chance of winning based on regression analysis.
I wish I were able to tell you the many other benefits of spread trading, but I cannot because of space limitations. I must use the words I have left to explain the chart and recap some of what I’ve written.
As concerns the chart, (March 2009 yen) minus (March 2009 Australian dollars) the spread must be adjusted for the difference in point value of the two currencies. Yen move $12.50/tick, or $1250 dollar/point, while Australian dollars move $10/tick, or $1000/point. What I want you to notice is that I multiplied each leg of the spread by its point value.
Using the multipliers of 1250 and 1000 allows me to see the spread in terms of US dollars. Currency spreads can be very profitable and I have traded them frequently. Currency futures are highly liquid as well.
In the early 1970s, there were only a few markets available for trading. They were all commodities; There was no such thing as financial futures, or stock index futures. There was one year in particular when all 8 markets that were available for trading were flat. In those days almost everyone was a trend trader. But there were no trends. Most traders found themselves churning their own accounts because there was no way to get on the right side of the market. Many of those who survived did so because, even though the markets were flat, the spreads between the various months or related commodities were trending.
I encourage you to at least look into futures spread trading. You can do them no matter where you live and work. In times of flat markets especially, or wildly swinging markets, spread trading can be a mainstay of your trading career.
© by Joe Ross. Re-transmission or reproduction of any part of this material is strictly prohibited without the prior written consent of Trading Educators, Inc.
Instant Income Guaranteed - X Trade
Developer: Joe Ross
Administration and New Developments: Philippe Gautier
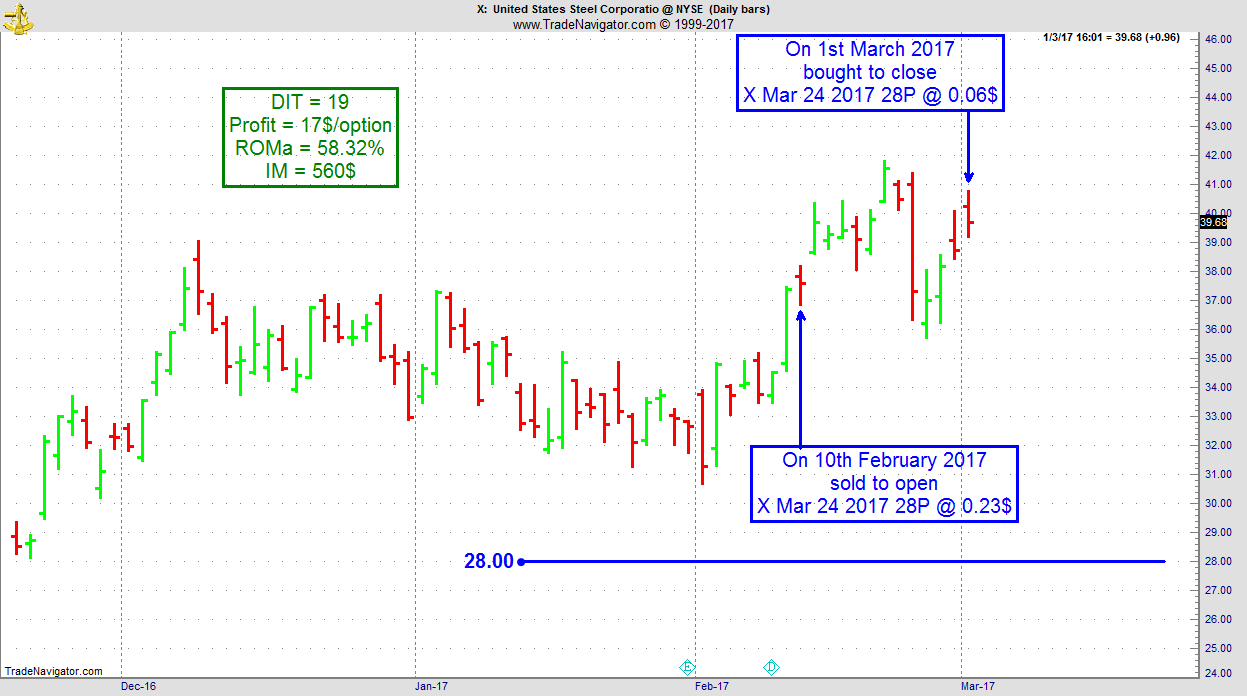
On 9th February 2017 we gave our IIG subscribers the following trade on X (US Steel). We decided to sell price insurance as follows:
- On 10th February 2017, we sold to open X Mar 24 2017 28P @ $0.23, i.e. $23 per option sold, with 44 days to expiration, and our short strike below a major support zone and 25% below price action.
- On 1st March 2017, we bought to close X Mar 24 2017 28P @ $0.06, after 19 days in the trade, for quick premium compounding
Profit: $17 per option
Margin: $560
Return on Margin Annualized: 58.32%
This trade was pretty safe in spite of overall very low implied volatility levels.
We have also added new types of trades for our IIG daily guidance since 2016, "no loss" propositions with unlimited upside potential, still using other people's money to trade.
Philippe
Receive daily trade recommendations - we do the research for you!
Instant Income Guaranteed
♦ SIGN UP TODAY! THIS IS WORTH THE INVESTMENT ♦
© by Joe Ross. Re-transmission or reproduction of any part of this material is strictly prohibited without the prior written consent of Trading Educators, Inc.
Check out our Blog!
To view previous published Chart Scan newsletters, please log in or click on "Join Us,"
shown above, to subscribe to our free "Members Only" section.
A WEALTH OF INFORMATION & EDUCATION:
Joe Ross-Trading Educators' popular free Chart Scan Newsletter has been published since 2004.
Note: Unless otherwise noted, all charts used in Chart Scan commentary were created
by using Genesis Financial Technologies' Trade Navigator (with permission).
Legal Notice and Copyright 2017 Disclaimer - Published by Trading Educators, Inc.
Chart Scan is a complimentary educational newsletter.
© by Trading Educators, Inc. Re-transmission or reproduction of any part of this material is strictly prohibited without prior written consent.
Edition 669 - April 7, 2017

Ambush Signals
by Professional Trader Marco Mayer
Educator for Forex and Futures, Systematic Trader, and
Creator of Ambush Trading Method, Ambush Signals, and AlgoStrats.com
Learn all you need to know about our new Ambush Signals service during this presentation by Marco Mayer. What is the Ambush System, what's the idea behind it and how does Ambush Signals make trading Ambush so much easier!
Happy Trading!
Marco
© by Marco Mayer. Re-transmission or reproduction of any part of this material is strictly prohibited without the prior written consent of Trading Educators, Inc.
Trading Idea in Soybean Oil
by Professional Trader Andy Jordan
Educator for Spreads, Options, Swing/Day Trading, and
Editor of Traders Notebook Complete and Traders Notebook Outrights
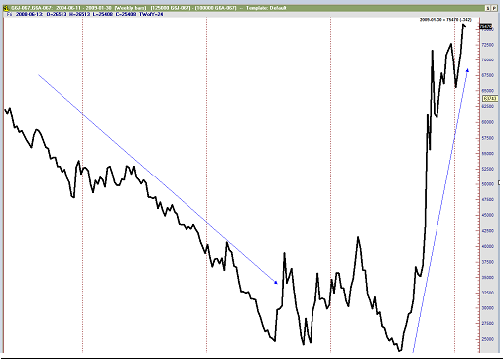
Today, I want to have a closer look at the Soybean Oil chart. As you can see from the chart below, Soybean Oil has been moving lower for several months and is coming close to the level around 30. This level is interesting to me because ZL bounced off of this level a few times in the past. Will it do the same this time? I have no idea, but we will see.
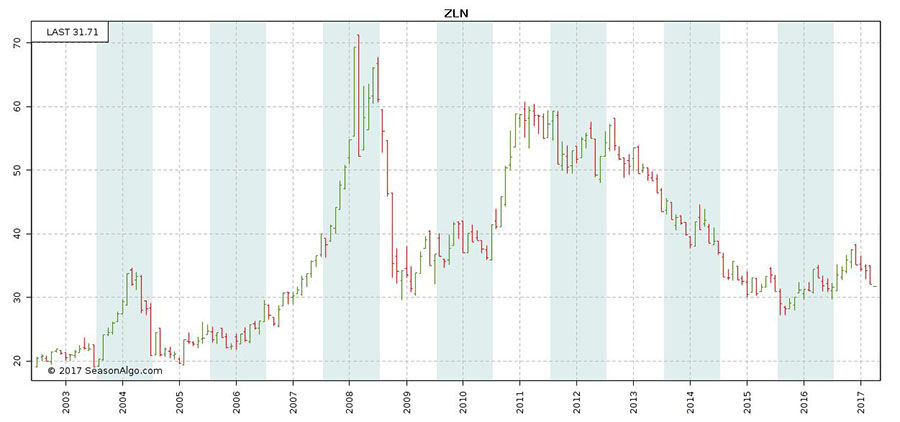
In addition, the commercials have turned to net long the first time for a long, long time. The last time commercials were net long was in June 2014.
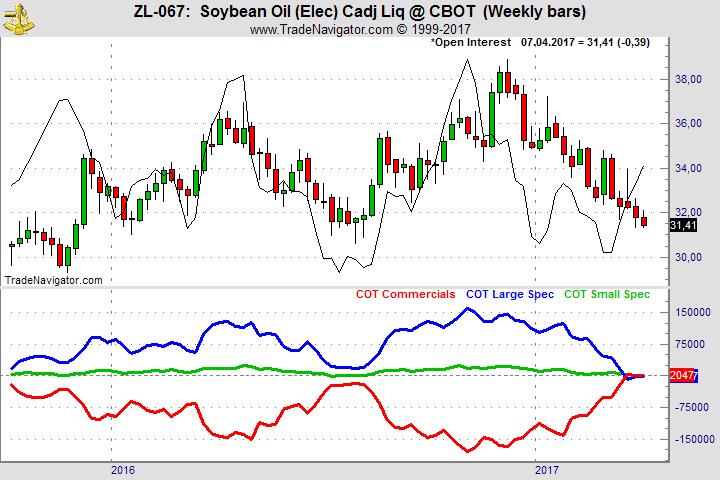
Both, the long term chart and the COT chart, together with good Implied Volatility put Soybean Oil on my watch-list. I am now waiting to see what happens around 30 or 31 before I jump in to sell puts probably using the July contracts.
Learn from us by receiving daily detailed trading instructions on how to manage this trade and others! Click the below link for more information:
Traders Notebook Complete
© by Andy Jordan. Re-transmission or reproduction of any part of this material is strictly prohibited without the prior written consent of Trading Educators, Inc.
Latest Blog: Unlike many games and sports, trading has an additional factor: the market!
by Professional Trader Andy Jordan
Educator for Spreads, Options, Swing/Day Trading, and
Editor of Traders Notebook Complete and Traders Notebook Outrights
Trading is more than just "a game". Read more.
© by Andy Jordan. Re-transmission or reproduction of any part of this material is strictly prohibited without the prior written consent of Trading Educators, Inc.
Chart Scan with Commentary - Trading options and futures combinations
by Master Trader Joe Ross
Author, Trader, Trading Mentor, and Founder of Trading Educators, Inc.
Option traders trade options, futures traders trade futures, "and never the twain shall meet." But why is it that way? Why are people who are trading options and futures combinations so rare?
Years ago, I set out to discover why we don’t see people trading both options and futures in order to get the best features of each. What I discovered is that option traders were scared of the underlying futures, and futures traders were afraid of the complexities of trading options. The result was that I couldn’t find a single person who was trading options and futures simultaneously.
What I have trouble understanding to this day is why traders don’t see that combining trading options and futures makes the trading of both much easier, and gives them the best of both worlds. What do I mean by that?
Let me give you an example that will show you why trading options and futures within a single strategy is a whole lot easier than trying to do the job using either options or futures separately.
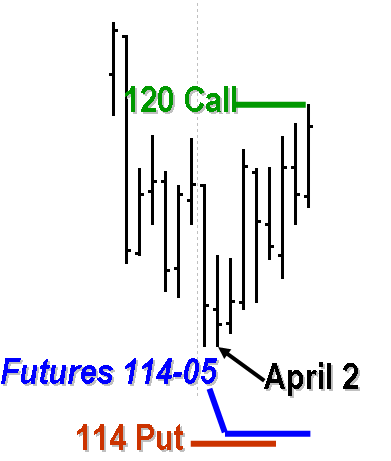
Let’s say you want to create what is known in option trading as an "Option Box."
To create an Option Box, you must first create a synthetic long or short position. In this example let’s say you think prices will rise, so you want to be artificially long. You buy a call three strike prices distant from the current price of the futures, and you sell a put two strike prices distant from the current price of the futures. You do this only if you can achieve a satisfactory credit in your account for doing so.
Since we are talking here about trading options and futures, at the time we complete both transactions, we are synthetically long futures. (This same thing can be done with stock shares, CFDs, or Forex pairs.) Being synthetically long, we are now vulnerable. In the event that futures prices fall, we would be in trouble.
How would a straight options trader protect from the possibility of prices falling? Typically, the trader would buy an option at a strike price more distant than the one he just sold.
However, doing that would probably create two problems:
- Buying the more distant strike price for protection could or probably would eat up all or most of the premium credit earned by entering the position to begin with.
- The more distant strike price might involve more risk than could be had by protecting another way.
What is another way? The trader trading options and futures could simply place an open-order, good-till-canceled sell stop in the futures, anywhere in front of or behind the strike price of the option sold, thereby more closely tailoring the amount of risk he is willing to take. There are even more benefits to this strategy:
- The open order short futures has zero costs associated with it. It is a free hedge against the possibility of falling prices.
- There is no margin requirement for the short futures unless it is filled.
- There are no commissions to be paid until the short futures is filled.
- There are no Deltas to worry about because the futures position is always at full Delta and cannot decline from full Delta.
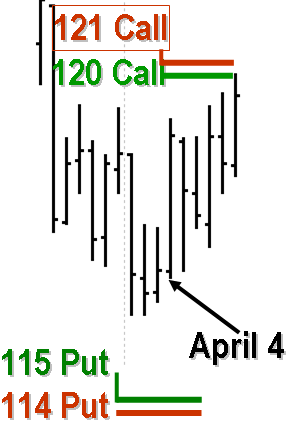
When trading options and futures with the objective being to create an Option Box, the trader now needs to close the box as quickly as possible. To accomplish that, he creates another synthetic futures position. This time he needs to sell a call and buy a put to become synthetically short futures. The trader needs to sell a call further distant from the call he bought, and buy a put closer in than the put he sold. And just as with the initial position, he should attempt, if possible, to accomplish the transaction with an additional credit to his account.
With the box closed, it is impossible to lose. By trading options and futures, the trader has opposing synthetic long and short futures, which now constitute a bear spread and a bull spread.
This strategy in combined trading has even further benefits:
- The closed position carries a guaranteed win. The trader owns the inside of the box and is short the outside — he has a covered call and a covered put. The original open-order short futures position is no longer needed and can be discarded.
- It eliminates the cost of having to buy one additional option that presumably would expire worthless or be sold for salvage value.
- The second synthetic futures position can be put on with a debit as long as it does not use up all of the credit originally earned from the combination of trading options and futures.
- An option model is not needed to trade this strategy (although a model could be helpful in extracting the most credit).
- As long as prices remain inside the box created by short options, the trade will expire and the trader gets to keep the premium earned.
- If prices break out of the box, in addition to the premium earned, the trader will enjoy a capital gain equal to the money earned between his long call and the more distant short call.
In trading options and futures combinations, an option box begins like this: Short a 114 Put, long a 120 Call, protected by an open-order sell stop in the futures.
In trading this combination, an option box ends like this: Short a Call, long a Call; long a Put, short a put.
This is just one example of the innovative way traders can trade using combinations of options and futures. There are many more examples and explanations included in the book I wrote entitled Trading Optures and Futions, which is, of course, about various combinations of trading options and futures.
Follow the above link to find out how you can learn more about trading options and futures to realize the best of both worlds.
© by Joe Ross. Re-transmission or reproduction of any part of this material is strictly prohibited without the prior written consent of Trading Educators, Inc.
Trading Article - Trading Discipline
by Master Trader Joe Ross
Author, Trader, Trading Mentor, and Founder of Trading Educators, Inc.
Trading discipline exists in two distinct parts:
-
Before your order is filled.
-
After your order is filled.
Let’s look at each of these categories, because both are tremendously important.
Trading Discipline Before Your Order Is Filled:
Here we are talking about all the things you do as a trader that require the consistency that comes from having good habits of preparation. Let’s look at good habits in terms of a series of questions:
- Do you research your trades?
- Do you study the markets?
- Do you regularly engage in chart analysis, technical analysis, fundamental analysis - even all three?
- Have you studied every kind of order available to you? Have you built strategies around the types of available orders, and have you come up with tactics -- ways to implement those strategies?
- Have you thoroughly mastered your trading software and the platform from which you trade?
All of these are part of trading discipline, and still there’s more:
- Have you practiced paper trading or trading on a simulator before launching a new strategy? This is especially necessary if you have never before traded.
- Do you have plans for what you will do if your computer goes down in the middle of a trade? What will you do if your data feed stops working? What will you do if you inadvertently place a wrong order — or your statement shows an order you didn’t place, or doesn’t show an order you did place?
Taking care of the seemingly little things are all part of trading discipline, and I’m sure I haven’t covered everything. My purpose is to get you thinking!
Trading Discipline After Your Order Is Filled (Also called Self-Control).
There is a saying in martial arts that goes something like this: "If you are suddenly and unexpectedly attacked, you have two seconds in which to make a rational response." This response must come automatically, as part and parcel of who you are, and the response is gained through disciplined practice and repetition. Another way of describing this kind of trading discipline is to call it self-control.
All the discipline practiced before your order has been filled, including the trading discipline derived from practice and repetition, finally comes into play as self-control in a battle situation. The moment you are filled you are in battle, and if you are not fully prepared you will begin to behave emotionally. Without the discipline gained through practiced repetition resulting in self-control, you will begin to act irrationally, emotionally. Fear, greed, pride, guilt, and other emotions will come into play, causing you to fail to carry out your strategy or to implement the tactics you need for fulfillment of your trading plan.
How Do You Gain Discipline and Self-Control?
Many, many years ago, I was in the same situation in which many of you find yourself today. You are asking yourself, "How can I acquire the discipline and self-control I need to become a successful trader?
When I asked myself the very same question, I eventually discovered the solution. I began to chart my life. After all, chart reading was a huge part of my trading life. Chart reading was what I did every day. My entire world concept revolved around reading charts. Charts were one of the main ways through which I perceived the world around me.
There was another aspect to trading discipline that intrigued me. I had always heard that if I wanted to be a winning trader, I had to keep my losses small and let my winners run. Wow! Great idea, isn’t it? But no one ever showed me how to do it!
I was now confronted by two mountains. The first was how to chart my life, and the other was how to keep my losses small and let my winners run.
The answer to both seemed to come at the same time. By charting my equity, it became crystal clear to me as to how to keep my losses small and let my winners run.
Charting my life was somewhat more difficult. I had to think hard about which factors of my life most affected my trading. I had a trading life, but how was I to break it down into chartable pieces? And what about my emotional life, how did that affect my trading? And there were still other life categories that affected my trading: my relational life was one; my financial life was another; and my spiritual life was yet another.
Eventually I came up with two tools: one I called the "Life Index;" the other I called the "Equity Evaluator." I laboriously maintained these tools manually until the computer age. Both of these tools have now been digitized, which makes it extremely easy to enter the data and quickly see the patterns of results. Now both tools are available to assist you with your trading discipline: learn more about the "Life Index for Traders” and the “Equity Evaluator."
© by Joe Ross. Re-transmission or reproduction of any part of this material is strictly prohibited without the prior written consent of Trading Educators, Inc.
Instant Income Guaranteed - SLW Trade
Developer: Joe Ross
Administration and New Developments: Philippe Gautier
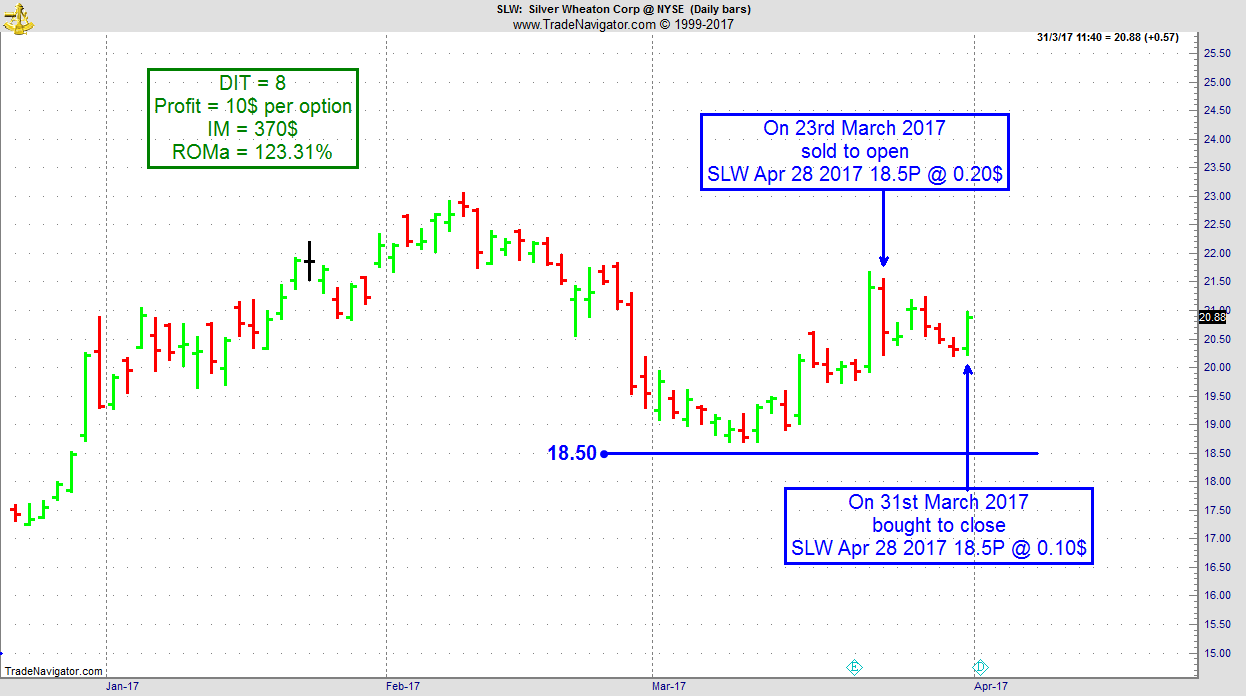
On 22nd March 2017, we gave our IIG subscribers the following trade on SLW, right after earnings. We decided to sell price insurance as follows:
- On 23rd March 2017, we sold to open SLW Apr 28 2017 18.5P @ $0.20, i.e. $20 per option sold, with 35 days to expiration, and our short strike below a major support zone, about 14% below price action.
- On 31st March 2017, we bought to close SLW Apr 28 2017 18.5P @ $0.10, after 8 days in the trade, for quick premium compounding.
Profit: $10 per option
Margin: $370
Return on Margin Annualized: 123.31%
This trade was pretty safe in spite of overall very low implied volatility levels.
We have also added new types of trades for our IIG daily guidance since 2016, "no loss" propositions with unlimited upside potential, still using other people's money to trade.
Philippe
Receive daily trade recommendations - we do the research for you!
Instant Income Guaranteed
♦ SIGN UP TODAY! THIS IS WORTH THE INVESTMENT ♦
© by Joe Ross. Re-transmission or reproduction of any part of this material is strictly prohibited without the prior written consent of Trading Educators, Inc.
Check out our Blog!
To view previous published Chart Scan newsletters, please log in or click on "Join Us,"
shown above, to subscribe to our free "Members Only" section.
A WEALTH OF INFORMATION & EDUCATION:
Joe Ross-Trading Educators' popular free Chart Scan Newsletter has been published since 2004.
Note: Unless otherwise noted, all charts used in Chart Scan commentary were created
by using Genesis Financial Technologies' Trade Navigator (with permission).
Legal Notice and Copyright 2017 Disclaimer - Published by Trading Educators, Inc.
Chart Scan is a complimentary educational newsletter.
© by Trading Educators, Inc. Re-transmission or reproduction of any part of this material is strictly prohibited without prior written consent.
Edition 668 - March 31, 2017

Trading Article - Having an edge in the markets
by Professional Trader Marco Mayer
Educator for Forex and Futures, Systematic Trader, and
Creator of Ambush Trading Method, Ambush Signals, and AlgoStrats.com
One of the most important concepts to understand in trading is what it actually means to have an Edge in the markets.
First of all, when we talk about an edge in trading, we mean a statistical edge. A good example of a statistical edge is the casino. If you play Roulette, the casino will have an edge, the "house advantage". This will make sure that the casino is going to make money in the long run. Everyone who plays there has a disadvantage but it doesn't mean you cannot win there once in a while. You might have luck sometimes, but that casino edge will always make sure the house makes money, and you lose it in the long run, due to the law of large numbers.
That same law of large numbers is of course also at work in trading which is why it's so important to understand this concept.
If you're trading without an edge (with a random entry for example), you'd expect to have about 50% winning and 50% losing trades in the long run. Which is exactly what's going to happen if you trade often enough to allow the law of large numbers to do its job.
The same way as you can be lucky in the casino, you can also be lucky in trading and you might actually make money in the short-term. You believe you have an edge, you start trading and you actually make money. You're up nicely after 6 months of trading and you think you finally got it. But then you give it all back again and you're exactly where you started wondering if your edge has stopped working. But the truth is you might never have had one in the first place, you might just have been lucky!
This happened multiple times during the first years of my trading career. I was trying to apply whatever method I just believed in (some chart/price action pattern for example), and after looking at a few samples on a price chart, I started trading it without having thoroughly backtested the method. This way I either made money once I started trading it, which of course reinforced my belief in the method and then lost it later on. Or I lost money right away and stopped trading the method shortly after. Which might have been a mistake, as I maybe didn't give the law of large numbers enough time to make money with the edge. In any case, shortly after I started looking for the next holy grail, and unfortunately, there's no lack of utterly useless trading methods on the internet/books/seminars and gurus who were willing to sell it to me.
In trading, there's no house advantage you have to overcome (unless you're trading against your broker), but there are trading costs, which means you actually start out with a disadvantage. The higher your trading costs, the larger this disadvantage will be. So you will lose money in the long run if you trade without an edge as you always will have to pay these trading costs. Truth is, to break even in trading, you already do need an edge to overcome trading costs.
The key point to take away from this is to understand that if you actually do have an edge in the markets, it's just that. You're now the casino, you have the advantage. You have the law of large numbers on your side. In the long run, you will win.
Does this mean you'll be able to predict the outcome of the very next trade you'll take? Will you know it's going to be a winner? No, the same way the casino doesn't know if it will make money in the very next round. Does it guarantee you that you'll make money within the next 10 trades? No, the same way the casino doesn't know it will make money on this table tonight. Could it happen that you get 5 losing trades in a row? Absolutely, the same way someone might double his money 5 times in a row playing roulette in your house.
If you manage to really understand and acknowledge this, your trading will become a lot easier. You'll stop trying to predict what a market will do, knowing that it's simply impossible to know and that the outcome of a single trade is a random event. This way you'll pay much less attention to individual trades and be more focused on the long run.
And that's the only way to succeed in this business. Have an edge, focus on the long run and ignore the noise in between. I hope this article helps you to do just that.
Happy Trading!
Marco
© by Marco Mayer. Re-transmission or reproduction of any part of this material is strictly prohibited without the prior written consent of Trading Educators, Inc.
Latest Blog - Anticipation Regarding Losses
by Professional Trader Andy Jordan
Educator for Spreads, Options, Swing/Day Trading, and
Editor of Traders Notebook Complete and Traders Notebook Outrights
Most traders don't want to hear the REAL truth about trading, but we know you do...read more.
© by Andy Jordan. Re-transmission or reproduction of any part of this material is strictly prohibited without the prior written consent of Trading Educators, Inc.
Chart Scan with Commentary - The Traders Trick Entry
by Master Trader Joe Ross
Author, Trader, Trading Mentor, and Founder of Trading Educators, Inc.
Of all the setups available, the Traders Trick Entry is the only one that gets better with more people using it. That may sound strange, but it is true.
Most setups are effective only when limited to a few traders, but the Traders Trick Entry is quite different. The reason is the Traders Trick is designed to take advantage of the momentum of others—the more “others” the more effective the trick becomes.
The Traders Trick Entry has now been in use for over 30 years, and with use, it gets better and better. It is a setup that is so consistent, that many professional traders use it exclusively for their trade entries. The Traders Trick Entry (TTE) takes advantage of retracement turnarounds, and pre-breakout momentum.
TTE works in all markets and in all time frames. The primary consideration for the TTE to work is that there be enough room between the point of entry and the targeted breakout point to be able to earn a profit.
Through 20 years of global experience, by thousands of traders, TTE has been refined to a point that it possible to earn a living using only that single setup.
The Traders Trick Entry is not a mechanical system—in fact it is not even a discretionary method. It is a setup, pure and simple. As a setup, it is one way to implement two of the three primary formations of the Law of Charts. Those formations are 1-2-3 highs and lows, and Ross Hooks.
One of our associates here at Trading Educators, uses the TTE exclusively for trading stock options. A gentleman in South Africa uses it to trade futures on point and figure charts. We have a student who uses TTE exclusively to trade the financial markets. TTE is used by many to trade Forex. Another of our associates uses it to trade spreads on futures.
TTE can be, and is used, by traders who prefer candlestick charts, point and figure charts, range charts, tick charts and regular bar charts. It is completely independent of market or time frame because of the fact that it is the implementation of a physical law.
Just as the physical laws underlying the fact of electricity can be used to generate heat, light, and turn a motor, the physical laws underlying the Law of Charts can be used to produce profits.

The chart above is a weekly chart. It could be the weekly of anything that is chartable. The only way you know that this is a weekly chart is because I told you it is, and I have left off the identifying information on the chart.
Prices have dropped to a low noted by the number 1 point on the chart. From there prices rose to point number 2 and subsequently retraced to point number 3. The Traders Trick Entry Calls for a trade to be entered one tick, pip, bip, or X cents above the high of the bar labeled 3.
Of course, there is more to it than the simple explanation above. There are refinements that can be used to make the trick extremely effective. It is also important to know the market dynamics behind the trick, so that you have a complete understanding of how and why it works.
The free eBook you received when signing up igningAt our website, we have an elementary explanation of the Traders Trick Entry. For a more complete explanation, and to see it in action you can purchase our webinar "Traders Trick Advanced Concepts," or sign up for private one-on-one tutoring with Joe Ross. You can trade for a living with the simple setup Traders Trick Entry. Traders all over the world are using it. Don’t be left out.
© by Joe Ross. Re-transmission or reproduction of any part of this material is strictly prohibited without the prior written consent of Trading Educators, Inc.
Trading Article - Maintaining Discipline: When Past Choices Influence Future Decisions
by Master Trader Joe Ross
Author, Trader, Trading Mentor, and Founder of Trading Educators, Inc.
Traders and investors have difficulty "letting their profits run." When you see your investment increase in value, it's hard to avoid selling early to lock in profits. But not every trade goes your way, so when you come upon a trade that does produce a profit, it's vital for your long-term success to optimize the profits for that particular trade. You must make more profits on your winning trades than you lose on your losing trades, but this is difficult to do if you consistently sell prematurely. Waiting for your price objective takes self-control. You must fight the urge to sell early. A thinking strategy that may help you increase your ability to maintain self-control when you need to suggest viewing economic decisions as "linked" in that the decisions you make on earlier economic choices influence the decisions you make on later economic choices.
How do you approach discipline when you trade? Do you think, "I'll sell early on this trade, but on future trades, I'll let my profits run." Is there harm in thinking that way? It may set a bad precedent. What you do early on may influence what you do later: If you sell early on some trades, you may tend to sell early on other trades. In an experiment with a simple thinking strategy, participants were told to think of a series of decisions as linked together. They were told that initial choices were good predictors of future choices. The choices they made concerned deciding on a smaller reward up front, or waiting for a larger reward later. For example, a participant might decide between one piece of pizza now and two pieces of pizza in a week. It's quite similar to taking a smaller profit early rather than patiently waiting to take a larger profit later. Some participants were asked to consider the advantage of putting off taking a smaller reward up front.
Results of the study showed that this simple thinking strategy worked. When people were reminded of the recurring nature of choices, and that they should show self-control early on, they were able to actually show more discipline and self-control when asked to make later economic decisions. These findings suggest that if you want to trade with discipline, it is essential that you maintain discipline at all times. Don't sell early, and think, "I'll hold on next time." The mind doesn't seem to work that way. You must show self-control early and on all decisions. So when you are about to sell early, stop! Remind yourself that the long term consequence of taking profits prematurely is that it will set a bad precedent. You won't be able to show self-control and restraint when you really need to. And in the long run, it will severely cut into your overall profits.
However, there is another way to handle trades—one that can give you the best of both worlds. The way we do it at Trading Educators is to take a small but quick profit as soon as possible, move to breakeven, and then allow the market to take you as far as it is willing.
© by Joe Ross. Re-transmission or reproduction of any part of this material is strictly prohibited without the prior written consent of Trading Educators, Inc.
Instant Income Guaranteed - X Trade
Developer: Joe Ross
Administration and New Developments: Philippe Gautier
On 9th June 2016, we gave our subscribers a new type of trade on US Steel (X), which was showing accumulation on a pullback on the weekly chart.
We entered a "complex position", entered for a net credit (still working with OPM, i.e. other people's money, as usual), but with unlimited upside potential.
- On 10th June 2016, we entered the trade for a credit of $1.70 (or $170 per position).
- On 9th November 2016, we took partial profits on our long position.
- On 7th December 2016, we took new partial profits on our long position and closed our short position.
- On 13th March 2017, we took our profit on our last long position on a weekly trailing stop.
DIT = 277 days
Profit: $906.70 per unit
Average short strike = $15.68
Margin: $314
Return on Margin annualized: 380.96%
These are low maintenance, low stress trades with lots of upside potential. Our total profit was about 3 times our average margin requirement on this trade.
We presently have 22 of these trades opened, some of them with no margin requirements left.
Philippe

Receive daily trade recommendations - we do the research for you!
Instant Income Guaranteed
♦ SIGN UP TODAY! THIS IS WORTH THE INVESTMENT ♦
© by Joe Ross. Re-transmission or reproduction of any part of this material is strictly prohibited without the prior written consent of Trading Educators, Inc.
Check out our Blog!
To view previous published Chart Scan newsletters, please log in or click on "Join Us,"
shown above, to subscribe to our free "Members Only" section.
A WEALTH OF INFORMATION & EDUCATION:
Joe Ross-Trading Educators' popular free Chart Scan Newsletter has been published since 2004.
Note: Unless otherwise noted, all charts used in Chart Scan commentary were created
by using Genesis Financial Technologies' Trade Navigator (with permission).
Legal Notice and Copyright 2017 Disclaimer - Published by Trading Educators, Inc.
Chart Scan is a complimentary educational newsletter.
© by Trading Educators, Inc. Re-transmission or reproduction of any part of this material is strictly prohibited without prior written consent.
Edition 667 - March 24, 2017
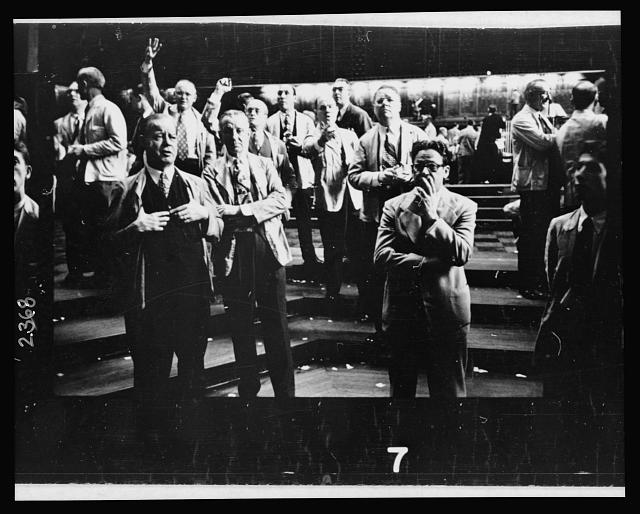
Men working the floor at the Chicago Board of Trade. Photograped by Stanley Kubrick for Look Magazine in 1949.
Image is in Public Domain and available through Library of Congress
Latest Blog - How to Approach Trading - Part 7
by Professional Trader Andy Jordan
Educator for Spreads, Options, Swing/Day Trading, and
Editor of Traders Notebook Complete and Traders Notebook Outrights
It is critical to develop a well thought out and organized trading plan. It is then important to have...read more.
Begin reading from Andy's first blog in his series!
© by Andy Jordan. Re-transmission or reproduction of any part of this material is strictly prohibited without the prior written consent of Trading Educators, Inc.
Ambush Signals
by Professional Trader Marco Mayer
Educator for Forex and Futures, Systematic Trader, and
Creator of Ambush Trading Method, Ambush Signals, and AlgoStrats.com
Learn all you need to know about our Ambush Signals service during this presentation by Marco Mayer. What is the Ambush System? What's the idea behind it? Ambush Signals trades in a variety of markets:
- Futures: Stock Index, Commodity, Currency, and Interest Rates
- Spot Forex Markets
- ETFs
- CFDs on any of the supported markets (results may vary, depending on your broker's quotes)
Time-Proven System
Easy to Follow
Stress Free Day Trading
© by Marco Mayer. Re-transmission or reproduction of any part of this material is strictly prohibited without the prior written consent of Trading Educators, Inc.
Chart Scan with Commentary - Can you have it both ways?
by Master Trader Joe Ross
Author, Trader, Trading Mentor, and Founder of Trading Educators, Inc.
Many traders are highly concerned with reducing their risk, and/or getting out when their positions turn against them. The normal method for doing this is to use a stop order. In his books, William O’Neal advocates getting out after an 8-10% loss. Many other authors of trading books also suggest this approach.
This is an adequate approach, except for two details never mentioned in most books: the first is that you don’t know when the 8-10% is going to happen; the second is that the price can gap over your 8-10% stop, causing you to exit with a greater loss than planned.
However, there is a way to know exactly when to exit, and how much of a loss you are willing to accept. More importantly, the stock can gap as much as it wants, but you would lose only the predetermined amount you decided upon when you entered the position.
The Protective Put or Call is a synthetic options strategy that allows you to have predetermined risk and unlimited growth potential. A Protective Put is used for a bullish position, and a Protective Call is used for a bearish position. The following example shows Protective Puts. A good Protective Put position is usually one that limits your risk to about 6%. This strategy positions you at least 2 – 4% better than would using the conventional wisdom of an 8 – 10% stop.
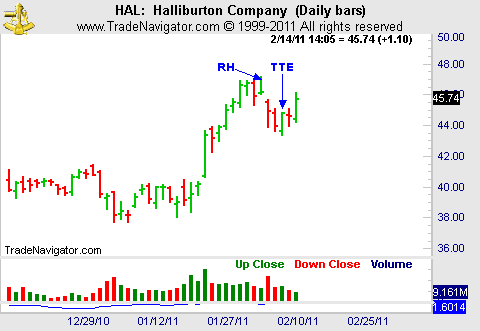
Additionally, there is a method for entering a Protective Put with very little, and sometimes negative, risk. You enter it using the Trader’s Trick Entry (TTE), using the principles of the Law of Charts. In the following example, our entry uses a Ross Hook (RH) chart formation with the TTE.
Trading is never without risk, but the length of time for which you accept that risk is under your control. When you are able to control events, the probability of your making a profit increases dramatically. The question is, how do you use the Law of Charts to create negative risk more quickly, without any additional risk when entering the position? Assume the following:
Stock/ETF price = $50
Put strike price is $60 and 6 months' out
The $60 Put premium is $13.80, creating a 6% ($3.80) risk on capital 1
7-Day Average Trading Range (ATR) is 1.50
Examining our situation using 100 shares, we have:
Traditional 8 – 10% stop loss
| Cost of Stock/ETF | $ 5,000 |
| Stop Risk (10%) | $ 500 |
| Downside Gap Open Risk | ??? |
| Total Risk | Unknown |
| Protective Put | |
| Cost of Stock/ETF | $ 5,000 |
| Cost of Put | $ 1,380 |
| Total Cost | $ 6,380 |
| Put Sell Rights | $ 6,000 |
| Total Risk | $ 380 |
| Downside Gap Open Risk | $ 0 |
| Total Risk Guaranteed | $ 380 |
From the initial entry, the Protective Put limits our risk without any potential for more.
How do you reduce the risk even more? With the above parameters you would have to make up $3.80 upon entering the position, without risking more than 6%. That would be the same risk as if you had entered the Protective Put directly. To make up the $3.80, you will use a combination of Options and Stock to reduce your risk to near zero or less.
First, you need to determine the Law of Charts' formation with which to enter. The preference would be to enter a position with momentum. Therefore, look for a Ross Hook in a trend, and select your entry point according to the Law of Charts.
1 Rounded to the nearest option premium.
As mentioned above, there is no such thing as risk-free trading. However, the amount of time for which you accept that risk is your decision. The total time to execute this entry strategy will be 1 day. During that day, you employ the traditional stop methodology for your positions. However, since you will enter the positions after the market opens, there is no chance of your experiencing a gap down on the open.
The second step is to divide the risk amount of $3.80 into a portion for the stock and a portion for the options you will use. You will then employ a technique like the double or triple ETF to gain an advantage. For a double advantage, buy a long Call for each 100 shares of stock purchased. For a triple advantage, buy 2 long Call contracts. Buying long Calls requires less margin than does selling short puts. Our allocation for the triple advantage will be:
Stock/ETF risk = $1.80
Long Call Risk = $1.00 x 2 = $2.00
Total Allocated Risk = 3.80
These are the stops you will use for the stock and 2 option contracts when you enter them according to the Law of Charts and TTE methodology. In this manner, you are risking the same amount as if you entered the Protective Put directly. Do not get greedy, you just want to reduce your risk.
The third step is to place contingent orders to enter the stock and 2 option contracts with stops of $1.80 and $1.00 respectively. Be sure to select an option with a delta of 75 or greater. It will not take much movement to get close to a negative risk Protective Put with this set up, as it is very likely to occur within one day.
The 7-Day ATR (Average True Range) is 1.50; its significance is how much you can expect the stock/ETF to move in one day. Do not expect to get 100% of the movement: 70% is good, and 80% is very good. This is what you should be looking for as your decision point to exit the Long Call options and enter the Protective Put.
| Stock Increase of approximately | $ 1.20 |
| Option increase of approximately $0.75 x 2 | $ 1.50 |
| Decrease in $60 Put of approximately | $ .40 |
| Total Advantage | $ 3.10 |
Protective Put Risk
| Cost of Stock/ETF | $ 5,000 |
| Cost of Put | $ 1,380 |
| Total Cost | $ 6,380 |
| Put Sell Rights | $ 6,000 |
| Total Risk | $ 380 |
| Downside Gap Open Risk | $ 0 |
| Total risk guaranteed | $ 380 |
| TTE Strategy | $ -310 |
| Total Risk | $ 70 |
| % Risk | 1.1% |
Can and does this work? Yes, it does, but you have to have your plan in place before you jump into the market. You must have your plan in place BEFORE you enter the trade
There is one more step to this trade, and that is how to set yourself up for unlimited upside potential. This is a bullish strategy, and the two simplest methods are to do nothing and just let the stock appreciate, or to sell a Call at or above the strike price of the Put.
These are very effective and profitable strategies. However, selling a Call will remove you from any profits above the strike price of the Call. Doing nothing requires the stock to rise $10.70 before you have any profit. There is a third and more effective trade: sell a Bear Call Spread at or above the Protective Put strike price.
| Total Current Risk | $ .70 |
| Sell Bear Call for at least | $ .70 |
| Total Position Risk | $ 0 |
| % Total Risk | 0% |
The advantage of using a Bear Call Spread instead of the Covered Call is that you participate in the appreciation of the stock when it rises beyond the $75 strike price of the short Call. The worst you can do is 0% return, and the best is unlimited. However, as the expiry date approaches you will have to make a decision to sell the long Call to take your profits.
Other methodologies for adding profits include selling Puts when the stock/ETF is rising, taking small profits. When the stock is falling, selling the stock and buying it back at a lower price provides the same return as short selling, but without the risk.
In the above example we used a stock. You can use this strategy equally well with futures contracts with one precaution. Whereas a stock will not expire, a futures contract will expire, so you must carefully structure the trade with the understanding that the expiration date for a futures contract must be taken into consideration.
© by Joe Ross. Re-transmission or reproduction of any part of this material is strictly prohibited without the prior written consent of Trading Educators, Inc.
Trading Article - Trading for a living
by Master Trader Joe Ross
Author, Trader, Trading Mentor, and Founder of Trading Educators, Inc.
Trading for a living involves more than getting in and out of the market at the right time, and more than thinking about moving averages and indicators. Trading is a business, not just a job, and every business in the world has to be managed. Every business involves the managerial functions of organizing, planning, delegating, directing, and controlling. If you, the trader, are to perform these functions well, you must learn to practice self-discipline and self-control.
It is actually painful to see traders who are highly successful in their present occupations, yet who come into the business of trading for a living using few, if any, of the managerial skills that make them winners in their own area of specialization. They have entered into a high-stakes venture, but are acting as if there were no way to lose. By omitting the functions of management, they often lose a considerable amount of money. They blindly throw themselves, their time, and their capital resources at the markets.
There is much more to the business of trading for a living than just trade, trade, trade, with no regard for the managerial aspects of trading. Traders are generally defeated by their own bad habits.
If you have any bad habits, expect the market to discover them and destroy you with them. In the business of trading, you have to take every step possible to save yourself the pain of having the markets discover your weaknesses. You need to find those weaknesses yourself, before you are hurt, and learn how to deal with them. Do you stay in too long? Do you expect too much from a trade? Are you greedy? Do you find yourself ending up "the greater fool?" Are you overtrading? Are you selfish? Are you fearful? If you have any of those bad habits, they are problems; and for problems, there are solutions.
If you think trading for a living is the same as investing, you are way off base. You need to realize there is a vast difference between the business of investing and the business of trading. You need a wake-up call if you are trading from desperation or the opinion of others — even your own opinion is worthless! You cannot change the market with your opinion. The only thing you can do if you want to win is to get in step with the market.
If you are looking for the holy grail of trading, or if you are trading because you’re bored, then you need to stop, think, and take a good look at yourself.
Until you establish your trading as a business, you will find that you don’t know what it means to let your profits run — you won’t have any consistent profits! Until you discover your real personal risk tolerance, you won’t really understand the meaning of risk. True risk management involves matching your risk tolerance with the risk in the marketplace.
If you are losing money, it’s because you don’t actually understand losing! Believe it or not, there’s an art to losing in the market. You have to learn how to control your losses; when you do, the wins will take care of themselves!
Are you a trader who tries to reinvent the wheel? Are you a trader who shoots his mouth off? Do you lie to yourself? Do you change your trading plan in mid-stream? You need to fix these bad habits.
Are you getting out of a trade too soon? Are you afraid to be wrong? What are your character faults? Do you see them?
Do you suffer from lack of humility? Are you throwing good money after bad? Just what is your sad but true story?
If you’re a losing trader, you need to be taken apart at the seams, put back together, and placed on the path to success.
The business of trading for a living involves making and taking profits. In addition to finding the solutions to your problems, you have to learn the chart patterns for success, as well as how to manage trades and manage yourself.
Over fifty-six years ago, I (Joe Ross) went through the very same problems you face today. I had to deal with those problems, and believe me, I had many of the bad habits discussed in this article.
Partly to help myself, and partly to help others, I wrote down the problems and solutions in what has become a classic manual for traders. It’s called Trading Is a Business, and it’s about making money in the markets. The book deals with solving the problems most traders have. Since I wrote the book, I have discovered that there are numerous traders who are successfully trading for a living through using what they learned in Trading Is a Business.
Trading Is a Business caused one trader to write, "I have been trading for six years with limited success. Joe’s techniques have really brought my trading into focus. Joe’s trade and money management techniques in particular, have helped me to become more consistent in my trading. Learning to take some profits early on has made a huge difference." Simon H.
I knew I had succeeded at getting my message across when I received this email: "Learning that trading is a serious business has changed my life. I was about to give up, when I began to fully realize just how serious this business really is. However, now that I finally woke up, I am a winning trader making money for myself and my clients." Mark C.
My book has helped thousands of traders. You, too, might consider studying your own copy of Trading Is a Business.
© by Joe Ross. Re-transmission or reproduction of any part of this material is strictly prohibited without the prior written consent of Trading Educators, Inc.
Instant Income Guaranteed - MOMO Trade
Developer: Joe Ross
Administration and New Developments: Philippe Gautier
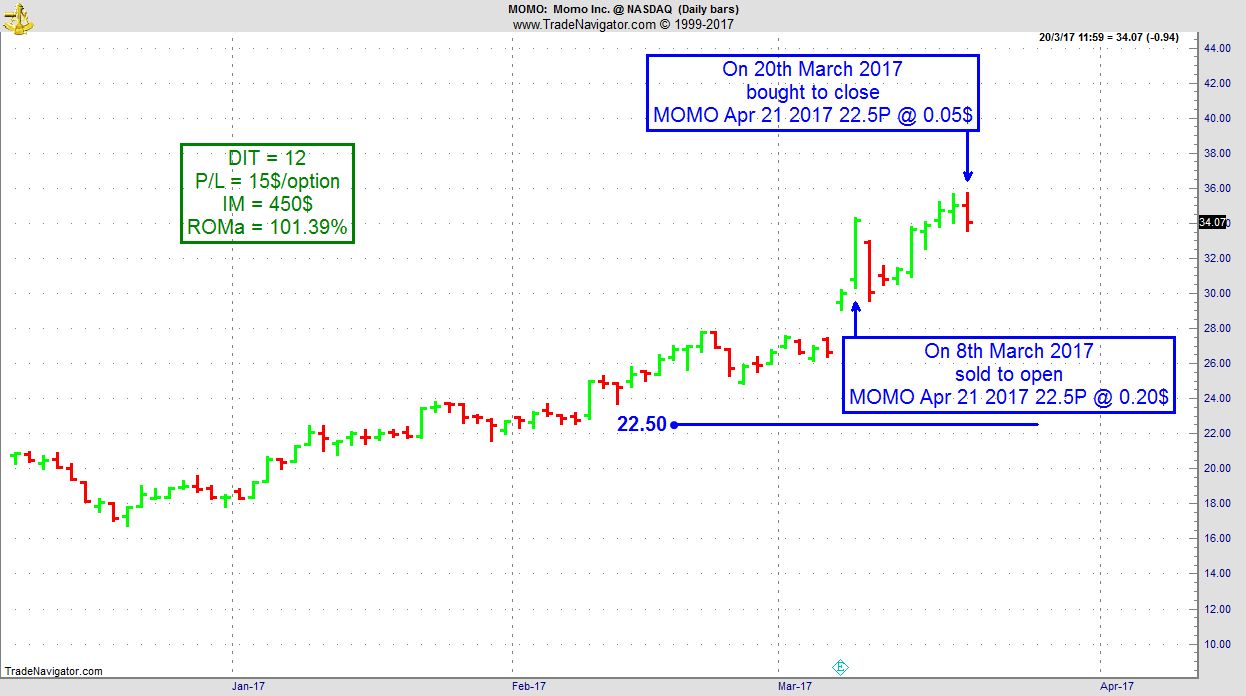
On 7th March 2017, we gave our IIG subscribers the following trade on MOMO, right after earnings. We decided to sell price insurance as follows:
- On 8th March 2017, we sold to open MOMO Apr 21 2017 22.5P @ $0.20, i.e. $20 per option sold, with 43 days to expiration, and our short strike below a major support zone, about 25% below price action.
- On 20th March 2017, we bought to close MOMO Apr 21 2017 22.5P @ $0.05, after 12 days in the trade, for quick premium compounding.
Profit: $15 per option
Margin: $450
Return on Margin annualized: 101.39%
This trade was pretty safe in spite of overall very low implied volatility levels.
We have also added new types of trades for our IIG daily guidance, "no loss" propositions with unlimited upside potential, still using other people's money to trade (see recent EWZ example in Newsletter Edition 649 found in our "member only" area under the archives tab).
Philippe
Receive daily trade recommendations - we do the research for you!
Instant Income Guaranteed
♦ SIGN UP TODAY! THIS IS WORTH THE INVESTMENT ♦
Check out our Blog!
To view previous published Chart Scan newsletters, please log in or click on "Join Us,"
shown above, to subscribe to our free "Members Only" section.
A WEALTH OF INFORMATION & EDUCATION:
Joe Ross-Trading Educators' popular free Chart Scan Newsletter has been published since 2004.
Note: Unless otherwise noted, all charts used in Chart Scan commentary were created
by using Genesis Financial Technologies' Trade Navigator (with permission).
Legal Notice and Copyright 2017 Disclaimer - Published by Trading Educators, Inc.
Chart Scan is a complimentary educational newsletter.
© by Trading Educators, Inc. Re-transmission or reproduction of any part of this material is strictly prohibited without prior written consent.
Edition 666 - March 17, 2017

Chart Scan with Commentary - Setting Objectives
by Master Trader Joe Ross
Author, Trader, Trading Mentor, and Founder of Trading Educators, Inc.
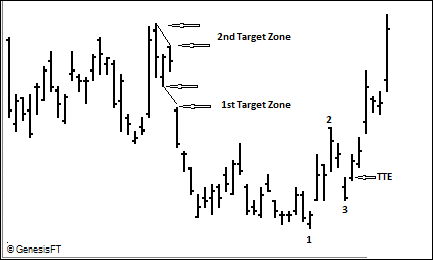
Prices formed a base at the end of a down swing, and then formed a 1-2-3 low. Prices thrust above the #3 point, and I was filled on a Traders Trick Entry. My first objective was for prices to reach to, or close near the #2 point, but what if prices continue higher? How should I set objectives for the remainder of my position?
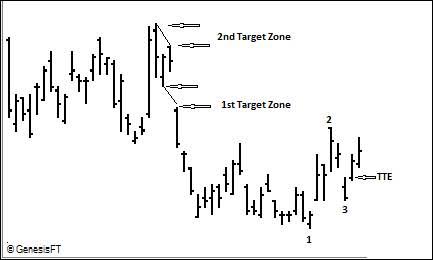
If prices break beyond #2 there were two immediate target zones. The first one was the gap that formed when prices moved down to squeeze out the last of the bulls (1st Target Zone). Traders become confused by gaps, and tend to move protective orders to the top and bottom of the gap. The second one is that of previous consolidation high (2nd Target Zone). Prices had held steady while in the area of the previous consolidation, but after a breakout to #1, a move back into the consolidation area will generally see a test of the highs.
The chart below shows what happened with this trade:
© by Joe Ross. Re-transmission or reproduction of any part of this material is strictly prohibited without the prior written consent of Trading Educators, Inc.
Trading Article - Commitment
by Master Trader Joe Ross
Author, Trader, Trading Mentor, and Founder of Trading Educators, Inc.
Recently, someone sent me the following question: "Just how committed does a trader need to be?"
I don’t know that I can put a number to that. For instance, on a scale of 1-10 how committed should a trader be. But if I had to evaluate it on that basis, I would say he must be a "10."
What is the value of commitment? How do you measure such a thing?
Most people have an "interest" in becoming consistently profitable traders. However, few possess the essential ingredient of "total commitment." Total commitment is what is demanded for a high level of success from any endeavor. A trader with commitment will take the money from 100 traders who have only an "interest."
Commitment is seen as Cortez burning his ships upon landing in Mexico. With less than 100 men, Cortez rode into Mexico City against 100,000 Aztec warriors and placed Montezuma, leader of the Aztecs, in chains. Few people have ever accomplished any goals without commitment to success. For some traders, commitment to success is not optional but mandatory.
© by Joe Ross. Re-transmission or reproduction of any part of this material is strictly prohibited without the prior written consent of Trading Educators, Inc.
Instant Income Guaranteed - EMC Trade
Developer: Joe Ross
Administration and New Developments: Philippe Gautier
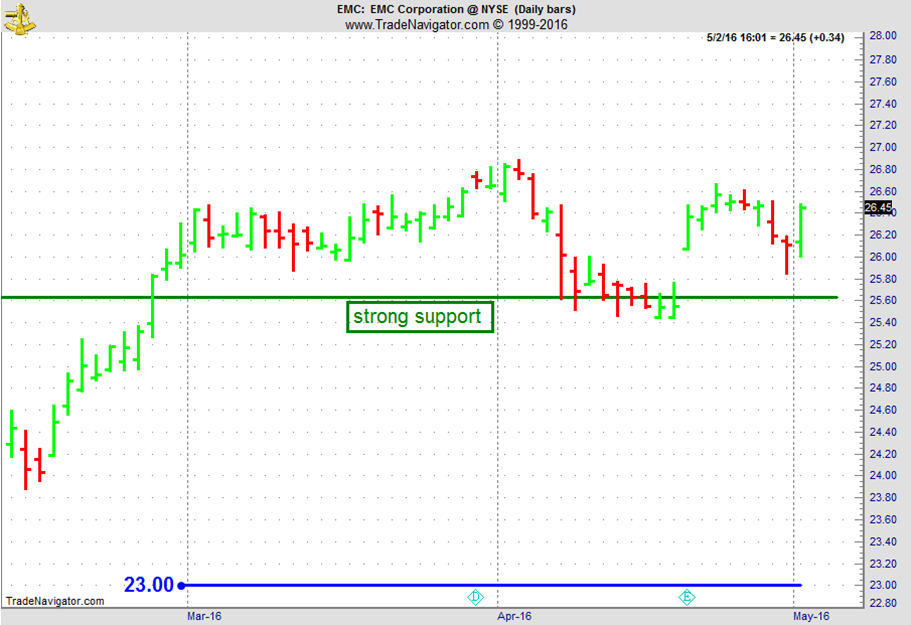
On 2nd May 2016 we gave our IIG subscribers the following trade on EMC, on a TTE on a RH on the daily chart. We decided to sell price insurance as follows:
- On 3rd May 2016, we sold to open EMC Jun 17 2016 23P @ $0.38, i.e. $38 per option sold, with 44 days to expiration, and our short strike below a major support zone, about 13% below price action.
- On 11th May 2016, we bought to close EMC Jun 17 2016 23P @ $0.19, after 8 days in the trade, for quick premium compounding.
Profit: $19 per option
Margin: $460
Return on Margin annualized: 188.45%
N.B. We have also added new types of trades for our IIG daily guidance, "no loss" propositions with unlimited upside potential, still using other people's money to trade.
Philippe
Receive daily trade recommendations - we do the research for you!
Instant Income Guaranteed
♦ SIGN UP TODAY! THIS IS WORTH THE INVESTMENT ♦
Latest Blog - How to Approach Trading - Part 6
by Professional Trader Andy Jordan
Educator for Spreads, Options, Swing/Day Trading, and
Editor of Traders Notebook Complete and Traders Notebook Outrights
If you missed the first blog in his series, be sure to check it out! Any fool can get into the market, but it takes a consistent successful trader to...read more.
© by Andy Jordan. Re-transmission or reproduction of any part of this material is strictly prohibited without the prior written consent of Trading Educators, Inc.
AlgoStrats.com
by Professional Trader Marco Mayer
Educator for Forex and Futures, Systematic Trader, and
Creator of Ambush Trading Method, Ambush Signals, and AlgoStrats.com
Click here to learn more about Professional Trader Marco Mayer - AlgoStrats.com!
![]()
© by Marco Mayer. Re-transmission or reproduction of any part of this material is strictly prohibited without the prior written consent of Trading Educators, Inc.
Check out our Blog!
To view previous published Chart Scan newsletters, please log in or click on "Join Us,"
shown above, to subscribe to our free "Members Only" section.
A WEALTH OF INFORMATION & EDUCATION:
Joe Ross-Trading Educators' popular free Chart Scan Newsletter has been published since 2004.
Note: Unless otherwise noted, all charts used in Chart Scan commentary were created
by using Genesis Financial Technologies' Trade Navigator (with permission).
Legal Notice and Copyright 2017 Disclaimer - Published by Trading Educators, Inc.
Chart Scan is a complimentary educational newsletter.
© by Trading Educators, Inc. Re-transmission or reproduction of any part of this material is strictly prohibited without prior written consent.
Edition 665 - March 10, 2017

Chart Scan with Commentary - Trade Management
by Master Trader Joe Ross
Author, Trader, Trading Mentor, and Founder of Trading Educators, Inc.
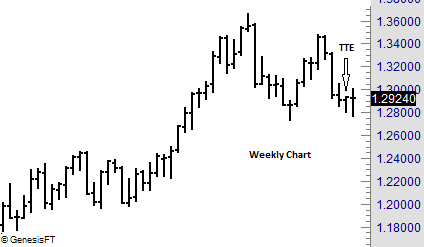
Prices have formed doji on the weekly chart. That doji bar, although it was an outside bar, also filled a Traders Trick Entry from the previous week. The question was “Would that entry also be fulfilled on the daily chart during the following week. By dropping down to the daily chart, would we see a chance for entry with a Traders Trick™ on the daily chart. Implementation of The Law of Charts™ teaches that entry signals from a larger time frame can often be entered and managed on a lesser time frame. So let's look at the daily chart and then see how we might have entered a trade based on a weekly signal on the daily time frame.
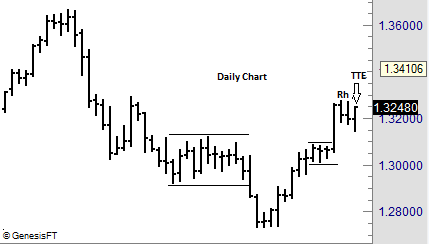
The Law of Charts states that a Ross hook is the first failure of prices to move higher following a breakout from congestion. The Law also states that a good way to enter such a trade is from a Traders Trick entry. In this case entry would be at 1.3253.
Now let’s go to a lesser time frame for actual entry and management with a daily chart.
© by Joe Ross. Re-transmission or reproduction of any part of this material is strictly prohibited without the prior written consent of Trading Educators, Inc.
Trading Article - Keeping Your Focus Right
by Master Trader Joe Ross
Author, Trader, Trading Mentor, and Founder of Trading Educators, Inc.
Some time ago I spent 4 days in a Forex trading office, teaching and working with the traders there. It was interesting to see how these traders speak with one another, and to listen to what they say. I couldn’t help making some observations which I will now share with you.
If you are a part- or full-time trader, you may have enjoyed the attention this wild and wooly occupation brings at social gatherings and events. Many are interested in trading, and find you interesting as a successful trader. At first, the attention may be enjoyable; but a need to maintain this reputation may impact your trading attitude and mindset, and therefore, your bottom line.
The best strategy you can use to avoid letting your reputation influence your performance—especially when enduring a drawdown period—is to keep your conversation low-key about your trading career. Why? The more you present yourself socially as a "successful trader," the more psychological effort you will spend defending this reputation. Several research studies have documented that one of the biggest obstacles to sound decision-making is the need to save face in social situations. People are so reluctant to face the adverse social consequences of having made a poor decision that they stay on a losing course of action, rather than admit they were wrong. For example, some traders are reluctant to sell off losers in order to avoid the possible social criticism that acknowledging a failure may bring.
Suppose you have told your friends about a large position, and within minutes, hours, or days, it tanked, hard and fast. Most folks can’t wait for the next opportunity to ask you (even though they probably know the answer) how your “hot trade” is doing. If you got rid of it, at least you have the solace of managing the trade properly—even though you must tolerate a volley of smug “you-thought-it-would-go up and such, but-it crashed-instead” comments. On the occasions when you ignored your protective stop, however, and held onto the bad trade, the “Boy, you-really-ARE-dumb” looks (and perhaps comments) can exacerbate the psychological devastation you've by now, surely, inflicted on yourself. And we all know the negative impact a negative attitude can have on our trading.
As another example, how many times has the market gapped up, then chopped through the rest of the day, handing you more losses than wins? Inevitably, those are the days when well-meaning friends call on the phone. “You must have made a fortune today!” they gush. “Not really,” you mumble with a sinking heart, remembering the frustrating trading environment. After you hang up the phone, the subsequent feelings can lead you to believe you must have been a dope that day; surely every trader in the world except you grabbed huge gains. In social environments, once you announce and identify yourself as a trader, you will feel a need to defend your reputation. Trading is hard enough, why introduce additional social and psychological pressures that will adversely influence your trading results? Keep the specifics of your trading career to yourself. There is no sound reason to discuss the specifics of your career socially. It’s often done just to build up your ego, and enjoy the attention of others. You'll pay a price for this short-term gratification in the long run. Avoid specific observations or trading choices. That way, you'll avoid embarrassing questions and comments that will interfere with your trading.
© by Joe Ross. Re-transmission or reproduction of any part of this material is strictly prohibited without the prior written consent of Trading Educators, Inc.
Instant Income Guaranteed - TOL Trade
Developer: Joe Ross
Administration and New Developments: Philippe Gautier
On 22nd February 2017 we gave our IIG subscribers the following trade on TOL, after an earnings gap. We decided to sell price insurance as follows:
- On 23rd February 2017, we sold to open TOL Apr 21 2017 30P @ $0.25, i.e. $25 per option sold, with 58 days to expiration, and our short strike below a major support zone, about 12% below price action.
- On 1st March 2017, we bought to close TOL Apr 21 2017 30P @ $0.10, after 6 days in the trade, for quick premium compounding
Profit: $15 per option
Margin: $600
Return on Margin annualized: 152.08%
This trade was pretty safe in spite of the very low implied volatility environment we are now in.
We have also added new types of trades for our IIG daily guidance, "no loss" propositions with unlimited upside potential, still using other people's money to trade.
Philippe
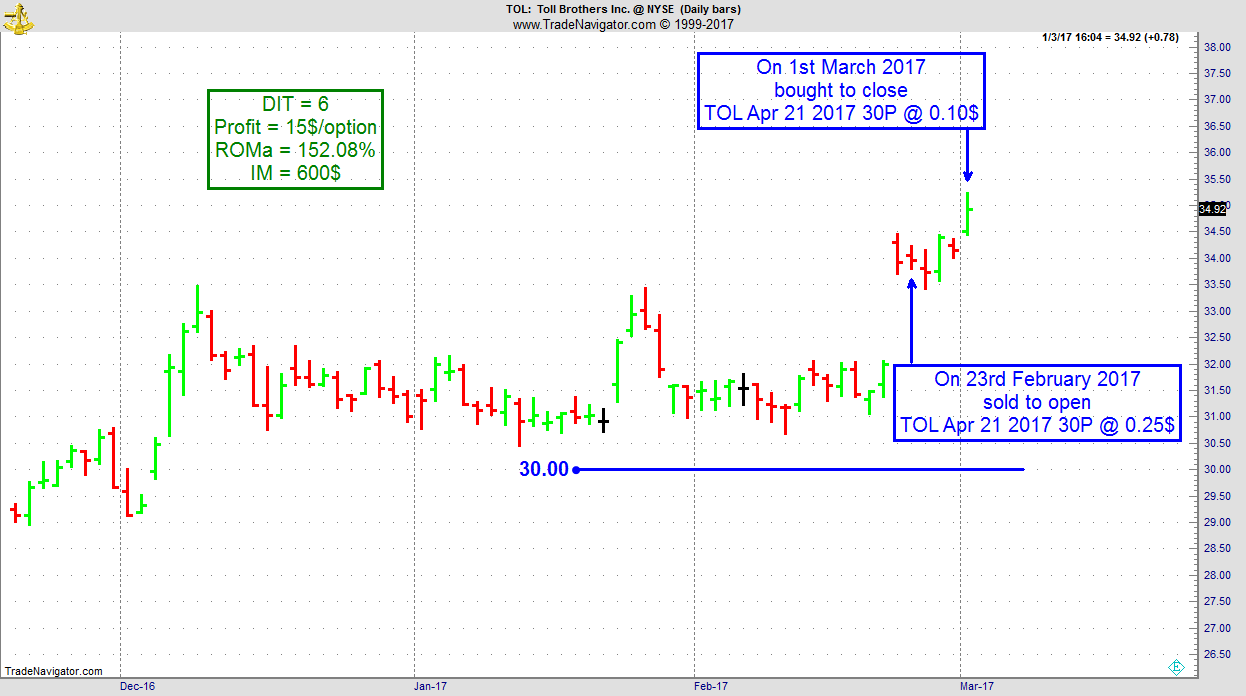
Receive daily trade recommendations - we do the research for you!
Instant Income Guaranteed
♦ SIGN UP TODAY! THIS IS WORTH THE INVESTMENT ♦
Latest Blog - Can Trading Be Trained?
by Professional Trader Andy Jordan
Educator for Spreads, Options, Swing/Day Trading, and
Editor of Traders Notebook Complete and Traders Notebook Outrights
This week, Andy includes a short podcast he found interesting and uses it to point out some revelant facts that many people don't take into consideration. Read more.
In addition, Andy continues his series on How to Approach trading with Part 5:
Follow the Markets
After you've determined your strategy and the market or markets you will trade, you can start following the price action. It is important to follow each market consistently and see the trading opportunities as they develop. Jumping around from one market to another often leads to missed or late execution of your method. I think it's important to let the market tell you what to do. I'm sure many of you have heard the saying, "The trend is your friend." There is truth in that, but not all good trading must follow the trend. Since these days markets trend so little that perhaps we should come up with a new saying: "The swing is your thing." How about this one: "The setup is my get up."
I don't generally concern myself a lot with how much a market is going move overall. But I am concerned with how much the market will move minimally. I want to guarantee myself a minimum move a high percentage of the time. I'm satisfied with being on the right side of the trade. However, I'm constantly asked; "Where do you think prices are going?" or "When should I get out of the move?" My answers are usually; prices will move in the direction of the trade—they will go where they want to go." And "Get out of a trade when it quits going your way, or you’re satisfied with the profits you’ve made." A potential objective number of points, ticks, or pips are most useful when you are trying to decide which of several different markets to trade or when deciding how much of your capital to allocate to a particular trade.
Stay on the Right Side
It is important to stay on the right side of the market, buying when it is going up, selling when it is going down, and staying out when it is not going anywhere. But again, this is a generality. There are plenty of traders who make their money when a market is not going anywhere. Option sellers who straddle and strangle love markets that are going nowhere at all. In any event, staying out is often easier said than done.
Sometimes you'll have to be pretty nimble to stay on the right side of the market.
It's important to not be committed to a direction when the market tells you otherwise and be willing to allow that the market is never wrong.
© by Andy Jordan. Re-transmission or reproduction of any part of this material is strictly prohibited without the prior written consent of Trading Educators, Inc.
Volume in the Forex Markets - Useful or Not?
by Professional Trader Marco Mayer
Educator for Forex and Futures, Systematic Trader, and
Creator of Ambush Trading Method, Ambush Signals, and AlgoStrats.com
As traders, we’re always looking for useful data that might give us an extra edge. That’s even truer for technical/price focused traders where all we have is the open, high, low and close of a market (or tick data, but that usually ends up in some similar transformation as OHLC data). Sure there are thousands of indicators but these are all just transformations of that price data.
Now in many markets volume can be a useful addition to that. Knowing if there was heavy trading within a certain time period or not can be valuable information. It can be used as a filter for trade signals, looking for strong volume on a breakout for example. But there’s also a couple of volume based indicators that incorporate volume in a useful way.
In the futures markets, when you look at the volume you actually see how many contracts have been traded at the exchange during that time period. And you see all of it, of all market participants in that market as there’s just one exchange.
But Forex trading is decentralized, OTC trading. There is no single place to look at to see the actual volume of a currency pair. That’s why it’s often said that the volume provided by your broker is pretty useless. All you would see is the trading volume that happened at your broker, either between clients and liquidity providers in an ECN or if you’re trading at a market maker between your broker and it’s clients. But retail traders are not moving the markets, their volume is totally meaningless in a such a big marketplace.
And of course, the institutional traders that are responsible for the volume that matters don’t trade at a retail broker. They’re on Reuters, EBS or just trading directly with other banks/institutions. So if you just see the volume that happened at your retail broker, it’s useless information right? That’s what I thought too and so I never paid much attention to volume in FX.
Until recently when CLS FX volume data became available for the retail customer over at Quandl. CLS runs the largest FX settlement service in the world and therefore they have the information we’re looking for. Institutional Forex trading volume, the volume that actually matters and moves the markets. Now CLS does a great job here and as always, it’s super easy to use the data via Quandl. So if you can afford it, I think that data is the best forex volume data you can get and that is well worth its price.
So once that real volume data was available, I, of course, got very excited and curious. Maybe it was time to have another look at volume data in the Forex markets. How would the CLS volume data compare to different brokers data? What is it actually that you see at your broker? And how does it compare to the Futures contracts?
Two brokers that offer volume data and I already had an API to connect to are Oanda and Dukascopy. So I downloaded their data, merged both to the same daily time periods and compared them. The first surprise for me was that it was almost identical (over 90% correlated). So I decided to read more about that data and found out that what they’re providing is actually "tick volume" data. This means that whenever there’s a new quote from the source they’re using (Oanda probably uses Reuters and other similar data feeds, Dukascopy offering ECN trading probably use the quotes of each of their liquidity providers) that would make the volume go higher. That of course strongly increases the odds of their volume data actually being useful. It would mean that what we’re seeing is not what’s going on between them and their clients but on their quote data sources. And that indeed might be informative.
But is it? As traders we never want to rely on an assumption, we want actual numbers that proves our idea right or wrong. So let's find out! The first step was to get one of the free samples of CLS data available at Quandl. I picked the daily GBP/JPY spot data and compared it to Oanda's tick volume data.
First of all the actual absolute numbers are of course totally different. And if that's what you need, CLS is the only way to go. But as traders what we usually are interested in is "Is today's volume above/below average?" or "Is today's volume some standard deviation above/below average?" and so forth. And for this we're fine as long as the data is correct on a normalized basis.
Here’s a graph of GBP/JPY volume from CLS and Oanda plotted on two Y axis (CLS left, Oanda right):
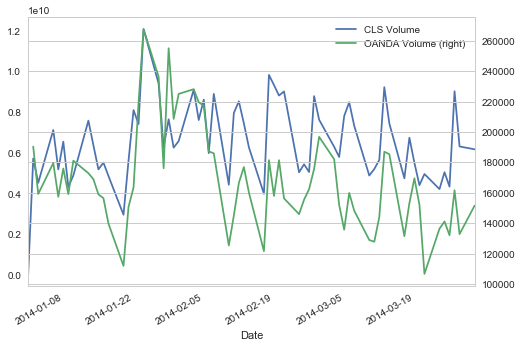
So again, yes the absolute numbers are totally different but on a relative basis, looking for volume rising/falling and most of the spikes they look quite similar.
Looking at the same data showing the percent change between each day that becomes even more clear:
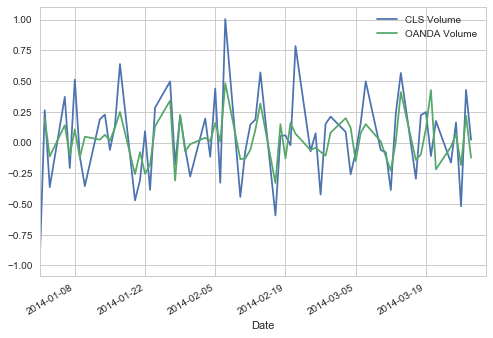
Now there are differences, but as you can see they’re highly correlated. Which leads me to the conclusion that FX brokers data might indeed be of some value.
My next idea was to compare one of the spot Forex markets to a futures market. I picked AUD/USD spot FX, again using Oanda data and the Australian Dollar Future (6A) traded at the CME.
Again, on a relative basis looking at the percent change of day to day volume we get another confirmation:
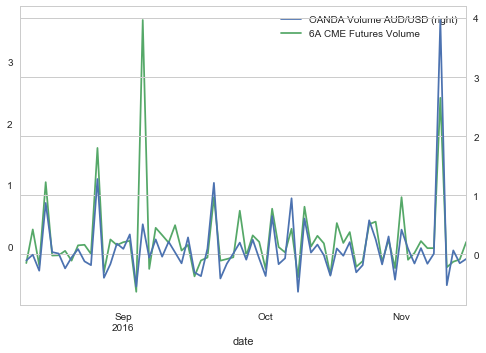
Conclusion: Surprise! As so often in trading the result of that little investigation is very different from what I expected. The FX volume data provided by your broker/ECN might indeed be valuable information!
Happy Trading!
Marco
Click here to learn more about Professional Trader Marco Mayer - AlgoStrats.com!
![]()
© by Marco Mayer. Re-transmission or reproduction of any part of this material is strictly prohibited without the prior written consent of Trading Educators, Inc.
Check out our Blog!
To view previous published Chart Scan newsletters, please log in or click on "Join Us,"
shown above, to subscribe to our free "Members Only" section.
A WEALTH OF INFORMATION & EDUCATION:
Joe Ross-Trading Educators' popular free Chart Scan Newsletter has been published since 2004.
Note: Unless otherwise noted, all charts used in Chart Scan commentary were created
by using Genesis Financial Technologies' Trade Navigator (with permission).
Legal Notice and Copyright 2017 Disclaimer - Published by Trading Educators, Inc.
Chart Scan is a complimentary educational newsletter.
© by Trading Educators, Inc. Re-transmission or reproduction of any part of this material is strictly prohibited without prior written consent.
Edition 664 - March 3, 2017
Chart Scan with Commentary - Anticipation
by Master Trader Joe Ross
Author, Trader, Trading Mentor, and Founder of Trading Educators, Inc.
With prices overall being in an uptrend, what should be our anticipation for prices exiting the consolidation?
As we view the chart, we see that prices are off their recent highs and have made 5 correcting bars prior to the last bar shown. The question is will prices stay in consolidation, break out to the upside, or break to the downside?
According to the Law of Charts and the Traders Trick the current anticipation is for sideways action. When there are more than 3-4 bars of correction, the percentages change to favor consolidation. Adding to this concept is the fact that the last 5 bars have either opened or closed inside of a "measuring bar". The measuring bar is the long bar that took place on November 18. In fact, there is another way to look at this chart which you will see below.
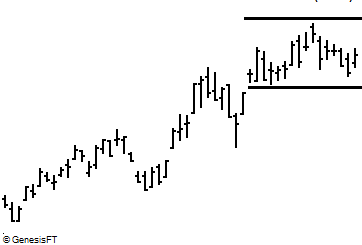
© by Joe Ross. Re-transmission or reproduction of any part of this material is strictly prohibited without the prior written consent of Trading Educators, Inc.
Trading Article - When Low Probability Setups Seem Attractive
by Master Trader Joe Ross
Author, Trader, Trading Mentor, and Founder of Trading Educators, Inc.
“I’ll worry about it later?” When trying to deal with the fact that we must eventually cope with an unpleasant event, such statements help us get through life. We often put off things we don’t want to do, hoping that we will gather enough energy and enthusiasm to deal with them in the future. Take your taxes for instance. Do you wait until the last day to pay them? Why not start working on your taxes today? Most people avoid gathering and organizing their financial records until they need to. We prefer to put off facing an unpleasant reality, such as doing our taxes, until the very last minute. The same thing seems to happen when we make trading or investment decisions. Researchers suggest that people may be willing to invest in low probability setups as long as they don't have to deal with the consequences of the trade immediately.
Research participants were asked to imagine making various economic decisions and to indicate which economic decision they would prefer and under what conditions. In the first hypothetical economic decision, the payoff was high, but the chance of receiving the payoff was low. In the second economic decision, the payoff was low, but the chance of receiving the payoff was high. People’s preferences depended on whether the payoff was to be received immediately or in the distant future. People indicated that they would be willing to accept a low probability of success if the potential payoff was high and they didn't need to find out what happened until the distant future. People did not prefer an economic decision that had a low probability of success if they had to deal with the outcome of the decision in the near future. Indeed, if they had to make an economic decision that had consequences for the near future, they would take the option of receiving a low payoff as long as it had a high probability for success.
These research findings may explain how decisions about long-term trades and investments are made. When it comes to long-term investments, people are willing to risk money on a low probability setup as long as they believe the potential profit is high. This is somewhat irrational, however. The probability of success is an important element when deciding whether to risk capital. It doesn’t matter whether it is a long-term investment or a short-term trade, a trade setup should have a high probability of success. But people have a natural human tendency to accept a low probability setup as long as they don’t have to face the outcome until the distant future, and they believe that the potential payoff is high.
When making trading or investment decisions it's necessary to consider all possible aspects of a trade. It is essential to always trade high probability setups. If you trade low probability setups, you are likely to lose money in the long run. But greed can bias our decisions. If we believe that the potential profits are high, we tend to irrationally invest capital even when the odds of success are low. In the end, however, it's more beneficial to look for setups that have a high probability of success, even if it means standing aside until we find them.
© by Joe Ross. Re-transmission or reproduction of any part of this material is strictly prohibited without the prior written consent of Trading Educators, Inc.
Instant Income Guaranteed - MRK Trade
Developer: Joe Ross
Administration and New Developments: Philippe Gautier
On 2nd February 2017, we gave our IIG subscribers the following trade on MRK, after an earnings gap. We decided to sell price insurance as follows:
- On 3rd February 2017, we sold to open MRK Mar 24 2017 58.5P @ $0.35, i.e. $35 per option sold, with 51 days to expiration, and our short strike below a major support zone, about 9% below price action.
- On 22d February 2017, we bought to close MRK Mar 24 2017 58.5P @ $0.10, after 19 days in the trade, for quick premium compounding.
Profit: $25 per option
Margin: $1,170
Return on Margin annualized: 41.05%
This trade was pretty safe in spite of the very low implied volatility environment we are now in.
We have also added new types of trades for our IIG daily guidance, "no loss" propositions with unlimited upside potential, still using other people's money to trade.
Philippe
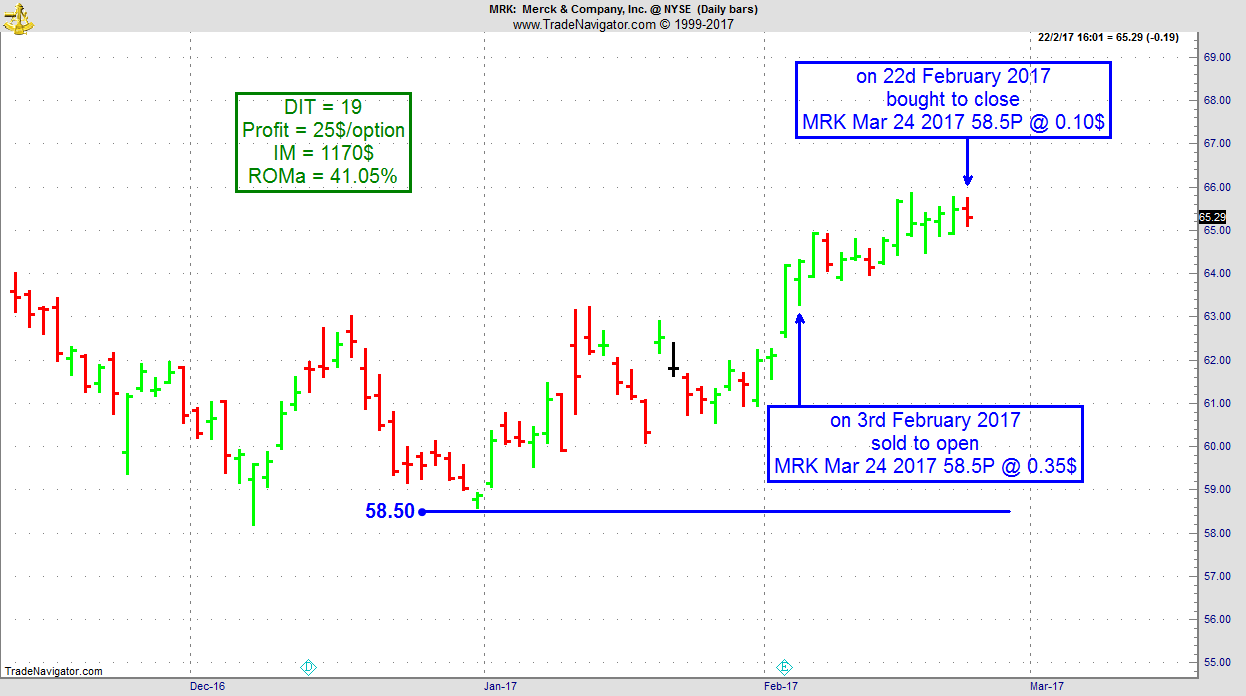
Receive daily trade recommendations - we do the research for you!
Instant Income Guaranteed
♦ SIGN UP TODAY! THIS IS WORTH THE INVESTMENT ♦
Latest Blog - How to Approach Trading - Part 4
by Professional Trader Andy Jordan
Educator for Spreads, Options, Swing/Day Trading, and
Editor of Traders Notebook Complete and Traders Notebook Outrights
In Part 4 of his series, Andy explains a crucial point for successful trading and what to avoid. Read more.
© by Andy Jordan. Re-transmission or reproduction of any part of this material is strictly prohibited without the prior written consent of Trading Educators, Inc.
Why Entry Signals Are Important
by Professional Trader Marco Mayer
Educator for Forex and Futures, Systematic Trader, and
Creator of Ambush Trading Method, Ambush Signals, and AlgoStrats.com
We hope you will enjoy one of Marco's popular videoes posted back in October of 2016 - it provides a good trading lesson.
0
Click here to learn more about Professional Trader Marco Mayer - AlgoStrats.com!
![]()
© by Marco Mayer. Re-transmission or reproduction of any part of this material is strictly prohibited without the prior written consent of Trading Educators, Inc.
Check out our Blog!
To view previous published Chart Scan newsletters, please log in or click on "Join Us,"
shown above, to subscribe to our free "Members Only" section.
A WEALTH OF INFORMATION & EDUCATION:
Joe Ross-Trading Educators' popular free Chart Scan Newsletter has been published since 2004.
Note: Unless otherwise noted, all charts used in Chart Scan commentary were created
by using Genesis Financial Technologies' Trade Navigator (with permission).
Legal Notice and Copyright 2017 Disclaimer - Published by Trading Educators, Inc.
Chart Scan is a complimentary educational newsletter.
© by Trading Educators, Inc. Re-transmission or reproduction of any part of this material is strictly prohibited without prior written consent.
Edition 663 - February 24, 2017

Chart Scan with Commentary - Traders Trick - Does it work in all markets?
by Master Trader Joe Ross
Author, Trader, Trading Mentor, and Founder of Trading Educators, Inc.
The Australian dollar had been rising against the U.S. dollar. At the time, I had been in the Aussie dollar for at least 3 years, and in addition to dollar deposits using Australian interest bearing notes I had begun trading iShares. iShares are an index of some of the top companies in Australia. It is through iShares that a trader can trade in another nation and still have the convenience of trading in his own country. Australian companies had been doing quite well supplying China with foodstuffs and raw materials. But in addition to the fat profits these companies were making, their stocks were rising because of the gain of the Aussie Dollar against the U.S. currency at the time. Trading or investing this way is a great way to hedge against a falling U.S. dollar.
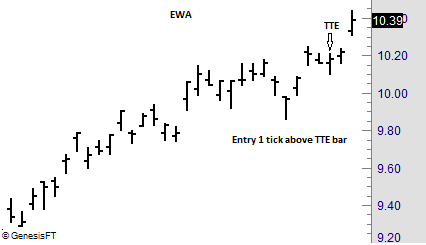
One day, iShares (Symbol EWA) offered up a Traders Trick for entry at a price of 10.24, 1 tick above the high shown at the arrow. Entry was actually made at 10.19, and the shares Closed two days later at 10.39 for a gain of 30 cents, or $300 on 1,000 shares.
The Law of Charts and the Traders Trick work in all markets, even markets as little known as Exchange Traded Funds or iShares.
© by Joe Ross. Re-transmission or reproduction of any part of this material is strictly prohibited without the prior written consent of Trading Educators, Inc.
Trading Article - Self-forgiveness and resolution
by Master Trader Joe Ross
Author, Trader, Trading Mentor, and Founder of Trading Educators, Inc.
If your financial losses have injured or hurt your personal relationships, you must apologize and ask those persons for their forgiveness. Most people will forgive you immediately but whether or not they forgive you is unimportant. It is most important that you forgive yourself and resolve not to repeat the same mistakes. It’s also important to realize that if the offended person does not forgive you, it becomes his or her problem. Once you ask forgiveness, the problem is no longer yours. Self-forgiveness and resolution not to repeat mistakes is the best antidote for fear, anger and guilt, the three emotions of personal and financial destruction. Never use living expense money to trade the markets. Traders should only trade disposable income, an oxymoron if there ever was one.
Markets seldom make major tops or bottoms based on any one government report. Many traders have a look of shock on their faces when markets fall after a bullish report, but that is what the market wanted to do before the report was released. There is a natural tendency of professional traders to discount reports and state that the price action was already in the market before the report was released. Fundamental traders should rate reports as: + = bullish, + + = very bullish, 0 = neutral, - = bearish, and - - = very bearish. I traded cattle in the late 1970's and early 1980's and the market moved opposite the reports over 60% of the time the next day and over 70% of the time by the following week.
© by Joe Ross. Re-transmission or reproduction of any part of this material is strictly prohibited without the prior written consent of Trading Educators, Inc.
Instant Income Guaranteed - GDXJ Trade
Developer: Joe Ross
Administration and New Developments: Philippe Gautier
On 6th February 2017, we gave our IIG subscribers the following trade on GDXJ (Market Vectors Junior Gold Miners ETF), which had a strong up day. We decided to sell price insurance as follows:
- On 7th February 2017, we sold to open GDXJ Mar 24 2017 33P @ $0.33, i.e. $33 per option sold, with 47 days to expiration, and our short strike below a major support zone, about 22% below price action.
- On 17th February 2017, we bought to close GDXJ Mar 24 2017 33P @ $0.15, after 10 days in the trade, for quick premium compounding.
Profit: $18 per option
Margin: $660
Return on Margin annualized: 99.55%
This trade was pretty safe.
We have also added new types of trades for our IIG daily guidance, "no loss" propositions with unlimited upside potential, still using other people's money to trade.
Philippe
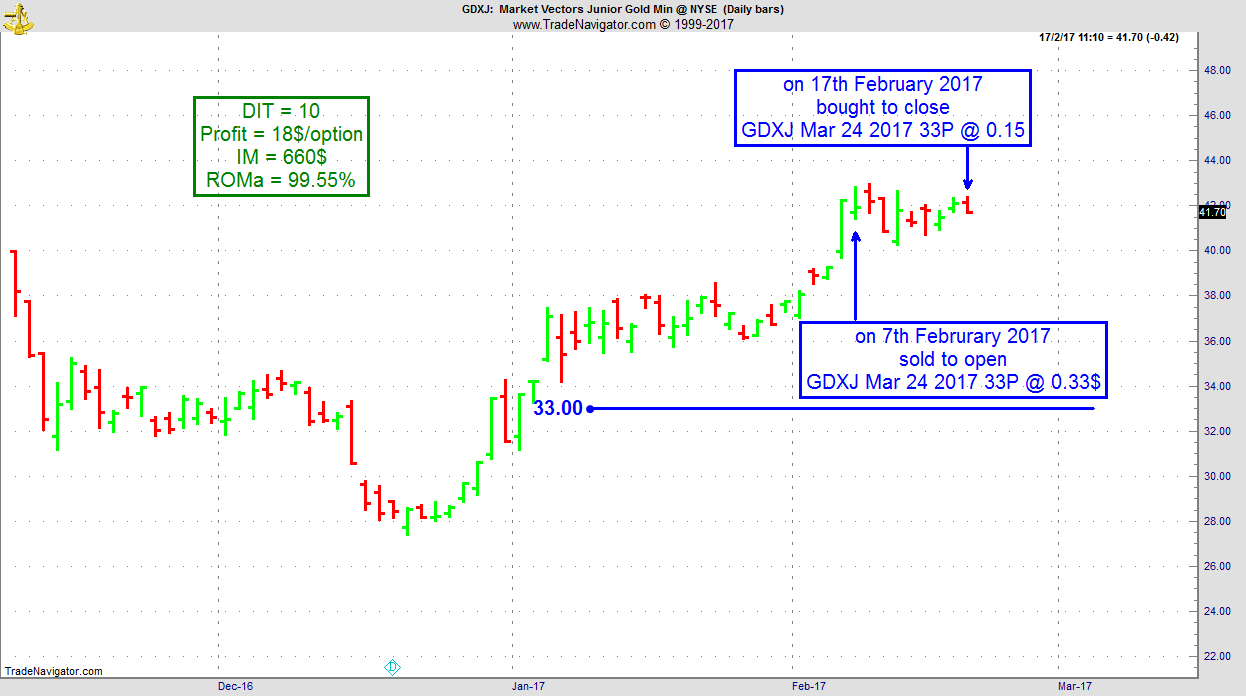
Receive daily trade recommendations - we do the research for you!
Instant Income Guaranteed
♦ SIGN UP TODAY! THIS IS WORTH THE INVESTMENT ♦
Latest Blog - How to Approach Trading - Part 3
by Professional Trader Andy Jordan
Educator for Spreads, Options, Swing/Day Trading, and
Editor of Traders Notebook Complete and Traders Notebook Outrights
In Part 3 of his series, Andy takes a look at what a good trading plan includes and answers an often asked question, "How do I get started?" Read more.
© by Andy Jordan. Re-transmission or reproduction of any part of this material is strictly prohibited without the prior written consent of Trading Educators, Inc.
Why paying close attention to FX trading costs is so important
by Professional Trader Marco Mayer
Educator for Forex and Futures, Systematic Trader, and
Creator of Ambush Trading Method, Ambush Signals, and AlgoStrats.com
I don’t know if there are still brokers out there advertising that there are no trading costs in trading Forex. But you all do know better by now. If there are no commissions, they’ll simply mark up the spread to get their share, or worse (see latest FXCM scandal) in some way profit from your positions. That’s why I always prefer to pay commissions, this way there’s at least a chance you’re actually trading and your broker isn’t just on the other side of your "trades". Also paying commissions results in smaller spreads which will save you more money in the long run than the commission you’ll pay.
Let’s have a look at the major trading costs in Forex. First of all the BID/ASK spread you almost always have to pay (unless it’s 0 which can happen, and sometimes you’ll even get filled at a better price than expected), then volume-based commissions you pay to your broker for executing your trade and if you keep your trade overnight you got to pay some overnight commissions/swaps. Depending on what kind of orders you are using to enter/exit trades, you’ll also have to deal with slippage to some extent.
As trading costs are a reality, it’s important to be aware of them. If you think you can ignore them, maybe because you believe your trading strategy is so good that a couple of pips don’t matter to you then you should think again. There’s a reason why so many professionals are literally obsessed in trying to reduce trading costs all the time. Over hundreds of trades, trading costs will make a huge difference and many strategies that look very profitable without trading costs will look much worse once reality is factored in.
Now each currency pair has slightly different trading costs and it’s important to keep track of these. To keep things simple, I’ll focus just on the BID/ASK spread for now. But you definitely should also pay close attention to the overnight swaps, especially if you’re trading longer term positions and to trading commissions and slippage if you’re day trading.
A day trading strategy might work nicely in EUR/USD for example when your average spread during liquid market hours usually is about 0.25 pips and the average daily trading range (high-low) is about 80 pips. That gives you a daily range (80) to spread (0.25) ratio of 320 (80/0.25 = 320). If either volatility or liquidity dries up in a market, this ratio will drop too. The higher the ratio, the better and for every strategy, there is a point where it will stop being profitable should the ratio drop below. That’s why this is an important ratio you should always keep track of.
Now let’s compare that daily range to spread ratio to EUR/CHF where your average spread during liquid market hours is about 0.5 pips and the daily range is about 30 pips. That’s a ratio of just 60, meaning trading in EUR/USD is about 5 times „cheaper“ in our example. Due to the lower volatility, you’ll also need to trade more contracts than in EUR/USD to get the same bang for the buck which means you’ll also have to pay more commissions. Will your day trading strategy still work in EUR/CHF despite the higher trading costs? That, of course, depends on the strategy but you better do the math and see if it’s still worth trading it in that market after trading costs.
The higher your trade frequency, the more important trading costs are and the fewer markets will your strategy be profitable in. The reason for this is the ratio between the average trade result and the BID/ASK spread + commissions. If on average you make 3 pips per trade, an average spreads of 0.5 pips is much more of an issue than if you’re trading on a longer timeframe and make 30 pips on average.
That’s why it’s so easy to come up with a strategy that trades on a 5-minute chart and looks like it will make you rich in no time until you add trading costs. Trading costs will kill you here unless you’re very efficient in your trade execution (which most retail traders simply cannot afford).
Whenever I develop a new trading system, I run different kinds of simulations to get a good idea of how sensitive the system is to trading costs. This way I get a pretty good idea if it’s actually worth trading the system in the real world. Once I start to actually trade a system, I keep close track of its trading costs. Then I compare the simulated trading costs (what I expect) vs. real trading costs (what I get in real trading). This way I’ll find out rather quickly if I underestimated trading costs or maybe have been too pessimistic and overestimated them. During the last 6 months, for example, I got about 25% better execution on average than my simulated results for AlgoStrats:FX. That’s fine for me as it’s a close enough estimation for my trading style and I’m rather slightly too pessimistic about trading costs than the other way around.
There’s a lot more to say about this topic, but for now, I’d like to wrap it up with my advice that you better pay close attention to trading costs.
Happy Trading!
Marco
Click here to learn more about Professional Trader Marco Mayer - AlgoStrats.com!
![]()
© by Marco Mayer. Re-transmission or reproduction of any part of this material is strictly prohibited without the prior written consent of Trading Educators, Inc.
Check out our Blog!
To view previous published Chart Scan newsletters, please log in or click on "Join Us,"
shown above, to subscribe to our free "Members Only" section.
A WEALTH OF INFORMATION & EDUCATION:
Joe Ross-Trading Educators' popular free Chart Scan Newsletter has been published since 2004.
Note: Unless otherwise noted, all charts used in Chart Scan commentary were created
by using Genesis Financial Technologies' Trade Navigator (with permission).
Legal Notice and Copyright 2017 Disclaimer - Published by Trading Educators, Inc.
Chart Scan is a complimentary educational newsletter.
© by Trading Educators, Inc. Re-transmission or reproduction of any part of this material is strictly prohibited without prior written consent.
Edition 662 - February 17, 2017

Trading Idea - Mixed Meat/Grain Butterfly
by Professional Trader Andy Jordan
Educator for Spreads, Options, Swing/Day Trading, and
Editor of Traders Notebook Complete and Traders Notebook Outrights
Once again I want to show you a “strange looking” butterfly: Long 1 April Feeder Cattle + 1 May Corn and short 2 August Live Cattle.
As you can see on the chart below the seasonal time window usually opens around February 5 with a close around April 10. Interestingly how precise this spread changed the direction this year. After testing the July low on February 6 it turned around and has been trading higher since then. Maybe it is already too late to enter the spread this year and the spread will not look back. But with these kind of volatile spreads there is always a chance the spread might show some weakness and maybe return to test the break even line again.
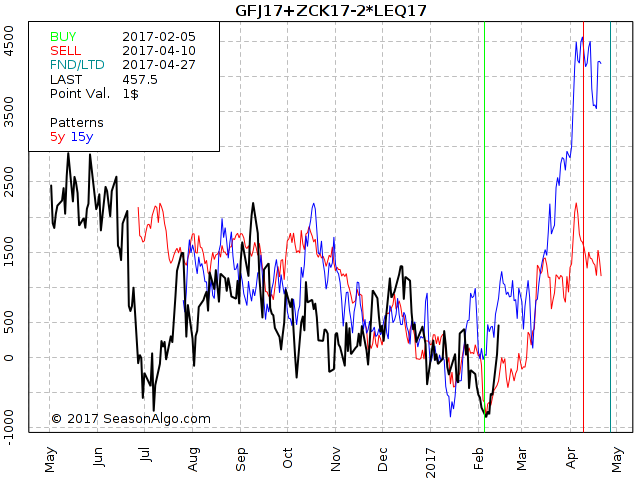
If you want to know how we trade this spread in Traders Notebook, please follow the link below.
Traders Notebook Complete had its most profitable year in 2016!
Learn how to manage this trade by getting daily detailed trading instructions, click here.
There is a special deal available for the ones new to our Newsletter.
© by Andy Jordan. Re-transmission or reproduction of any part of this material is strictly prohibited without the prior written consent of Trading Educators, Inc.
Why Knowing When Not to Trade is an Edge
by Professional Trader Marco Mayer
Educator for Forex and Futures, Systematic Trader, and
Creator of Ambush Trading Method, Ambush Signals, and AlgoStrats.com
Traders want to trade. That’s what we feel is our job and that’s when we feel that we’re actually really doing something. And I think that’s why it can be so tough to go through periods of low trade frequency. It just somehow doesn’t feel right. Might be missing out on something. For sure the markets keep on moving and others are trading, right?
But feelings are often misleading, especially when it comes to trading. The fact is that to know when to not take a trade is as important as to know when to put on a trade and be active in the markets.
Whatever approach you’re using to trade in the markets, there is always a time when that approach will actually not give you an advantage in the markets.
That’s why most trading systems have some kind of a market regime filter that defines when to actually follow a signal or not. That filter might measure volatility, check if there’s an up- or downtrend going on or look for periods where the market is not trending at all. Other kinds of filters are limiting trading to certain trading hours or specific weekdays or certain regular news events.
Without these filters, without these periods of standing on the sideline and not trading, it’s very hard to make money in the long run. As whatever money you’ve made during the time when the market was in sync with your trading style, you’ll probably give most of it back if you stubbornly keep on trading when the market is not. One exception that comes to my mind is long term trend following where you simply cannot afford to ever miss a trade and where filtering trades can be very expensive.
But in general, knowing when not to trade and then do exactly that is actually an edge. If you keep on trading all the time, you will on average lose money during these periods where you should not trade. And to avoid a losing trade is at the end of the day as good as having a winning trade. The only difference is that it just doesn’t feel that way. Taking a trade and making $1000 feels like you did something, you see that trade on your daily account statement. If you skip a losing trade, you might not even notice that you just saved yourself from a $1000 loss, and it actually doesn’t even show up in your trade history. Still, you now have $1000 more than you would have otherwise. So remember that and be patient during times of low trade frequency.
Happy Trading!
Marco
© by Marco Mayer. Re-transmission or reproduction of any part of this material is strictly prohibited without the prior written consent of Trading Educators, Inc.
Trading Article - Emotions in Context
by Master Trader Joe Ross
Author, Trader, Trading Mentor, and Founder of Trading Educators, Inc.
When you put your money on the line, it's hard to avoid getting a little emotional. Beginning traders may be especially prone to experience a roller-coaster ride of emotions, feeling euphoric after a winning streak, yet disappointed after a string of losses.
How well do you handle emotions? Winning traders control their emotions. They don't let their emotions control them. But emotions don't happen in a vacuum. How emotional you feel depends on the context in which you experience emotions. For example, market conditions matter. When the markets seemed to go up in the late 1990s with no end on the horizon, it was easier to stay calm. But after the bubble burst in 2000, many traders learned how hard trading can become. Take the story of a young trader named Bozo. I spoke with him about once a year for three years. His emotional life changed over time, depending on market conditions and his experience with the markets.
At one point in time, stock prices increased with little resistance. Back then, Bozo saw himself as a relatively unemotional trader. He said, "It takes a lot to shake me up. Even if I do have one of those bad days, it just doesn't hurt that bad because I know that I'll probably make it up." It was easy to stay unemotional back then, but after a while things changed.
I asked Bozo about his emotional life a year later after the market had fallen: "The days that I lose a lot are the days that I am too greedy. Maybe I'll have one bad trade in the morning, then I'll be down, and it is frustrating. And then I'll just want to climb my way out. My worst days always start out like that. Then I'll just dig my hole a little deeper all day long. Those are my worst days. That will usually carry over until at least one more day. By then, though, I realize what I did wrong the day before. I take smaller positions at first and just try to get myself a little bit in the positive. I'm fine if I just end up making four or five hundred bucks that day because I'm just slowly climbing my way out of the hole I dug the day before. I'm not out to recapture my losses in one day." With regard to the previous year, Bozo observed, "I get more frustrated than I used to, obviously just because it didn't used to matter so much when I was making money because I knew that I could make it back."
Bozo continued to be introspective about his emotions. One year later, in 2002, when the markets were relatively flat, I asked him what he observed. "To make me realize whether or not I was emotional, I had to go through hard times with trading. I think it's crazy how the market can take you from a high to a low, and back to a high and then back to a low. You think you've got it all worked out, and then six months later, you're thinking of finding a new job. What I realized is that when I'm doing okay, I'm totally unemotional when it comes to trading, like when a new trading strategy has been working. I just sit there and have a good time. Even if I have a bad trade, it doesn't bother me. But when I was having trouble, like earlier this year and late last year, when I was only able to keep my head barely above water, it was really frustrating. I guess that's when you learn more about how emotional you are when it comes to the market. I'm not the kind of guy who is going to throw my keyboard around, but it definitely has a psychological impact on the rest of my day."
Experienced traders say that trading the markets reveals your true nature. You learn how you react to stress and how you react to failure. Over time, Bozo learned more about his emotional life. He went from thinking he was unemotional to thinking that his emotional life was more complicated and depended on his experience and current market conditions. When asked to summarize his emotional experience, Bozo said, "Obviously, when you're doing better, it's much easier to relax and trade. I now see that I can't say I'm always an unemotional trader. It all depends on how I'm doing. I've heard that if you were to see most successful traders who have been trading for 20 years, you couldn't tell if they had a good day or a bad day. They are supposedly that unemotional. You read that all the time. But I have a hard time believing it. Let's see how they would feel after eight months of losses."
© by Joe Ross. Re-transmission or reproduction of any part of this material is strictly prohibited without the prior written consent of Trading Educators, Inc.
Instant Income Guaranteed - EWW Trade
Developer: Joe Ross
Administration and New Developments: Philippe Gautier
On 29th January 2017 we gave our IIG subscribers the following trade on EWW (iShares MSCI Mexico ETF), which was in an established uptrend on the daily chart. We decided to sell price insurance as follows:
- On 30th January 2017, we sold to open EWW Mar 17 2017 39P @ $0.25, ie. $25 per option sold, with 47 days to expiration, and our short strike below a major support zone, about 14% below price action.
- On 10th February 2017, we bought to close EWW Mar 17, 2017 39P @ $0.07, after 11 days in the trade, for quick premium compounding.
Profit: $18 per option
Margin: $780
Return on Margin annualized: 76.57%
This trade was pretty safe.
We have also added new types of trades for our IIG daily guidance, "no loss" propositions with unlimited upside potential, still using other people's money to trade.
Philippe
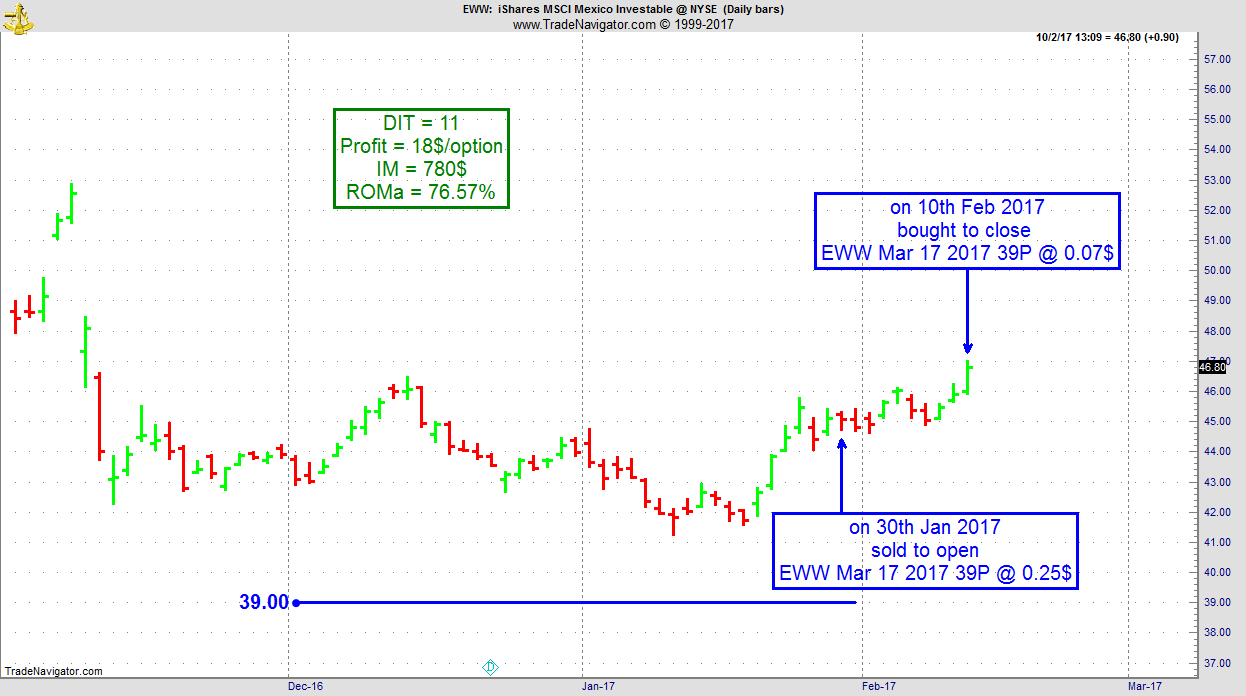
Receive daily trade recommendations - we do the research for you!
Instant Income Guaranteed
♦ SIGN UP TODAY! THIS IS WORTH THE INVESTMENT ♦
Check out our Blog!
To view previous published Chart Scan newsletters, please log in or click on "Join Us,"
shown above, to subscribe to our free "Members Only" section.
A WEALTH OF INFORMATION & EDUCATION:
Joe Ross-Trading Educators' popular free Chart Scan Newsletter has been published since 2004.
Note: Unless otherwise noted, all charts used in Chart Scan commentary were created
by using Genesis Financial Technologies' Trade Navigator (with permission).
Legal Notice and Copyright 2017 Disclaimer - Published by Trading Educators, Inc.
Chart Scan is a complimentary educational newsletter.
© by Trading Educators, Inc. Re-transmission or reproduction of any part of this material is strictly prohibited without prior written consent.
Edition 661 - February 10, 2017

Chart Scan - Where do I put the Stop?
by Master Trader Joe Ross
Author, Trader, Trading Mentor, and Founder of Trading Educators, Inc.
How much can you risk psychologically, emotionally, and financially before taking a loss that will put you into the fetal position, sucking your thumb in a catatonic state of existence?
Once you know how much risk you can stand to take, you can then begin to consider which time frame you should trade. You must match the risk you are personally willing to take with the amount of risk in the market.
Let’s say you are willing to risk $300 per contract. Does it make sense to risk $300/contract using a monthly chart? How about a weekly or daily chart? Do you see where I’m going with this? You need to choose a time frame in which the average risk/trade is around $300 or less.
How do you determine the amount of risk in the market and time frame you wish to use? There are several ways to do it.
You could use Wilder’s Volatility Stop Study, which would show you graphically where to place the stop. You could curve-fit a moving average to the chart, and then look to see the amount of risk you would be taking if the moving average were to be hit. You could test to see on average how much prices move against you based on the setup you are using.
For example: Let’s say you love to trade outside reversal bars (engulfing reversals for you candle heads). You could go back to look at the last 45 times you had an outside reversal in the market and time frame of your choice, to see on average how much prices move against you after you buy 1 tick (pip) above the high, or after you sell 1 tick (pip) below the low.
The main thing is to match your risk tolerance to the risk in the market. If the risk is too high, move to a shorter time frame. If the risk is too low, move to a greater time frame.
The chart below shows using Wilder’s Volatility Stop.
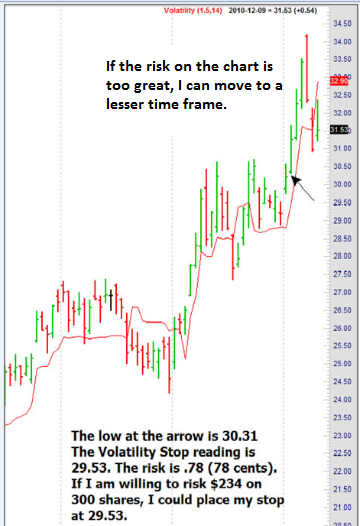
The chart above is a the price chart of a stock. Of course I can do the same thing with futures, or forex, or even CFDs. I simply move the time frames up or down until I find a match to my risk tolerance. Four bars later, I would have been stopped out of the trade where the risk was 74 cents. So I would have to subtract 74 cents/share from whatever unrealized profit I had in the trade. Actually I made this trade, using a Traders Trick Entry, at a price of 28.38, and exited at 29.53 for a profits of $1.15/share. There is another way I could have done it; those of you who have taken private tutoring or attended one of my seminars should know what else I could have done.
© by Joe Ross. Re-transmission or reproduction of any part of this material is strictly prohibited without the prior written consent of Trading Educators, Inc.
Trading Article - About Change
by Master Trader Joe Ross
Author, Trader, Trading Mentor, and Founder of Trading Educators, Inc.
People don't want to be changed. They don't want to be told that they need to change. Do you ever find yourself struggling in those areas? Thank you for your honesty. If there is a struggle, that means there is a battle for truth. If you're not battling, you've already lost. Truth has been lost and deceit has won.
We must come to a place where we are willing to unclothe our soul, ultimately, completely. And it's the hardest battle there is. It's doable. You can do it. Anyone can do it if they want to badly enough. It's doable. It is just that not all people really want it. Not all people are willing to be taught. People come to me all the time, years, I'm talking about decades of seeking success and people will come to me and say to me, "Please mentor me. Help me know how to trade the markets so that I can be profitable. Please mentor me." And in the past I would often say, "Okay. I'll teach what I know, that's all I can give."
But you know what I learned? I learned that people don't want to change. People don't want to be told that they have to change. People resent being corrected. Do you know anyone like that? It's understandable, right? It's not easy to be corrected. Yet experience shows that life as a trader is a life of correction. So whereas you may know people that don't want to be corrected, the fact is, if you are going to trade successfully you are going to have to learn how to receive correction. It's really the hardest part, what I'm giving you right now. It's the hardest part. Everyone wants to think that they are lovable just the way they are, and maybe they are lovable just the way they are but that's not going to necessarily help the real deep things that hide in your soul that will destroy true success. We can't like ourselves too much. Do you understand what I am saying? You know what to do, now do it! That’s a correction, by the way.
What will be your response? Will you turn and walk away?
If a person is rich in their self-love, do not like correction, loves trading, loves markets, and maybe have a great intensity – in the eyes of other traders, that person may be highly prized, but what is hidden deep in the recesses of the heart is “I love who I am, what I am, what I want. I don't like to be corrected. I don't like to be challenged, to be changed. I don't like those kinds of messages.”
How many of you know what that feels like? But the fact of the matter is if you really want success you have to come back to the center and the center has to be changed from pride to humility. When that happens, things inside of you will change. Maybe even some of the old things that are so deep you never thought they could be changed.
If you are not willing to be corrected, if you're not willing to take off the old, how can you put on the new? How can you clothe yourself with the necessary attitude, if you're not willing to change? If you're one of those traders that always has to be right and no one can question you on it no matter how badly it's needed, you'll never have success, not ever.
© by Joe Ross. Re-transmission or reproduction of any part of this material is strictly prohibited without the prior written consent of Trading Educators, Inc.
Instant Income Guaranteed - NOV Trade
Developer: Joe Ross
Administration and New Developments: Philippe Gautier
On 30th November 2016, we gave our IIG subscribers the following trade on NOV, which was in an established uptrend on the daily chart. We decided to sell price insurance as follows:
- On 1st December 2016, we sold to open NOV Jan 20 2017 30P @ $0.20, i.e. 20$ per option sold, with 49 days to expiration, and our short strike below a major support zone, about 20% below price action.
- On 12th December 2016, we bought to close NOV Jan 20 2017 30P @ $0.05, after 11 days in the trade, for quick premium compounding.
Profit: $15 per option
Margin: $600
Return on Margin annualized: 82.95%
This trade was pretty safe in spite of overall very low implied volatility levels.
We have also added new types of trades for our IIG daily guidance, "no loss" propositions with unlimited upside potential, still using other people's money to trade (see recent EWZ example in Newsletter Edition 649).
Philippe
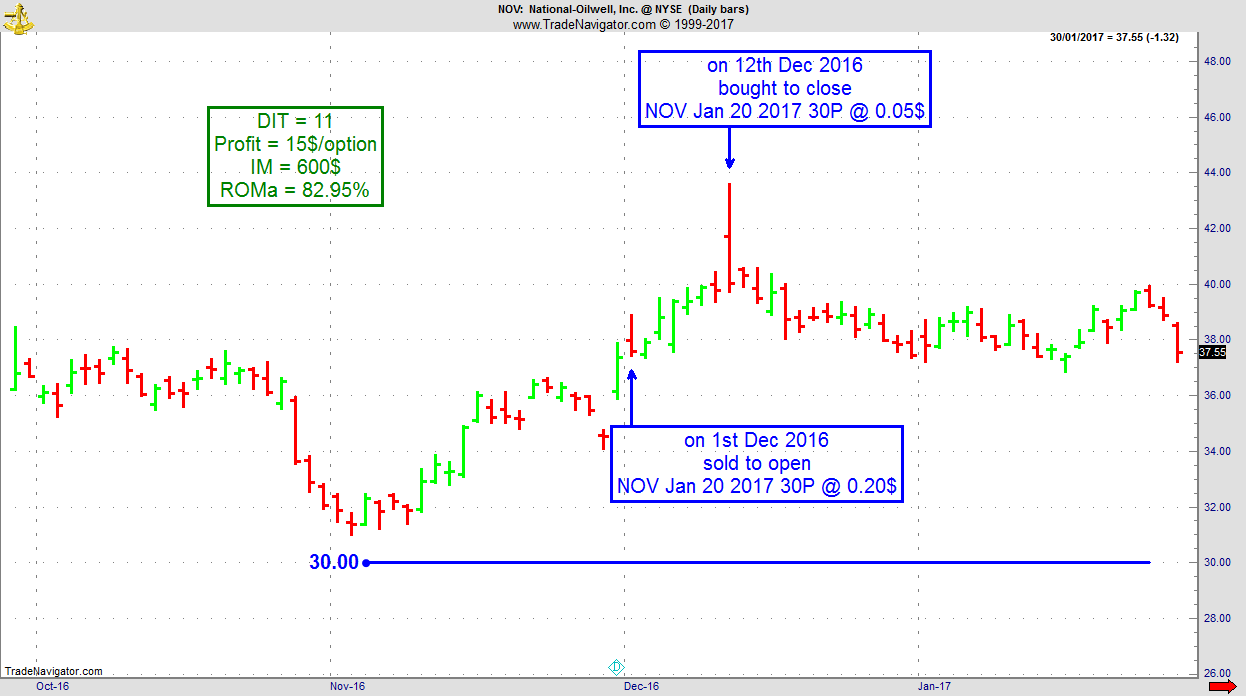
Receive daily trade recommendations - we do the research for you!
Instant Income Guaranteed
♦ SIGN UP TODAY! THIS IS WORTH THE INVESTMENT ♦
Ambush Trading Natural Gas back to new Equity Highs!
by Professional Trader Marco Mayer
Educator for Forex and Futures, Systematic Trader, and
Creator of Ambush Trading Method, Ambush Signals, and AlgoStrats.com
The Natural Gas Future is one of the favorite markets of Ambush Traders. And so for a good reason. Its performance has been very stable over the years and drawdowns tend to get recovered quickly.
But even trading Natural Gas there are times when it can get bumpy trading Ambush. And as we just experienced one of these periods, I thought this might be a good time to have a look at some statistics regarding Drawdowns.
Now Drawdowns are not what traders want to hear or even think about. And this probably isn’t the best way to advertise a product. But it’s a very important one and it’s what you should think about before starting to trade. What can go wrong? What kind of pain will you have to endure? Can you make it through that?
Let’s start with the equity curve. First of all, the results here assume we’re trading one contract all the time, pay $5 commissions per round-turn and get 1/2 tick slippage on any non-limit order.
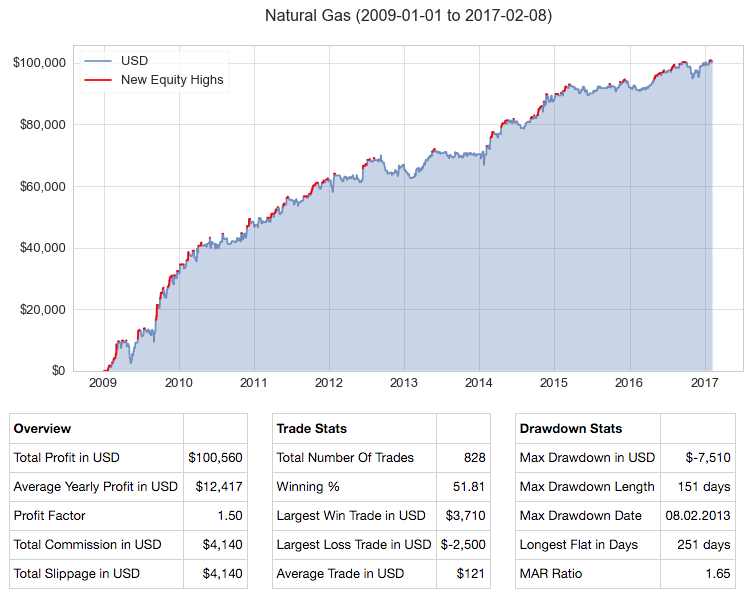
On the chart every new equity high is marked red and as you can see we just made new all time equity highs in NG. Another thing to notice is that new highs happen quite often compared to other strategies. During 2016 we had a huge draw-up period making lots of new equity highs.
One of the most useful metrics to measure the impact of drawdowns is the MAR Ratio. It takes the average yearly profit (usually compounded in %, in our case, it’s not compounded as we’re always trading 1 contract) and divides it by the maximum drawdown. Which means, the higher the number, the better. If it’s above 1 that’s a good sign, and anything above 1.5 is really good. In our case, we got a MAR Ratio of 1.65, so the average yearly profit ($12.5k) is 1.65 times the maximum drawdown (-$7.5k). Which means to make those $12.5k on average a year, you’d have to endure a drawdown of about -$7.5k sometime in between. Sounds like a very good deal, doesn’t it? If it doesn’t then trading maybe isn’t the right business for you. No pain, no gain.
Now let’s have a more detailed look at the drawdowns:
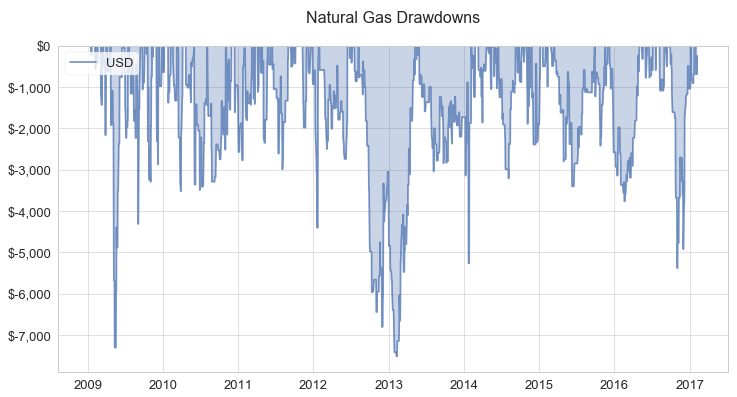
This gives you a pretty good idea what you’ll have to make it through on a regular basis (up to -$3k drawdowns), sometimes (up to -$5k drawdowns) and the two worst cases that don’t happen often but you better are aware that they could (up to -$7.5k drawdowns).
So what happened at the end of 2016 was ugly, but not that unusual. Also, notice how quickly these drawdowns tend to recover (with the exception of 2013).
Again this is not what most traders want to think about. It’s so much more fun to think about the $12k profits a year per contract! But the day will come when you’ll be much better off to have thought this through. To be prepared when the shit hits the fan, and it will sooner or later. Then this kind of knowledge is what helps you to now throw in the towel at exactly the wrong time, to keep on trading, keep on pushing through and to make it to the next equity highs!
How to reduce drawdowns? The wrong path would be to try and somehow filter out these losing periods. That’s going to work in the backtest, but not in real trading. The best way to reduce drawdowns is to diversify. Trade more than one market. Trade more than one system. That’s what will make that MAR ratio go above 2 and higher.
Happy Trading!
Marco
Become an Ambush Trader today!
Two Easy Ways:
- Buy the Ambush eBook and learn all about how the method works and set everything up yourself.
OR
- Join Ambush Signals and simply get access to the daily Ambush Signals for all of the supported Futures markets. This way you can follow Ambush without having to go through the hassle of setting up charts, indicators, or taking care of getting the right data and so on.
© by Marco Mayer. Re-transmission or reproduction of any part of this material is strictly prohibited without the prior written consent of Trading Educators, Inc.
Blog Post - How to Approach Trading? Part 1
by Professional Trader Andy Jordan
Educator for Spreads, Options, Swing/Day Trading, and
Editor of Traders Notebook Complete and Traders Notebook Outrights
To develop a trading plan is the key to your trading success. Read more.
Traders Notebook Complete had its most profitable year in 2016!
Learn how to manage this trade by getting daily detailed trading instructions, click here.
Andy is offering a FREE 2 Week Trial - Sign up before February 11th
Yes, sign me up!
© by Andy Jordan. Re-transmission or reproduction of any part of this material is strictly prohibited without the prior written consent of Trading Educators, Inc.
Check out our Blog!
To view previous published Chart Scan newsletters, please log in or click on "Join Us,"
shown above, to subscribe to our free "Members Only" section.
A WEALTH OF INFORMATION & EDUCATION:
Joe Ross-Trading Educators' popular free Chart Scan Newsletter has been published since 2004.
Note: Unless otherwise noted, all charts used in Chart Scan commentary were created
by using Genesis Financial Technologies' Trade Navigator (with permission).
Legal Notice and Copyright 2017 Disclaimer - Published by Trading Educators, Inc.
Chart Scan is a complimentary educational newsletter.
© by Trading Educators, Inc. Re-transmission or reproduction of any part of this material is strictly prohibited without prior written consent.
More...
Edition 660 - February 3, 2017
Trading Idea - Short May 2017 Soybeans Puts
by Professional Trader Andy Jordan
Educator for Spreads, Options, Swing/Day Trading, and
Editor of Traders Notebook Complete and Traders Notebook Outrights
As you can see on the chart below the May 2017 Soybeans are in a long term up-trend since August/September 2016. Both seasonal charts (the blue 15 year and the red 5 year) a looking very strong for the next few months and this might help to drive Soybeans even higher. Therefore, selling May 2017 puts seems to be a good strategy for us as long as the May Soybeans are not dropping below the 1000 level.
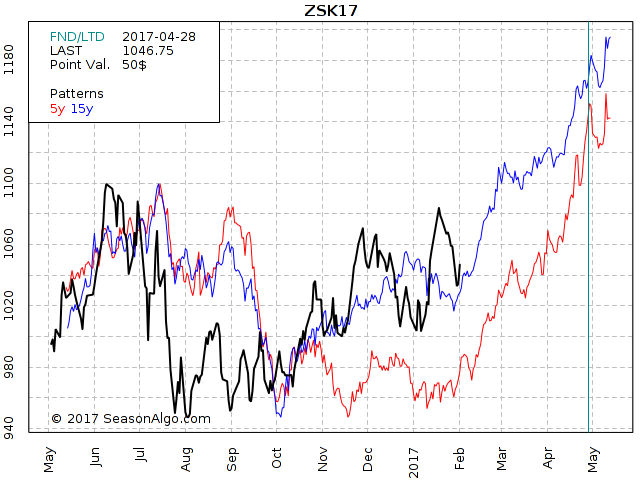
Traders Notebook Complete
Learn how to manage this trade by getting daily detailed trading instructions, click here!
Andy is offering a FREE 2 Week Trial - Sign up before February 11th
Yes, sign me up!
© by Andy Jordan. Re-transmission or reproduction of any part of this material is strictly prohibited without the prior written consent of Trading Educators, Inc.
Trading Article: The Well-Chosen Example
by Professional Trader Marco Mayer
Educator for Forex and Futures, Systematic Trader, and
Creator of Ambush Trading Method, Ambush Signals, and AlgoStrats.com
A fallacy you should be vividly aware of in the trading world is the well-chosen example. This comes in all kinds of forms but the most popular one is to show a single trade or a couple of trades on a chart and point out some really nice winning trades.
Here's one I ran into a few days ago. This was sent out to promote a trading education service:
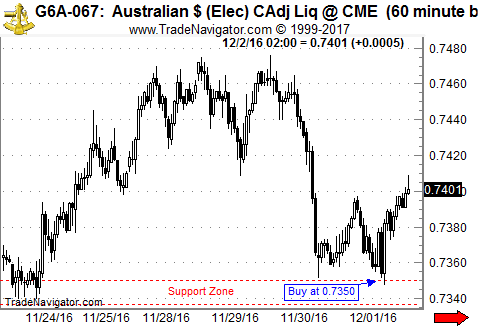
So yes that trade really worked out nicely huh? Bought down there right at the bottom, very tight stop and then got a quite nice rally out of it. Took profits of about two times the initial risk!
What they didn't show are the other 2 price levels they had suggested. In these cases, the Australian Dollar just traded through the levels:
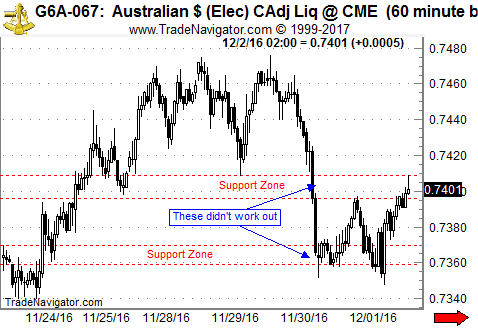
So actually there’ve been 3 trades on that day with a total result of barely breaking even.
And there’s no problem with this. Doesn’t mean that service or that their strategy is not good or at least somehow useful. What I want to point out here is simply this tendency in the trading industry to show the well-chosen examples. Obviously, that’s simply how marketing works, and there’s nothing wrong with that, just something to be aware of.
Once you’re aware of that you can start asking the right questions: "I’ve seen your sample trade in the Australian Dollar, nice one! Makes me really curious and I’d love to learn more about your performance. Can you send me a record of all the trades you did in this market using that strategy over the last 5 years? Or across all currency markets? If so, please let me know if it does include trading costs (commissions/slippage) and if it is based on real trades or just simulated results?"
If you hear back from them you can start to investigate and get a better idea of their potential edge in the markets. A single chart of an equity curve of 5 years of trading tells you much more than looking at 100 single trade sample charts. If you don’t hear back, you can save your time and move on.
Another popular "trick" of the same fallacy you should be aware of is whenever you see the result of a trading account. Especially if it’s on one of the popular social trading platforms. Might even be a small real money account. The trick goes like this: "Open up 10 accounts and put a couple of positions on one account, but do the opposite on the other one. Go crazy with your risk, doesn’t matter if you blow up an account. Repeat until out of the 10 accounts you’ll just by chance probably have at least one that survived and now looks really great. If not simply repeat starting with 10 new accounts." This works especially well for strategies that use very tight profit targets and no or very wide stops. As the odds of short-term profit are very high here anyway, doing this on multiple accounts you’ll surely have one that shows a very nice equity curve.
What you’ll see on their website is the result of that one account that did really well during the last few months. But you won’t learn about or about what happened to the other 9 accounts.
Happy Trading!
Marco
© by Marco Mayer. Re-transmission or reproduction of any part of this material is strictly prohibited without the prior written consent of Trading Educators, Inc.
DON'T FORGET TO VOTE!
Marco Mayer has been nominated for the "Forex Best Awards 2017" over at FxStreet.com for his educational Forex content. We are pleased and honored to have him as a part of our trading team and feel he deserves such an Award. This is your chance to show your support for Marco and all the free articles, blog posts and videos he provides on a regular basis. It'll only take a minute, no email or registration required. Go to the following link, https://www.surveymonkey.com/r/forexbestawards2017-Nominees, and if you don't know any of the other guys, just click through using "don't know" until page 4 of the survey. On page 4, select Marco Mayer's article (third on the list) and proceed to page 7 to vote for Marco again, and finish the survey.
Thank you!

Chart Scan - Exiting a Trade
by Master Trader Joe Ross
Author, Trader, Trading Mentor, and Founder of Trading Educators, Inc.
One of the requests made from a Chart Scan subscriber was about exiting from the market. In general, any signal that would cause you to enter a market in one direction should signal you to exit a market if you have entered it from the opposite direction. However, there is often more to it than that.
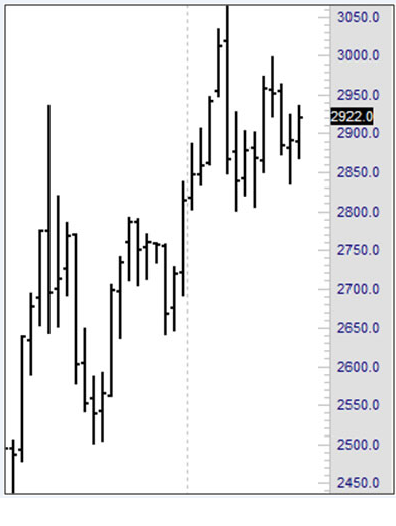
Let’s say you have held a long position, and you are wondering when or if you should exit. Let’s also say that one of your entry signals is a breakout of support. In other words, had you not been long, and were perhaps waiting for prices to drop, you would sell short if the support line was violated.
There are then things you can do:
You can exit on a Close below support, or, since a violation of support is an entry signal for you, you could reverse your long position and sell short.
There is still another idea to be considered, and that is how long do you want to stay in a trade that is going nowhere? As we look at the chart we see that prices are definitely in a consolidation, which at TE we call congestion (11-20 bars with no real trend). In fact, the last 8 bars have all either opened, closed, or both inside the range of a measuring bar—that large bar that made the high of the recent move.
Might it not be better to take your money out now and wait for further developments? The margin you have tied up in the silver trade could be making you money in a market that is trending. It is a rare occasion that you end up getting every cent of an uptrend from bottom to top.
There is still another consideration which derives from the fundamentals for any market. You have to weigh the costs of getting out now against the costs of not staying in, if you believe that prices will go much higher.
The job of a trader is to make these kinds of decisions. There is still one more thing to consider: how does the trade “feel” to you? Are you comfortable staying in? Or would you be much more comfortable getting out, counting your money, and planning to get back into the market in whichever direction prices actually move.
© by Joe Ross. Re-transmission or reproduction of any part of this material is strictly prohibited without the prior written consent of Trading Educators, Inc.
Trading Article - Searching for a Winning Strategy
by Master Trader Joe Ross
Author, Trader, Trading Mentor, and Founder of Trading Educators, Inc.
Winning traders must identify profitable trading strategies. It's a creative process. Much like scientists find evidence to support a theory, traders must formulate hypotheses and determine whether their proposed strategy can produce a profit. You must sift through a wealth of information, mentally testing and retesting your hypothesis and trying to decide if it will work when the ideal market conditions are present.
In searching for a winning strategy, there comes a point when you start to believe that you're right. At some point, you must stop deliberating whether or not to go with a particular strategy, and make a final decision. But you don't want to jump in too early. On the other hand, you don't want to consider and reconsider your strategy so long that you miss a market move. The key is discerning when to stop deliberating and when to take action.
If you're like many traders, however, you've made your share of bad decisions. Psychologists have studied the thought processes that go into making decisions, such as determining whether a trading strategy will work or fail. It's a two-stage process, according. When evaluating a strategy, there's a point where you start to believe that it is true; in other words, you believe that your view of the markets is accurate and you'll make a profit if you use the strategy. That is the first stage of the decision making process, believing that you are right. The second stage consists of determining whether or not you are actually right. The human mind seems to work in a peculiar way. In order to fully understand and mull over a hypothesis, we must first believe it is true, even if it is actually false. After we accept the hypothesis as true, we then go through a process of thinking and re-thinking the hypothesis before finally deciding if our initial acceptance of the hypothesis was a prudent decision.
For example, if you decided that a product announcement was going to produce a dramatic price increase in a company's stock next week, you first accept that you're right, Stage 1 of the thinking process. By accepting you are right, you build up the motivation to further study your hypothesis and decide if you are in fact right. It makes sense when you think about it. If you thought that your hypothesis was wrong, you would just forget about it and move on. You might see how problems may arise in the way the mind works.
What if you decided your strategy was right, but then stopped deliberating, instead of continuing to question whether or not you made a good decision? If you stop too soon, and avoid Stage 2 of the thinking process, you'll continually jump to the wrong conclusion and erroneously implement unprofitable trading strategies. It's important that you think and rethink the strategy a little while longer. You must play Devil's Advocate and think about what might go wrong. For instance, a product announcement won't lead to a profit if media analysts report that the product will be a dismal failure. You must do a little extra research to decide if there is evidence of an unexpected event that may ruin your plan.
People often forget to fully evaluate their initial decisions. Why? Research studies have shown that when people are under time pressure, or tired and worn out, they do not fully deliberate their decisions. In other words, they engage in Stage 1 thinking, they accept that their hypothesis is true, but they avoid Stage 2 thinking; they assume their initial hunch is right without fully considering evidence that may refute its veracity.
When making a trading decision, fully deliberating your alternatives is essential. You don't want to over-deliberate, but you don't want to be impulsive. Don't rush the decision making process. Slow down, and realize your limitations. When you are overloaded with too much information to sift through, or you are just too tired to think straight, you will make an impulsive judgment. Make sure you are rested and relaxed. By staying psychologically alert, you'll increase the odds of choosing winning trading strategies.
© by Joe Ross. Re-transmission or reproduction of any part of this material is strictly prohibited without the prior written consent of Trading Educators, Inc.
Instant Income Guaranteed - KBH Trade
Developer: Joe Ross
Administration and New Developments: Philippe Gautier
With implied volatility at the lowest level since we started IIG daily guidance, it is much more difficult to find safe trades with sufficient premium levels, but it is still possible.
On 12th January 2017, we gave our IIG subscribers the following trade on KBH, which was in a trading range on the daily chart. We decided to sell price insurance as follows:
- On 13th January 2017, we sold to open KBH Feb 17, 2017 14P @ $0.10, i.e. $10 per option sold, with 34 days to expiration, and our short strike at a major support zone, about 16% below price action.
- On 24th January 2017, we bought to close KBH Feb 17, 2017 14P @ $0.04, after 11 days in the trade, for quick premium compounding
Profit for one contract: $6
Margin: $280
Return on Margin annualized: 45.63%
This trade was suitable for very small accounts due to the very low level of margin.
We have also added new types of trades for our IIG daily guidance, "no loss" propositions with unlimited upside potential, still using other people's money to trade (see recent EWZ and X recent examples).
Philippe
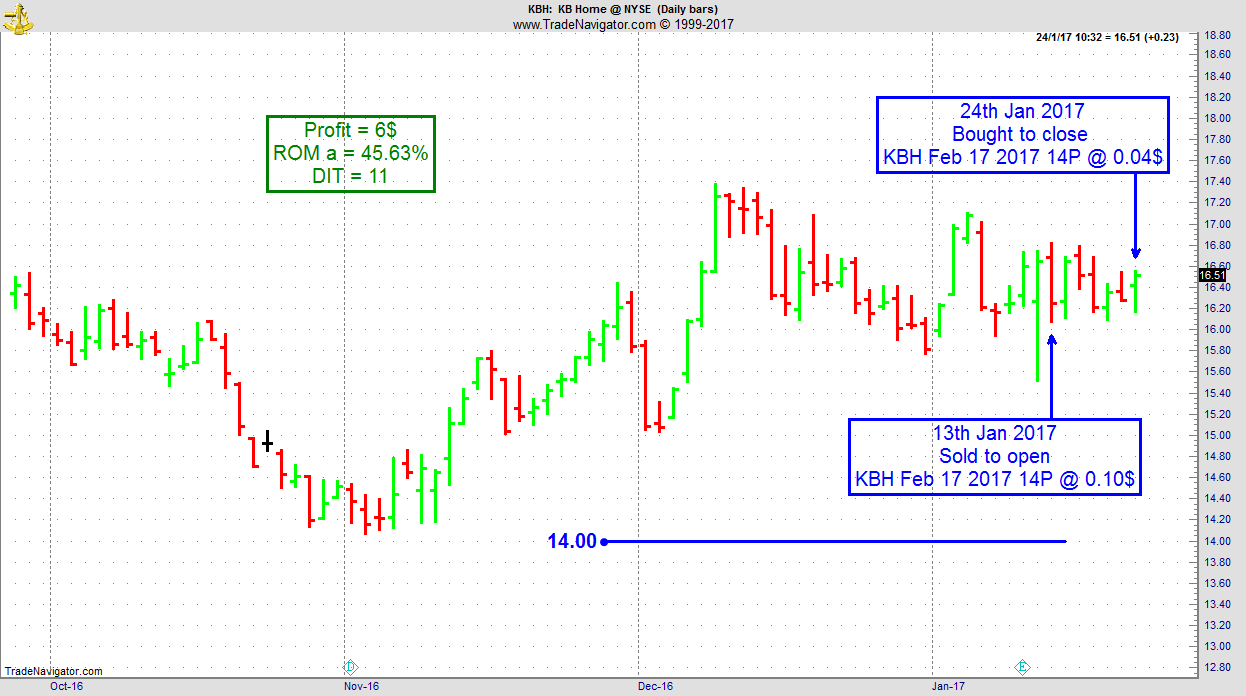
Receive daily trade recommendations - we do the research for you!
Instant Income Guaranteed
♦ SIGN UP TODAY! THIS IS WORTH THE INVESTMENT ♦
Check out our Blog!
To view previous published Chart Scan newsletters, please log in or click on "Join Us,"
shown above, to subscribe to our free "Members Only" section.
A WEALTH OF INFORMATION & EDUCATION:
Joe Ross-Trading Educators' popular free Chart Scan Newsletter has been published since 2004.
Note: Unless otherwise noted, all charts used in Chart Scan commentary were created
by using Genesis Financial Technologies' Trade Navigator (with permission).
Legal Notice and Copyright 2017 Disclaimer - Published by Trading Educators, Inc.
Chart Scan is a complimentary educational newsletter.
© by Trading Educators, Inc. Re-transmission or reproduction of any part of this material is strictly prohibited without prior written consent.
Edition 658 - January 20, 2017

The Law of Charts with Commentary
by Master Trader Joe Ross
Author, Trader, Trading Mentor, and Founder of Trading Educators, Inc.
WHAT SHOULD YOU TRADE?
During my private tutoring and recorded webinar, I prove to my students that what I teach can be used in any market and in any time frame.
People write to me to tell me, "All I want to trade is a 5-minute E-mini S&P 500 chart."
But why? Why would anyone want to restrict himself to one market and one time frame? There is no market in the world that is always good for trading in a single time frame. You need to look around to see exactly which markets and time frames are best suited to your personality, comfort level, account size, and current market conditions.
In fact, at Trading Educators, we are likely to trade a different market every day, and if it is the same market, we don't necessarily trade it in the same time frame as we did the previous day. The reason for that is that we want the best possible setups for the way we like to trade.
There are times when you can do just as well in the Russell 2000 ETF as you can do trading the E-mini Russell 2000 futures. Have you ever tried to trade the Norwegian Krone in the futures market? There's practically no liquidity. But you can trade it as USDNOK in the forex market as seen on the chart below. If you wanted to be short the krone, you can go long USDNOK.
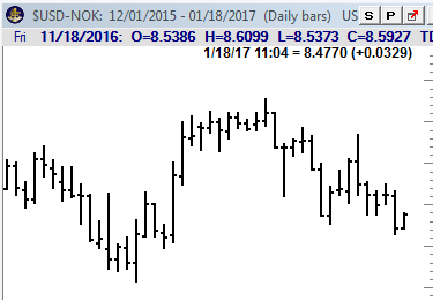
Too many traders have tunnel vision. All they can see is one market and one single time frame. Trading that way is a great way to get killed. But if you truly learn how to trade; if you truly understand The Law of Charts; if you really understand market dynamics, and the correct approach to the markets, you can trade wherever and whenever the trading is best.
© by Joe Ross. Re-transmission or reproduction of any part of this material is strictly prohibited without the prior written consent of Trading Educators, Inc.
Trading Article - Conquering Passivity
by Master Trader Joe Ross
Author, Trader, Trading Mentor, and Founder of Trading Educators, Inc.
Winning traders take decisive action. The decisions you have to make to put on winning trades are crucial to success. Where do you enter? When do you exit? How much risk will you take? Each of these questions must be addressed quickly and with strong resolution. But not all traders can make the right decision at critical moments of investing. Passivity often sets in. It can take on many forms from failing to pull the trigger to holding onto a losing trade. Sometimes, actually taking action is a form of passivity. For instance, rather than actively letting a winning trade fully come to fruition, a passive trader may close out a position early to lock in profits and avoid the unpleasant feeling of embracing and accepting uncertainty. There may be three types of passive traders: Cautious, fearful, and insecure. If one of these types is descriptive of you, consider learning how to conquer passivity by gaining awareness of the psychological mechanisms that lie beneath it.
Cautious traders are passive in an attempt to avoid risk. They obsess over any possible flaw in their trading plan. They try to seek out perfect trading information in a fruitless attempt to control the inherent uncertainty of the markets. Many times, their thorough search for all pertinent sources of information is merely an excuse for not taking on risk. But information is never fully complete. When you are trading, you are taking a risk, and you must accept the fact that no amount of perfectionism or caution will guarantee success. All that cautious traders end up doing is failing to take action.
A second type of passive trader is the fearful trader. Fearful traders don't trade to win. They constantly try to avoid losing. It's not a very satisfying way to trade. You might say, their need to avoid loss "leads to a sense of quiet desperation." Rather than enthusiastically trading the markets, and expecting success, they passively wait for their doom, which they think is inevitable. Your destiny is never set, however. By taking an active approach to trading, you'll increase the odds of realizing huge payoffs.
Insecure traders are passive because they continually seek approval. Insecure traders seek out acceptance and reassurance. They can't make a decision independently and spend hours gathering the opinions of others, and hope that other people can make key decisions for them. Their primary intention is to avoid responsibility. If someone else were the impetus for their decision, then it's never their fault when the trade goes sour. It's always someone else's fault. By putting the blame on others, the insecure trader is able to avoid facing his or her limitations. A grandiose self-view can be maintained. But looking toward others and avoiding an honest look at your abilities will lead to stagnation. Trading requires action, and fully engaging in trading activities requires a full awareness of what you're doing. You must actively look inward to your own intuitive sense of the market action and trust what your instinct tells you. Only when you are fully committed to looking at the market through your senses, and fully accepting your experience on its own terms can you trade freely, creatively and profitably.
In the end, there are no guarantees. You must take risks. The key is to find the proper balance. Risks can motivate you, but they can also overwhelm. By finding a level of risk that motivates you, but does not overwhelm you, you will stay energized and be ready to actively trade the markets rather than allow profits to pass by.
© by Joe Ross. Re-transmission or reproduction of any part of this material is strictly prohibited without the prior written consent of Trading Educators, Inc.
Instant Income Guaranteed - X Trade
Developer: Joe Ross
Administration and New Developments: Philippe Gautier
On 9th June 2016, we gave our subscribers a new type of trade on US Steel (X), which was showing accumulation on a pullback on the weekly chart.
We entered a "complex position", entered for a net credit (still working with OPM, i.e. other people's money, as usual), but with unlimited upside potential.
- On 10th June 2016, we entered the trade for a credit of $1.70 (or $170 per position).
- On 9th November 2016, we took partial profits on our long position.
- On 7th December 2016, we took new partial profits on our long position and closed our short position.
Profit: $470
Margin: $1,240
Return on Margin annualized: 176.09%
But this is only part of the story. As part of our profit maximizing strategy on these long term trades, we still have one long call position left, with a zero cost price, an extra open profit of around $1,200, and about one year left to play out.
These are low maintenance, low stress trades with lots of upside potential.
We presently have 19 of these trades opened.
Philippe
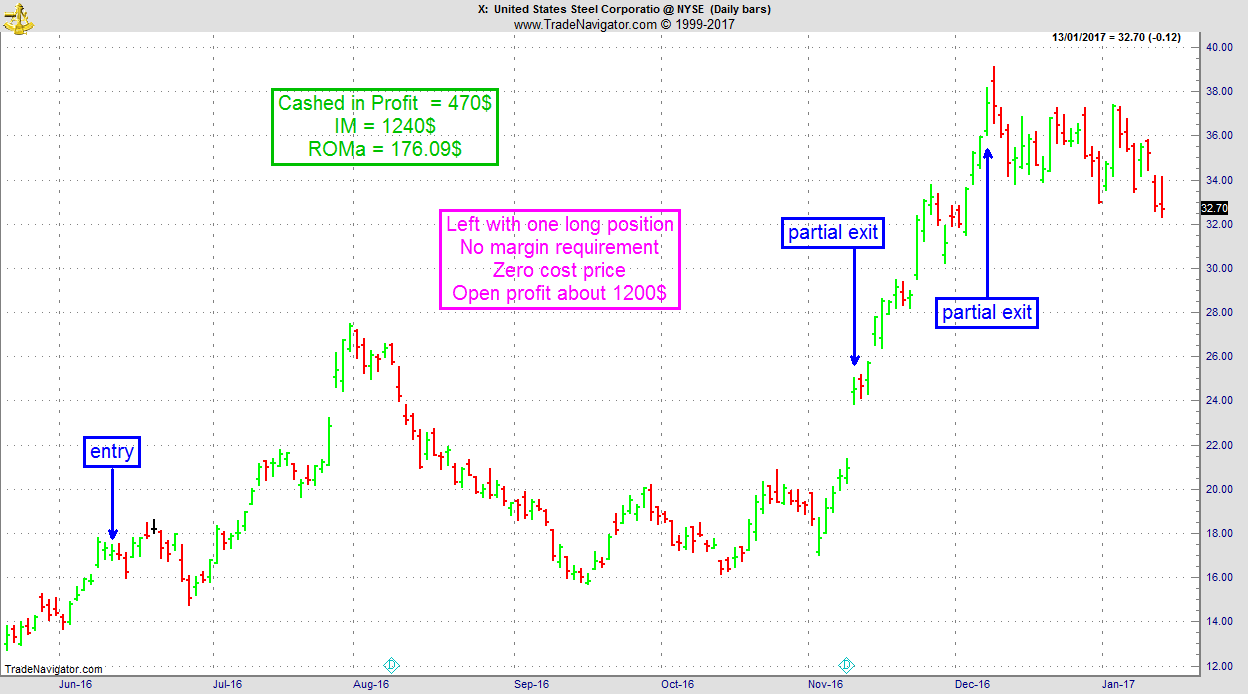
Receive daily trade recommendations - we do the research for you!
Instant Income Guaranteed
♦ SIGN UP TODAY! THIS IS WORTH THE INVESTMENT ♦
Trading Idea - GFJ17+ZCK17-2xLEQ17
by Professional Trader Andy Jordan
Educator for Spreads, Options, Swing/Day Trading, and
Editor of Traders Notebook Complete and Traders Notebook Outrights
Today I am looking at a very “strange” butterfly spread: Long 1 April Feeder Cattle and one May Corn and short 2 Live Cattle August.
I have to admit that it is difficult to find an entry into this trade by looking for chart patterns, but it is easy to see the possible support around the current level. Okay, the spread moved a bit lower in July last year but this happened when there was not enough volume in all 3 legs of the spread. Since then, the spread stayed above -$500 on a close basis. Unfortunately, there is no way to trade this spread as a single contract and we need to “leg in” into each leg separately. I would also give this spread enough room to develop and therefore a risk of about $1,000 - $1,500 per butterfly seems to be necessary.
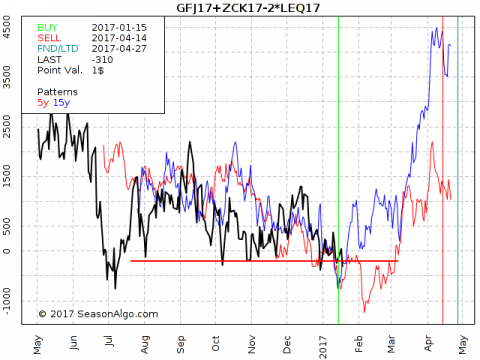
© by Andy Jordan. Re-transmission or reproduction of any part of this material is strictly prohibited without the prior written consent of Trading Educators, Inc.
Trading Article - Indicators: Good or Bad?
by Master Trader Marco Mayer
Educator for Forex and Futures, Systematic Trader, and
Creator of Ambush Trading Method, Ambush Signals, and AlgoStrats.com
One of the most commonly discussed trading topics is whether indicators are good or bad. Should a trader use them or is it just a distraction that doesn’t add anything to the "pure" price-action you can see on a simple price chart?
The answer is that making a war of opinions out of anything related to trading and thinking in terms of "good" or "bad" is kind of silly. Remember, we’re talking about trading here, not about where you can get the best Burgers, which is the best soccer team or some other question of preferences. Trading is about making money, so it’s important to ask the right objective questions and for these, there usually are objective answers.
Does the indicator you’re looking at give you an edge in the markets or not? Or if it’s an indicator supposed to provide you a specific information in an easier way, does it do its job and make your life as a trader easier?
If it does it would be crazy to not use it. An indicator is nothing else than some kind of transformation/representation of whatever data you put in there and how you’d like to see it. The same can be said about OHLC charts. If you want it really pure then you should look only at tick data as an OHLC price bar is just a summary of that.
So don’t get fooled by the "Price Action is the only way!" crowd. Of their patterns, you can ask the very same question: "Does the shown price pattern provide an edge, yes or no? If the answer is no, and that is, unfortunately, the truth for most price patterns and indicators out there, then just forget about it and move on. Again this isn’t about a question of what appeals to you or not. It’s about whether it makes you money or not.
The truth is that any indicator is only as useful as the trader’s knowledge about the indicator. Obviously just randomly adding a couple of indicators to a chart isn’t going to be helpful. You should understand pretty well what an indicator actually does, how it works and what that number it spits out tells you. Otherwise, it’s going to be very hard to know when and how to use it. Most indicators „work“ only under certain conditions. But the very same thing can be said about any price pattern out there. If you blindly trade it without having done any testing on whether it provides you can edge or not in the market/timeframe/conditions you want to trade it, you can as well use any arbitrary indicator out there!
As a systematic trader, I use a lot of indicators in one way or the other. Most of them are indicators I came up with on my own to make my life as a trader easier. Others tell me whether a certain price pattern is there or not. But I know exactly how each indicator works and what it’s actually useful for. Whether it’s indicating some OHLC based price pattern or providing some measurement of volatility that might not be that easy to recognize by just looking at a price chart.
Happy Trading!
Marco
© by Marco Mayer. Re-transmission or reproduction of any part of this material is strictly prohibited without the prior written consent of Trading Educators, Inc.
Check out our Blog!
To view previous published Chart Scan newsletters, please log in or click on "Join Us,"
shown above, to subscribe to our free "Members Only" section.
A WEALTH OF INFORMATION & EDUCATION:
Joe Ross-Trading Educators' popular free Chart Scan Newsletter has been published since 2004.
Note: Unless otherwise noted, all charts used in Chart Scan commentary were created
by using Genesis Financial Technologies' Trade Navigator (with permission).
Legal Notice and Copyright 2017 Disclaimer - Published by Trading Educators, Inc.
Chart Scan is a complimentary educational newsletter.
© by Trading Educators, Inc. Re-transmission or reproduction of any part of this material is strictly prohibited without prior written consent.
Edition 657 - January 13, 2017

Ambush Trading Method - Performance Update
by Master Trader Marco Mayer
Educator for Forex and Futures, Systematic Trader, and
Creator of Ambush Trading Method, Ambush Signals, and AlgoStrats.com
As we’re heading into 2017, I thought it was a good time to reflect on the trading performance of Ambush in 2016.
To do so, let’s look at the performance of the Ambush All Stars Small Portfolio consisting of:
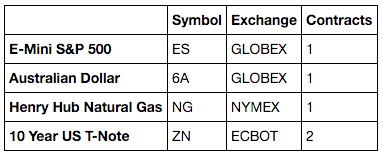
The following Performance Report includes trading costs of $5 commissions round turn and 1/2-tick slippage per market order. We’re assuming to get 1-tick slippage on 50% of all executed stop-market or market orders, and of course, no slippage on limit-orders.
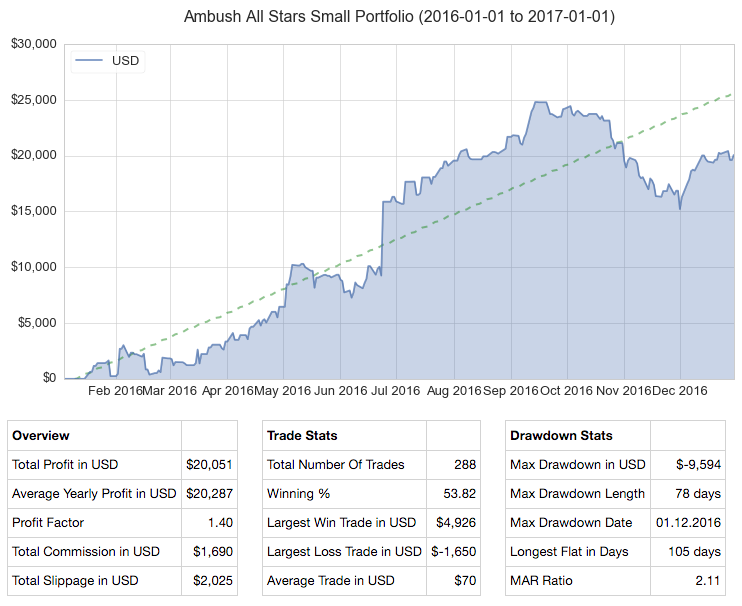
Now, there’s not much to say about that performance report. 2016 has simply been an exceptional year for Ambush traders and all performance metrics look just as a trader would wish for. Out of 12 months there have been only 2 losing months (October/November). The resulting drawdown of these two happening in a row wasn’t very nice, but compared to the overall profits of the year, it was still very moderate. This gives us a MAR Ratio of over 2 which is still excellent.
You can learn more about Ambush and Ambush Signals on the Ambush Signals Website.
Watch my short presentation to find out more about Ambush Signals.
Join Marco Mayer - Ambush Signals!
© by Marco Mayer. Re-transmission or reproduction of any part of this material is strictly prohibited without the prior written consent of Trading Educators, Inc.
Trading Article - Do Something Else!
by Professional Trader Andy Jordan
Educator for Spreads, Options, Swing/Day Trading, and
Editor of Traders Notebook Complete and Traders Notebook Outrights
You need to find other things to do while padding the time waiting for better trades. Try to study the markets or different ways of trading, or simply do something completely different like going to the beach. It is critical that you learn to enjoy yourself in ways other than being in a trade.
The fact is, if you are trading in a professional way, you are out of the market much of time. So you need to think of ways to fill this time. Trading is not a full-time job where a person works 8 hours a day. Also, trading doesn't get better by trading more. The opposite is often the case.
When you are not satisfied with your trading, try to reduce the number of trades instead of putting on more trades. This might help to move your trading to a higher level and you might get better results.
© by Andy Jordan. Re-transmission or reproduction of any part of this material is strictly prohibited without the prior written consent of Trading Educators, Inc.
The Law of Charts with Commentary
by Master Trader Joe Ross
Author, Trader, Trading Mentor, and Founder of Trading Educators, Inc.
Spreads
The years go by quickly. Seems like yesterday that I presented a webinar for the CBOT, in which I showed how to stay in a trend using the Volatility Stop Study (VSS).
The market I used was CBOT gold. Since that time, gold has dramatically changed, but what I want to show hasn’t changed at all.
One person wrote to me doubting that I could have used the VSS to get into the gold uptrend until it was too late. That was not at all true. I submit that it is quite possible to have used VSS in conjunction with The Law of Charts to get into and out of the gold trend, but also to have used VSS along with The Law of Charts to get into and remain with the gold downtrend.
Furthermore, there was no need to change the VSS parameters in order to make use of a combination of The Law of Charts, the Traders Trick Entry (TTE), and the VSS. The long entry into the uptrend could have been made in several places. For example, the breakout from the trading range could have been set lower. There was a Ross hook (first failure to move higher after a breakout from consolidation) lower than the Ross hook that gave the TTE shown for long entry. The chart below tells the whole story.
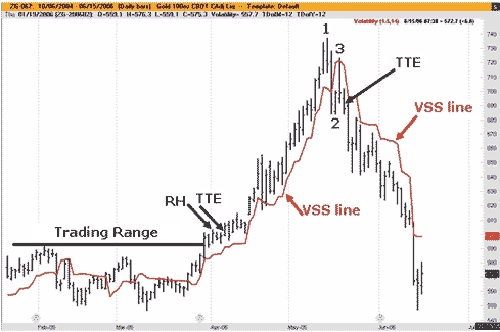
© by Joe Ross. Re-transmission or reproduction of any part of this material is strictly prohibited without the prior written consent of Trading Educators, Inc.
Trading Article - Support and Resistance
by Master Trader Joe Ross
Author, Trader, Trading Mentor, and Founder of Trading Educators, Inc.
I received a couple of emails asking whether or not I believe in support and resistance. In fact, one subscriber said if I didn't believe in support and resistance, then I couldn't possibly believe in trend! Why? Because in all cases the situation ends.
Here's what I believe: The trend is your friend until the end. The swing is the thing until it goes "ding."
What is support and what is resistance? Are those not simply convenient terms to describe an area of fair value? Prices bounce off of those areas of so-called support and they bounce off of areas of so-called resistance. Why? Because temporarily no one is willing to sell for less than "support" and no one is willing to pay more than "resistance." "Support" and "resistance" are equally as mythological as "trend." Why do I say that?
Every market is in a trading range between the highest price it ever achieved (resistance) and the lowest price it ever reached (support). So what is all that stuff in-between? Can we call the junk in between "support" and "resistance?" What are trends and swings? Are they not simply connectors connecting the temporary areas of fair value? So-called support areas fail to support, are broken, and are connected to a lower fair value area by a swing or trend. So-called resistance areas fail to resist, are broken, and are connected to a higher fair value area by a swing or trend.
Trend lines and swing lines are also broken, and lead to areas of fair value, where prices chop sideways for awhile. So, what's the bottom line of all this clap-trap about support, resistance, swings, and trends?
As far as I'm concerned, the only thing that counts is whether or not you have found a way to make money from any of this. If you are able to make money when prices bounce off of so-called support and resistance, then congratulations, you have probably made it as a trader. If you have found a way to make money from trends or swings, or have found a way to make money from broken trend or swing lines, then you deserve praise and are well on your way, or have already succeeded as a trader. The rest is just a mincing of words — semantics. Support, resistance, trend, swing — all are nothing more than ways to identify what prices appear to be doing. Any one of them can see the beginning of the end with the next price bar. If you tell me prices are at support, I will probably know what you mean. That is all the word "support" is good for! If you tell me prices are at "resistance," I will probably know what you mean. The same thing is true for the words "trend" and "swing" — I will probably know what you mean. We will have found a common way to communicate to one another as to the condition and location of prices.
Do I believe in support, resistance, trends, and swings? The answer is no! I do not believe in any of it. What I do believe, most of the time, are the numbers on the statement of my trading account. If they are getting bigger, then I am winning.
© by Joe Ross. Re-transmission or reproduction of any part of this material is strictly prohibited without the prior written consent of Trading Educators, Inc.
Instant Income Guaranteed - VLO Trade
Developer: Joe Ross
Administration and New Developments: Philippe Gautier
On 25th Oct 2016, we gave our IIG subscribers the following trade on VLO, for which we expected a retracement. We decided to sell price insurance as follows (we were filled on a GTC order on 2nd Nov 2016 at our minimum price):
We entered a "complex position" for a net credit (still working with OPM, i.e. other people's money, as usual), but with unlimited upside potential.
- On 2nd November 2016, we sold to open VLO Dec 16, 2016 50P @ $0.45, i.e. $45 per option sold, with 44 days to expiration, and our short strike below a major support zone, about 13% below price action.
- On 9th November 2016, we bought to close VLO Dec 16, 2016 50P @ $0.20, after 7 days in the trade, for quick premium compounding
Profit: $25
Margin: $1,000
Return on Margin annualized: 130.36%
We have also added new types of trades for our IIG daily guidance, "no loss" propositions with unlimited upside potential, still using other people's money to trade (see recent EWZ example in Newsletter Edition 649, log in to our members only area).
Philippe
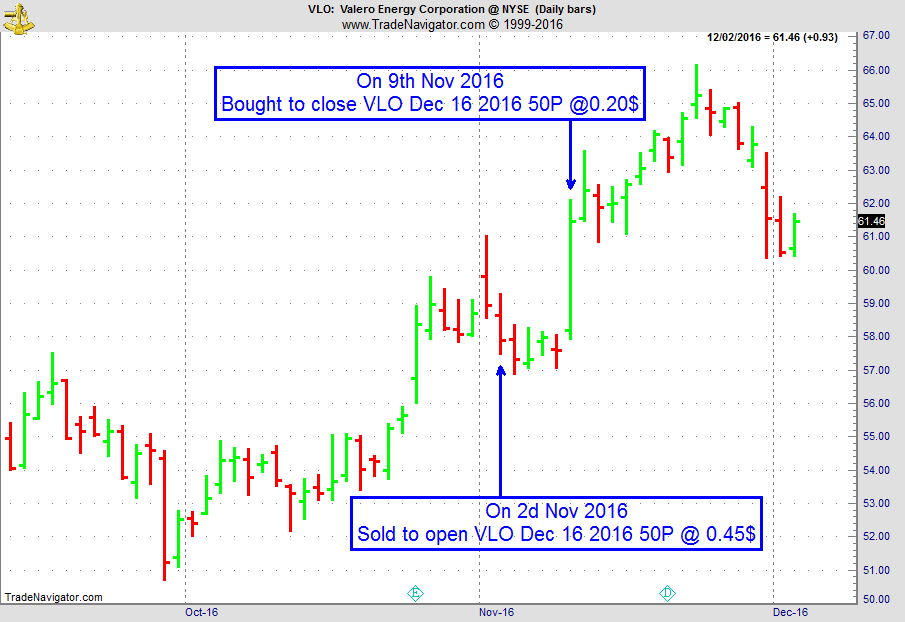
Receive daily trade recommendations - we do the research for you!
Instant Income Guaranteed
♦ SIGN UP TODAY! THIS IS WORTH THE INVESTMENT ♦
Check out our Blog!
To view previous published Chart Scan newsletters, please log in or click on "Join Us,"
shown above, to subscribe to our free "Members Only" section.
A WEALTH OF INFORMATION & EDUCATION:
Joe Ross-Trading Educators' popular free Chart Scan Newsletter has been published since 2004.
Note: Unless otherwise noted, all charts used in Chart Scan commentary were created
by using Genesis Financial Technologies' Trade Navigator (with permission).
Legal Notice and Copyright 2017 Disclaimer - Published by Trading Educators, Inc.
Chart Scan is a complimentary educational newsletter.
© by Trading Educators, Inc. Re-transmission or reproduction of any part of this material is strictly prohibited without prior written consent.
Edition 656 - January 6, 2017
“We all get the exact same 365 days. The only difference is what we do with them.” – Hillary DePiano
Start your year off right with a free EBook "A Trader's Musings: A compliation Of Observations, Thoughts and Lessons From Over 50 Years of Trading" by Joe Ross. It's available at Amazon for free from January 6th through January 8th. Click here to get your copy. If you don't have a Kindle, you can download a free app.
Trading Idea - Cotton Butterfly -CTH17+2CTK7-CTN17
by Professional Trader Andy Jordan
Educator for Spreads, Options, Swing/Day Trading, and
Editor of Traders Notebook Complete and Traders Notebook Outrights
While outright futures in the so called “Softs” are usually difficult to trade, I like to trade spreads because they usually behave less “crazy”. Today I want to look into a Cotton Butterfly shown on the seasonal chart below. At the first look the spread looks kind of wild but at a closer look you might notice only the big moves, like the down move from November into January really matter in terms of US$. All the rest is just noise. The spread is also following its seasonal patter nicely and the seasonal up-move right in front of us looks promising.
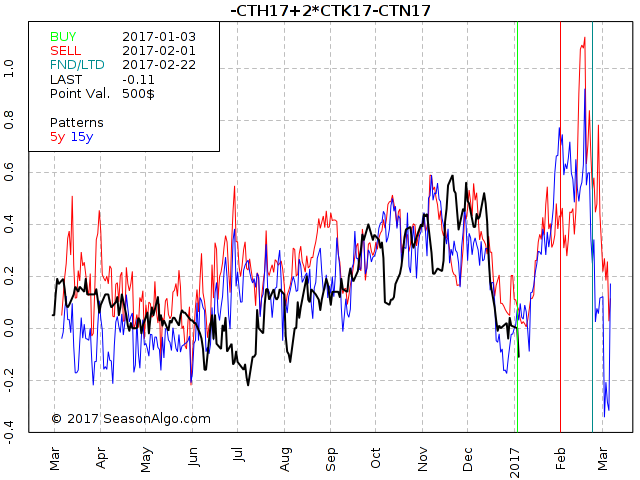
If you want to know how we trade this spread in Traders Notebook, please follow the link below. There is a special deal available for the ones new to our Newsletter.
Yes, show me how you do it, click here!
© by Andy Jordan. Re-transmission or reproduction of any part of this material is strictly prohibited without the prior written consent of Trading Educators, Inc.
Trading Article -Why You Can Still Lose Money Winning 99% of Your Trades
by Master Trader Marco Mayer
Educator for Forex and Futures, Systematic Trader, and
Creator of Ambush Trading Method, Ambush Signals, and AlgoStrats.com
I’m sure you’ve all seen advertisements of trading systems that have 95% winning trades. And traders tend to get all excited when they see a high win rate. But while having a high win rate is nice, it can also be a very misleading performance metric.
The winning rate tells you how much percent of the trades in a backtest (or real past trades) have been winning trades. So if you have 100 trades in total, and 75 of those trades closed with a profit, you have a winning rate of 75%. Now the first thing to notice here is how those winning trades are defined. Are breakeven-trades included? What about commissions? If you have 100% winning trades in the E-Mini Dow Future and each of those trades was closed at 1 tick profit ($5) and you pay $7.50 per round turn, you actually lost money even if you hit your profit target 100% of the time.
Which leads us to the next fact. And that is that without knowing how much money was made on the winning trades vs. the losing trades, the winning rate is completely useless. Here’s an extreme example. Let’s say you have 90 out of 100 winning trades, a winning rate of 90%. Sounds great right? But what if on average you had an average profit of $100 per winning trade ($100 x 90 = $9000) but an average loss of 1000$ per losing trade ($1000 x 10 = $10000)? Right you have lost $1000 even with a winning rate of 90%. Of course this also works the other way around, if you only have 10% winners, but those are 10 times the size of your 90% losing trades, you’ll come out ahead!
Here things get interesting from a psychological point of view. Most traders are not ready to trade a strategy that only wins just 10 out of 100 times. Even if it’s numbers look amazing in the long run and it’s a really good system. Most traders simply can’t deal with this as it’s going to have long flat periods and you can easily have 10 and often 20 or more small losing trades in a row.
On the other side usually the drawdowns will be much steeper trading a system with a high win rate. When it finally hits those big losing trades, months of profits can be destroyed within a single day.
So to sum this up, the winning % is a key number to watch out for but it’s far less important than most traders think and without additional information completely useless. So you shouldn’t get all excited if you see a very high winning rate right away.
All of the 99% winning trade systems that try to capture a few pips on each trade I’ve seen in the past have blown up sooner or later. And any such systems that will come up in the future will end up in the same way. It’s always a ticking time bomb and the longer it’s been running and making money - the higher the odds are it will implode soon.
Happy Trading!
Marco
© by Marco Mayer. Re-transmission or reproduction of any part of this material is strictly prohibited without the prior written consent of Trading Educators, Inc.
The Law of Charts with Commentary
by Master Trader Joe Ross
Author, Trader, Trading Mentor, and Founder of Trading Educators, Inc.
Time Independent Charts
There is something I want to point out about trading methods. Very often you have to be discretionary when trading them. For example, we discovered that with one of the methods we used to use, 100% of the time the method made 2 1/2 - 3 points per contract very soon after entry. To use the method you had to do as we suggested and take something out of the trade as soon as you could. That meant trading at least 2 contracts—one for a short-term objective and the other to stay with the trade as long as possible.
Every method comes with a stated objective; however, discretion dictated that it was advisable to take some profit out of the trade as soon as it was possible to see at least 100 (it was up to the trader as to the amount). That way a trader was being paid to trade.
We told method users to not let greed overcome them by trying to get the stated objective every time.
During the time the method was working I took a trade in corn. The trade lost if I would have stayed in until I was stopped out. But there was ample opportunity to have taken something out of the trade. Discretion is what makes a method different from a mechanical trading system. When you know that a high percentage of the time you can make 125-150 dollars from the circumstances that created the trade entry, then isn't it wise to ensure that you are paid to trade? Take some profit and move your stop to breakeven. If you are stopped out, you will still be profitable or have mitigated any loss.
The long entry (a) was at 260 dollars. Prices moved as high as 263.50 dollars, i.e. 3.5 points = 175 dollars /contract before being stopped out at breakeven the same day. If I stayed in, this amount of profit or slightly less was available on 2 consecutive trading days.
The short entry (c) was at 252.50 dollars. Prices moved as low as 248.50 dollars after entry that same day; 4 points = 200 dollars before being stopped out the following day on a gap open at 250.50 dollars. The net gain available was 2 points = 100 dollars. If I stayed in, there was still another opportunity to have come out of the trade with a nice profit. The following day prices gapped down and 4 1/2 points = 225 dollars were available. Taking something there and moving my stop to breakeven would have avoided suffering a loss on the trade.
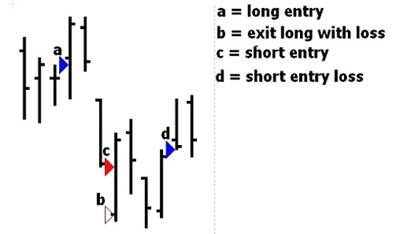
© by Joe Ross. Re-transmission or reproduction of any part of this material is strictly prohibited without the prior written consent of Trading Educators, Inc.
Trading Article - Chess and Trading. What do you think?
by Master Trader Joe Ross
Author, Trader, Trading Mentor, and Founder of Trading Educators, Inc.
Although I haven't the faintest idea of how to play chess, it certainly seems like a great idea. I imagine you can improve stock and futures trading by learning how to play chess. It might also help to develop an interest in physics. Every trader should learn to develop his problem-solving and pattern recognition abilities. I’ve been told that nothing does this better than learning how to play chess. Some of the first computer algorithms were designed to play chess. Just as chess taught the computer how to think, it seems likely chess can teach traders how to think more logically and effectively. Chess is something that might be taught in the first grade through high school in all schools to help children develop problem-solving abilities, and to create self-confidence and self-reliance. Chess, when taught to under-privileged children, was responsible for the greatest overall grade improvement for all students on all levels. Of course no one knows for sure what the social impact of such a plan might be. What about the kid who really has trouble seeing ahead; kids who have dyslexia like me? Pattern recognition is the key to understanding bar chart structure. Variations of similar patterns are constantly occurring in the markets. Prices move either up or down 100% of the time. Truly, prices do not move sideways. Markets move sideways, not prices. If a price moves, it is either up or down. Sideways for the market indicates virtually all price movement within a certain range. A key to correct technical analysis is simplicity; breaking the market down to its basic price structures for comparisons of highs, lows, opens and closes within various time periods. Profitable trading can be derived from recognition of simple recurring price patterns based on the action, reaction, and interaction of market perception.
© by Joe Ross. Re-transmission or reproduction of any part of this material is strictly prohibited without the prior written consent of Trading Educators, Inc.
Receive daily trade recommendations - we do the research for you!
Instant Income Guaranteed
♦ SIGN UP TODAY! THIS IS WORTH THE INVESTMENT ♦
Check out our Blog!
To view previous published Chart Scan newsletters, please log in or click on "Join Us,"
shown above, to subscribe to our free "Members Only" section.
A WEALTH OF INFORMATION & EDUCATION:
Joe Ross-Trading Educators' popular free Chart Scan Newsletter has been published since 2004.
Note: Unless otherwise noted, all charts used in Chart Scan commentary were created
by using Genesis Financial Technologies' Trade Navigator (with permission).
Legal Notice and Copyright 2017 Disclaimer - Published by Trading Educators, Inc.
Chart Scan is a complimentary educational newsletter.
© by Trading Educators, Inc. Re-transmission or reproduction of any part of this material is strictly prohibited without prior written consent.

