

Newsletters (208)
Children categories
Edition 698 - October 27, 2017


Trading Article - Don’t be stubborn in trading!
by Professional Trader Marco Mayer
Educator for Forex and Futures, Systematic Trader, and
Creator of Ambush Trading Method, Ambush Signals, and AlgoStrats.com
I recently found myself in a day trade in USD/CAD that I’d like to talk about. The exact reason for my entry actually doesn't matter for this article but the idea was to buy the pair at a support level where I expected it to at least temporarily bounce off nicely. The best case outcome for this trade was that it would hit my profit target that I had set shortly after the entry. It would give me a nice profit of more than two times my risk and I set it at a price where I was expecting the potential rally to run into sellers again.
For sure I’ve been lucky with this one as shortly after the entry the market rallied nicely straight up for hours without any significant corrections. So the next morning (entry happened during the night) I was pleasantly surprised that USD/CAD was already approaching my profit target, see below on the first chart the market looked like at that point in time.

USD/CAD was just about 7 pips short of reaching my profit target while my stop-loss was still at the initial stop loss level. I think I’ve read a similar story in one of the market wizards books, but in a summary, the situation was like this. The market was trading very close to my profit target that I had set because I expected sellers around that price level. At the same time, the trade could still turn into a full loss as I hadn’t moved my stop loss.
So, in other words, the potential for further profits was just about 7 pips while my risk was about 53 pips! That’s when you simply cannot be stubborn in a discretionary trade, you got to act!
As this had been such a nice, stress-free rally to that point and I’ve been already so close to the profit target I decided to simply take my money and run. I just got out at the market.
If the profit target had been slightly further away I might have chosen another option. Go down to a lower timeframe and use a tight trailing stop to either get stopped out with a nice profit or have the market run into the profit target.
On the right chart, you can see what happened after that. The rally fizzled and USD/CAD plummeted. So don’t be stubborn in trading!
Happy trading,
Marco
Feel free to email Marco with any questions, This email address is being protected from spambots. You need JavaScript enabled to view it..
© by Marco Mayer. Re-transmission or reproduction of any part of this material is strictly prohibited without the prior written consent of Trading Educators, Inc.

Chart Scan with Commentary - Consolidation Part 4
by Master Trader Joe Ross
Author, Trader, Trading Mentor, and Founder of Trading Educators, Inc.
Developer of Instant Income Guaranteed
In this issue of Chart Scan and in the next, I will be showing you a couple of confirming ways to trade sideways markets. I think you’ll find them interesting.
First, we must have a rule. We can trade in a consolidation only if the height of the consolidation is equal to or greater in dollars than the exchange minimum margin for entering the trade, or the exchange maintenance margin for holding overnight, at the time we realize the market has entered into the consolidation. The choice is yours.
As with all rules, there are exceptions. If a market has great volatility, we can use 1/2 the exchange minimum margin, or 1/2 the maintenance margin. Again, the choice is yours.
My example for this study is the seen on the daily T-Bond chart below. It could have been any market. A market is the market, and a chart is a chart. I'll be switching between two programs because I need to utilize two different studies. Unfortunately, I do not have them both in the same software.
The margin for the T-Bond was $1,620 and the maintenance margin was $1,200. The high of the consolidation was 108^06 and the low was 104^16, for a height of 3^22, which is equal to $3,687.50 — more than enough to meet our rule. In fact, the height was more than enough to meet our rule for great volatility: 1/2 the exchange minimum margin.
Let's get a bird’s eye view of how the bonds dropped into a consolidation area.

Next week we will do some measuring and draw some definitive lines on this chart. For now, let’s see where we can begin counting the consolidation so far.
We must ask: “which bar or Close of which bar most represents the vertical center of the consolidation?”
108 6/32 – 104 16/32 = 3 22/32
Divided by 2 = 1 27/32
1 27/32 + 104 16/32 = 106 11/32
The halfway mark of the consolidation is 106^11.
To be continued...
© by Joe Ross. Re-transmission or reproduction of any part of this material is strictly prohibited without the prior written consent of Trading Educators, Inc.
Trading Article - Selecting Stocks
by Master Trader Joe Ross
Author, Trader, Trading Mentor, and Founder of Trading Educators, Inc.
Developer of Instant Income Guaranteed
Stock book values, Price-Earnings Ratios, and stock dividends are not the fundamentals that determine a stock's price trend. Strong increased earnings, preferably over the last five years, are the most bullish fundamental statistic related to the price trend of a stock.
The best P-E ratio for strong rising stocks is over 20. These stocks remain in strong bull markets about 18 months. At the end of a typical bull market move, the P-E ratio will have doubled to over 40.
Stock traders should buy stocks that have increased earnings of 50% greater over the previous quarter minimum and show a solid earnings trend on an annual basis for five years. Be prepared to buy these stocks the moment they break out to the upside on a technical basis, or buy them when they post 52-week new highs. Wal-Mart and Tyson increased over 4000% in the decade of the 1980's. Both of these Northwest Arkansas companies met the above evaluation criteria. Another way to find good stocks is through the CANSLIM method. William O'Neil gives his excellent CANSLIM method away with a free Investor's Daily trial subscription. You might want to try it.
When I was living on a mountain top in South Africa I had only end of day data. The expense of using the Internet was so prohibitive as to make anything else not worthwhile. That is when I developed my own method for selecting stocks. It was really quite simple, and it worked. I have shown it to many of my students and they have seen it work. The method is to look for Traders Trick Entries ahead of Ross Hooks in rising markets.
Here is the "magic" way I did my stock selection: I hope you are ready for this! I typed in stock symbols aa, ab, ac, ad, ae, af, etc. consecutively, until I found a stock that was making a TTE ahead of a Ross Hook. For the next stock, I began with ba, bb, bc, bd, be, bf, etc. I rarely completed a letter series before I found something that met my qualifications. Furthermore, I don't recall having to use a 3-letter symbol to get the trades I wanted. The only qualification was volume, and I insisted on 400,000 shares/day. Sometimes it was drudge work doing it, but it met my other qualification — to be able to trade from any place in the world, including a mountain top, as long as I had a telephone, a modem, and a price chart.
© by Joe Ross. Re-transmission or reproduction of any part of this material is strictly prohibited without the prior written consent of Trading Educators, Inc.

Instant Income Guaranteed - CCL Trade
Philippe Gautier: Administration and New Developments
Developer: Joe Ross
On 4th October 2017 we gave our Instant Income Guaranteed subscribers the following trade on Carnival Corporation. (CCL). We sold price insurance as follows:
- On 5th October 2017, we sold to open CCL Nov 17 2017 60P @ 0.45$, with 42 days until expiration and our short strike about 8% below price action.
- On 16th October 2017, we bought to close CCL Nov 17 2017 60P @ 0.15$, after 11 days in the trade for quick premium compounding.
Profit: $30 per option
Margin: $1,200
Return on Margin Annualized: 82.95%
We have also added new types of trades for our Instant Income Guaranteed daily guidance since 2016, "no loss" propositions with unlimited upside potential, still using other people's money to trade.
Philippe

Receive daily trade recommendations - we do the research for you!
♦ SIGN UP TODAY! THIS IS WORTH THE INVESTMENT ♦
© by Joe Ross and Philippe Gautier. Re-transmission or reproduction of any part of this material is strictly prohibited without the prior written consent of Trading Educators, Inc.

Trading Article - Be Careful to Avoid Overconfidence
by Professional Trader Andy Jordan
Educator for Spreads, Options, Swing/Day Trading, and
Editor of Traders Notebook Complete and Traders Notebook Outrights
After a good-sized win or series of wins, you may get a feeling of invincibility with regards to your trading prowess. This could last for a period of time; an invincibility that quickly dismisses from mind the prior long cold spells suffered through, what a struggle it was at the time, how much toil, trouble, and, yes, even luck, that it took.
A state of great ease and relaxation can envelop us. If you won $5,000, for instance, you might feel like, “Heck, now I can lose $1,000 or $2,000, and still be up $3,000.” This feeling of fatness could be self-fulfilling. Of course you are too smart to fall into this trap; you would see it coming.
Unless you take this warning seriously, you might very well lose that money back — at least a serious chunk of it. How am I able to say that with such certainty? Because overconfidence makes one careless. If you do not pay attention to the details and self-control that helped you win in the first place, the likelihood of continuing to be successful rapidly diminishes.
One thing is true in trading: when things are going so well that it is hard to believe what is happening, don't change the disciplines and behavior that are working for you!
© by Andy Jordan. Re-transmission or reproduction of any part of this material is strictly prohibited without the prior written consent of Trading Educators, Inc.
Check out our Blog!
To view previous published Chart Scan newsletters, please log in or click on "Join Us,"
shown above, to subscribe to our free "Members Only" section.
A WEALTH OF INFORMATION & EDUCATION:
Joe Ross-Trading Educators' popular free Chart Scan Newsletter has been published since 2004.
Note: Unless otherwise noted, all charts used in Chart Scan commentary were created
by using Genesis Financial Technologies' Trade Navigator (with permission).
Legal Notice and Copyright 2017 Disclaimer - Published by Trading Educators, Inc.
Chart Scan is a complimentary educational newsletter.
© by Trading Educators, Inc. Re-transmission or reproduction of any part of this material is strictly prohibited without prior written consent.
Edition 697 - October 20, 2017
Chart Scan with Commentary - Consolidation Part 3
by Master Trader Joe Ross
Author, Trader, Trading Mentor, and Founder of Trading Educators, Inc.
Developer of Instant Income Guaranteed
I’ve been discussing ways to spot congestion while it is still early in the game. Another way to know when you are in congestion is to see four bars with Opens, Closes, or both, inside the price range of another bar. Typically, you will see a large magnitude price bar, followed by price bars that all Open or Close within the trading range of the larger bar.
Sometimes the large bar occurs within the consolidation and is not the first bar in the series. However, the large bar usually occurs first.
This should not be surprising. I have proven over the years that some form of consolidation typically follows large magnitude bars.
A gap beyond the range of the previous bar is also a large bar move. Why? Because, in effect, prices have moved from the previous bar's close to the open of the bar following the gap. This, too, warns of an impending consolidation.
There is not enough room in this Chart Scan for me to show all the possible combinations of dojis, Open-high, Close-low bars, or Open-low, Close-high bars. Just remember that when you see these things happening, the market is in, or is about to go into, consolidation.
If these consolidation areas hook together, linked at times by single-legged trends, you then have what I call Congestion (11-20 bars) or a Trading Range (21 or more bars).

The question becomes how to trade effectively inside a sideways market. It's important for you to know, because at any time markets can and do go into prolonged consolidations — sometimes remaining in them so long that it becomes difficult to make a living without a good understanding of how to trade such markets.
In the next issue of Chart Scan we will take a look at how it might be done.
To be continued...
© by Joe Ross. Re-transmission or reproduction of any part of this material is strictly prohibited without the prior written consent of Trading Educators, Inc.
Trading Article - Setting Goals
by Master Trader Joe Ross
Author, Trader, Trading Mentor, and Founder of Trading Educators, Inc.
Developer of Instant Income Guaranteed
Here's a piece of advice: Don’t set goals too high.
A few months ago, happy Harry started trading. He read and heard that it is important to set specific goals and to try to reach them. Harry thought, "I really ought to set high goals for myself; doing that will help me to try hard. I think I'll shoot for a 20% profit per month."
But has Harry set a realistic goal? Dreams of getting rich can be a powerful motivator. However, setting unrealizable goals and then failing to meet them can demoralize Harry and actually defeat his efforts. There's a difference between high hopes and specific goals that you work to obtain, having a methodical and detailed plan.
High performance goals are not always the best goals. Harry may not have the experience or skills to reach a goal that exceeds his abilities. For example, would you try to swim the English Channel if you can't even swim two laps in a swimming pool? You have to avoid making overly high trading goals until you have the knowledge and skills to achieve them.
Nevertheless, here at Trading Educators we observe many novices making the mistake of setting their goals too high. We can understand why they do it, but we always try to dissuade them. Our culture teaches people who are ambitious to set high goals. We are taught that it is necessary to set high standards for ourselves and go out and do whatever it takes to reach them. But studies have shown that what is most important is the way you go about achieving goals.
When aspiring traders set high goals that exceed their skills, they usually fail, feel discouraged, and give up. So if you are an aspiring trader, like Harry, it may not be a good idea to immediately strive for a 20% profit per month.
If you're an aspiring trader, set yourself up to win, but don't set performance goals that are beyond your ability to achieve. Break your overall goal into specific steps, and pat yourself on the back after you succeed at each step. When you become a seasoned trader with advanced skills, you can set out to achieve your high performance goals. But in the early part of your trading career, it's in your best interest to focus on building your trading skills rather than on achieving a huge profit every month.
© by Joe Ross. Re-transmission or reproduction of any part of this material is strictly prohibited without the prior written consent of Trading Educators, Inc.

Kick back and learn while watching a webinar: Trading All Markets , Trading With More Special Set Ups , The Law of Charts In Depth , Traders Trick Advanced Concepts. You get lifetime access to watch as many times as you want, whenever you want. Use coupon code web30 when you checkout to get a 30% discount. Offer valid until 11:59 p.m., U.S. Central Time, October 25th.
Instant Income Guaranteed - NTNX Trade
Philippe Gautier: Administration and New Developments
Developer: Joe Ross
On 27th September 2017 we gave our Instant Income Guaranteed subscribers the following trade on Nutanix Inc. (NTXN). We sold price insurance as follows:
- On 28th September 2017, we sold to open NTNX Nov 17 2017 17.5P @ 0.25$, with 49 days until expiration and our short strike about 24% below price action.
- On 12th October 2017, we bought to close NTNX Nov 17 2017 17.5P @ 0.10$, after 14 days in the trade for quick premium compounding.
Profit: $15 per option
Margin: $350
Return on Margin Annualized: 111.73%
We have also added new types of trades for our Instant Income Guaranteed daily guidance since 2016, "no loss" propositions with unlimited upside potential, still using other people's money to trade.
Philippe

Receive daily trade recommendations - we do the research for you!
♦ SIGN UP TODAY! THIS IS WORTH THE INVESTMENT ♦
© by Joe Ross and Philippe Gautier. Re-transmission or reproduction of any part of this material is strictly prohibited without the prior written consent of Trading Educators, Inc.
Trading Video - What's the best time of the day to day trade EUR/USD?
by Professional Trader Marco Mayer
Educator for Forex and Futures, Systematic Trader, and
Creator of Ambush Trading Method, Ambush Signals, and AlgoStrats.com
Using a quantitative approach, Marco Mayers answers the question "What's the best time of the day to day trade the EUR/USD"?
© by Marco Mayer. Re-transmission or reproduction of any part of this material is strictly prohibited without the prior written consent of Trading Educators, Inc.
Trading Article - Don't Steam
by Professional Trader Andy Jordan
Educator for Spreads, Options, Swing/Day Trading, and
Editor of Traders Notebook Complete and Traders Notebook Outrights
“Steaming”, in poker parlance, is what happens when your queen's-up full house loses to a king's-up full house, or when your four kings lose to four aces. The term undoubtedly comes from the fact that steam begins to come out of your ears as you watch a pile of chips and money slide across the table to another player.
Because poker and trading have much in common, steaming can also happen to you in trading. Just imagine the last trade that moved perfectly into your direction right after your entry. Everything looked just fine, and you thought you would make some nice profit with this trade. But suddenly the market moved against you overnight on some bad news, and the perfect winning trade turned out to be a loser. Does this sound familiar? I'd bet it does.
But what can you do in such a situation? If possible, don't steam, which of course is easier said then done. But while the pain may be real, steaming is counterproductive. Everyone who has traded for some time recognizes that these trades are going to occur. Become annoyed. Become angry, if you must. Then forget about them. Wipe the slate clean. Resist the urge to give these occurrences a lot of emotional weight. Develop the ability to quickly reset yourself back to your normal trading, and reset your passions back to zero. The ability to go from anger and outrage to completely neutral in a very short time is a valuable skill in trading.
Use the time usually devoted to steaming to go back over the last trade in your mind to see if you missed anything. Could you have managed your trade differently? Did you put some extra money on the table that you might have saved? There is always something to be analyzed. Do it neutrally. Turn steam into analysis. Recognize that these things happen, and will balance out if you keep your balance!
© by Andy Jordan. Re-transmission or reproduction of any part of this material is strictly prohibited without the prior written consent of Trading Educators, Inc.
Check out our Blog!
To view previous published Chart Scan newsletters, please log in or click on "Join Us,"
shown above, to subscribe to our free "Members Only" section.
A WEALTH OF INFORMATION & EDUCATION:
Joe Ross-Trading Educators' popular free Chart Scan Newsletter has been published since 2004.
Note: Unless otherwise noted, all charts used in Chart Scan commentary were created
by using Genesis Financial Technologies' Trade Navigator (with permission).
Legal Notice and Copyright 2017 Disclaimer - Published by Trading Educators, Inc.
Chart Scan is a complimentary educational newsletter.
© by Trading Educators, Inc. Re-transmission or reproduction of any part of this material is strictly prohibited without prior written consent.
Edition 696 - October 13, 2017
Check out next week's newsletter for Andy Jordan's Traders Notebook special offer!
by Professional Trader Andy Jordan
Educator for Spreads, Options, Swing/Day Trading, and
Editor of Traders Notebook Complete and Traders Notebook Outrights
This week, we're looking at ZMH18 – ZMN18: long March 2018 and short July 2018 Soybean Meal (CBOT on Globex).

Today we consider a Soybean Meal calender spread: long March 2018 and short July 2018 Soybean Meal (elec. symbols: ZMH18 – ZMN18; ZMES2H8 on CQG).
As you may have noticed, we are looking at a different chart today. The chart above is a so called “Correlation Chart” showing the correlation between the current Soybean Meal spread (March 18 – July 18) and the years 82, 99, 07, and 09. The spread has been following nicely its 4 Year correlation for the last few months. Will the spread follow the correlation during the next few weeks as well? Of course, we don’t know but together with the seasonal tendency to the up-side in October (chart below, there is a good statistical chance the spread will move higher.

Do you want to see how we manage this trade and how to get detailed trading instructions every day?
Traders Notebook Complete
Please visit the following link:
Yes, I would like additional information!
Check out next week's newsletter for Andy Jordan's Traders Notebook special offer!
© by Andy Jordan. Re-transmission or reproduction of any part of this material is strictly prohibited without the prior written consent of Trading Educators, Inc.
Chart Scan with Commentary - Consolidation Part 2
by Master Trader Joe Ross
Author, Trader, Trading Mentor, and Founder of Trading Educators, Inc.
Developer of Instant Income Guaranteed
This week we continue the discussion of sideways markets we started a week ago:
A good example of sideways price action is usually seen at the end of a trend or swing. Following a 1-2-3 low formation, the probabilities favor some form of consolidation. There is a word for this type of consolidation — “accumulation.” However, consolidations following a 1-2-3 high formation are called “distribution.” Consider what you have seen on charts. How many Vee bottoms and tops have you seen compared with how many consolidating tops and bottoms form up?
What are the first clues that prices may be getting ready to consolidate? Can consolidation be spotted while it is still in the birth canal? Let’s take a look:

The question becomes how to trade effectively inside a sideways market. It's important for you to know, because at any time markets can and do go into prolonged consolidations — sometimes remaining in them so long that it becomes difficult to make a living without a good understanding of how to trade such markets.
In the next issue of Chart Scan we will take a look at how it might be done.
To be continued...
© by Joe Ross. Re-transmission or reproduction of any part of this material is strictly prohibited without the prior written consent of Trading Educators, Inc.
Trading Article - What Drives Inflation?
by Master Trader Joe Ross
Author, Trader, Trading Mentor, and Founder of Trading Educators, Inc.
Developer of Instant Income Guaranteed
If there is one factor that drives the inflation-deflation cycle, it is the effect and trend of interest rates. The bond/note market is the foundation of the stock market, and makes its existence possible. Interest rates compete with all other forms of investment for capital. When rates are rising, the stock market is less attractive because government bond and note yields are guaranteed, while stock market dividends and profits are not. Falling interest rates, which may stimulate inflation, precipitated the largest stock market increase in history. Real interest rate yield equals the inflation rate subtracted from interest rate yields. A 5% bond yield and 7% inflation rate erodes the purchasing power of money annually by two times.
Notes and bonds are not really controllable by the FED. The market pretty much decides what those will be. There is a great fallacy perpetrated by the FED which makes people think the FED controls interest rates. The truth is they don’t. All the FED ever does is to react to what is happening in the market. When the yield curve gets too far out of alignment, the Fed raises or lowers interest rates.
However, there's more. The FED does control the money supply. The FED prints money with no accountability. They create money out of thin air. With the removal of the M3 statistic, the lack of control is even more prominently displayed. The FED is almost entirely responsible for long-term inflation. If you or I were to print money with no accountability, we would be put in prison for counterfeiting. Yet the FED continues to print counterfeit money to the extent that people on fixed incomes suffer tremendously from the falling dollar. In effect, by printing tons of money the FED has devalued the dollar to the point of excess. In the last 10 years the purchasing power of the dollar has declined considerably.
© by Joe Ross. Re-transmission or reproduction of any part of this material is strictly prohibited without the prior written consent of Trading Educators, Inc.
Instant Income Guaranteed - EV Trade
Philippe Gautier: Administration and New Developments
Developer: Joe Ross
On 24th September 2017 we gave our Instant Income Guaranteed subscribers the following trade on Eaton Vance Corporation (EV). We sold price insurance as follows:
- On 25th September 2017, we sold to open EV Nov 17 2017 45P @ 0.50$, with 52 days until expiration and our short strike about 7% below price action.
- On 3rd October 2017, we bought to close EV Nov 17 2017 45P @ 0.25$, after 8 days in the trade for quick premium compounding.
Profit: $25 per option
Margin: $900
Return on Margin Annualized: 126.74%
We have also added new types of trades for our Instant Income Guaranteed daily guidance since 2016, "no loss" propositions with unlimited upside potential, still using other people's money to trade.
Philippe

Receive daily trade recommendations - we do the research for you!
♦ SIGN UP TODAY! THIS IS WORTH THE INVESTMENT ♦
© by Joe Ross and Philippe Gautier. Re-transmission or reproduction of any part of this material is strictly prohibited without the prior written consent of Trading Educators, Inc.
Trading Video - Trading Error: Averaging into a Losing Position
by Professional Trader Marco Mayer
Educator for Forex and Futures, Systematic Trader, and
Creator of Ambush Trading Method, Ambush Signals, and AlgoStrats.com
Find out the most common, deadly mistakes traders can make, and that's averaging into a losing position. Learn insights as to why this is so tempting, and why you should avoid it at all costs.
© by Marco Mayer. Re-transmission or reproduction of any part of this material is strictly prohibited without the prior written consent of Trading Educators, Inc.
Check out our Blog!
To view previous published Chart Scan newsletters, please log in or click on "Join Us,"
shown above, to subscribe to our free "Members Only" section.
A WEALTH OF INFORMATION & EDUCATION:
Joe Ross-Trading Educators' popular free Chart Scan Newsletter has been published since 2004.
Note: Unless otherwise noted, all charts used in Chart Scan commentary were created
by using Genesis Financial Technologies' Trade Navigator (with permission).
Legal Notice and Copyright 2017 Disclaimer - Published by Trading Educators, Inc.
Chart Scan is a complimentary educational newsletter.
© by Trading Educators, Inc. Re-transmission or reproduction of any part of this material is strictly prohibited without prior written consent.
Edition 695 - October 6, 2017
Chart Scan with Commentary - Consolidation Part 1
by Master Trader Joe Ross
Author, Trader, Trading Mentor, and Founder of Trading Educators, Inc.
Developer of Instant Income Guaranteed
This week we are beginning a multi-part series on trading in consolidation. I want to show you how to trade inside a consolidation. But first we need to see a few basics to build up to "how to do it."
Let's begin with a basic truth: every market is in consolidation between the highest high it ever made and the lowest low. However, within that consolidation are trends, swings, and smaller consolidations from 4-bar ledges to trading ranges extending for more than 20 bars.
To trade within a consolidation, we must know as early as possible that a market is indeed consolidating. As we go through this series, I'll show you how to tell.
When we see an /\/\ or \/\/ on the screen, we know we are in a consolidating area. I know from your communications that many of you have a hard time recognizing consolidation. One way to spot consolidation is through the use of candlesticks.

Candlesticks offer a visual aid for spotting consolidation. Let's see how. If you see a group of dojis in a row, or a group of alternating green and red candles in a row, you are looking at consolidation. Any combination of alternating dojis and candlesticks constitute consolidation. Consolidation always has a minimum of four bars. When I say any combination of dojis and candlesticks, I mean that you might get two or more black candles in a row, followed by one or more red candles. The opposite is also true you might get two or more red candles in a row followed by one or more black candles. The congestion often starts with a doji followed by alternating red and black candles.
Consolidation may be telling you there may be confusion about price. Consolidation may be telling you that there is no oversupply or excessive demand. Supply and demand are in equilibrium, and so the market goes sideways. Consolidation can also mean less order flow into the markets. Prices are at a level where buyers are willing to buy and sellers are willing to sell, but there is nothing known that would cause impulsive, emotional buying and selling. and momentum and thrust are mostly missing.
To be continued…
© by Joe Ross. Re-transmission or reproduction of any part of this material is strictly prohibited without the prior written consent of Trading Educators, Inc.
Trading Article - Trading: Art or Science?
by Master Trader Joe Ross
Author, Trader, Trading Mentor, and Founder of Trading Educators, Inc.
Developer of Instant Income Guaranteed
I believe trading is far more an art than a science. For one thing, if trading were a science, then we should all be able to enter the same trade at the same time, and exit at the same time, getting identical results. We all know that just isn’t so. Yet if trading were scientific, we should be able to get identical results by doing the same thing. I believe such expectation describes the “scientific method.”
In addition, if trading were scientific, we should be able to come up with a “get rich” formula that would work all the time. We could then all retire and never have to work again. We all know this isn’t so either.
When we, as traders, make a trading decision, most of the time we do not fully know why we are making that decision.
You look at a market, you think about taking a trade in that market, and at some point you pull the trigger. You have thought of dozens of things in the time interval leading up to your entry. If I were to ask you, "Exactly why are you buying what you are, or why are you selling what you are?" you would probably not be able to give an accurate answer. You may be able to give a few reasons, but it will most likely not be the full answer. A lot of your decision to enter is subconscious. You do not really know why you entered, especially if you are day trading. To that extent it is more an art than a science, because you cannot fully demonstrate why you are doing what you are doing.
But you could say, "I fully know what I'm doing. I am taking the trade because I am following the signals of my method or system." Wonderful, you have just proved my point. When you are blindly trading signals from a method or system, you truly don't know why you are taking the trade. You are essentially acting like a robot, pre-programmed to follow signals whether or not they make sense.
I am not disparaging trading that way. If a method or system produces winning results, then what you are doing is following a statistically proven plan. All methods and all systems are based on statistics. The odds on any single trade are never more than 50% win or lose. However, the probability for a succession of trades is quite another story. If you are trading a method that wins seven out of ten times that you enter, and the method has produced a loser three or four times in a row, then the probability for a successful trade increases each time you enter the market. Sooner or later, over a series of trades, you are going to have the result of seven winners against 3 losers. That is statistically valid; however, it is not exactly rocket science. You will have proven that trading is an art — the art of following a statistically valid plan.
© by Joe Ross. Re-transmission or reproduction of any part of this material is strictly prohibited without the prior written consent of Trading Educators, Inc.
Instant Income Guaranteed - LNC Trade
Philippe Gautier: Administration and New Developments
Developer: Joe Ross
On 13th September 2017 we gave our Instant Income Guaranteed (IIG) subscribers the following trade on Lincoln National Corporation (LNC). We sold price insurance as follows:
- On 14th and 15th September 2017, we sold to open LNC Oct 20 2017 62.5P @ 0.36$ (average price), with 35/36 days until expiration and our short strike about 10% below price action.
- On 25th September 2017, we bought to close LNC Oct 20 2017 62.5P @ 0.10$, after 11 days in the trade for quick premium compounding.
Profit: $26 per option
Margin: $1,250
Return on Margin Annualized: 69.02%
We have also added new types of trades for our IIG daily guidance since 2016, "no loss" propositions with unlimited upside potential, still using other people's money to trade.
Philippe

Receive daily trade recommendations - we do the research for you!
♦ SIGN UP TODAY! THIS IS WORTH THE INVESTMENT ♦
© by Joe Ross and Philippe Gautier. Re-transmission or reproduction of any part of this material is strictly prohibited without the prior written consent of Trading Educators, Inc.
Blog Post - Patience as a Central Pillar of Your Strategy
by Professional Trader Andy Jordan
Educator for Spreads, Options, Swing/Day Trading, and
Editor of Traders Notebook Complete and Traders Notebook Outrights
Find out what the primary part of your trading strategy should include...read more.
© by Andy Jordan. Re-transmission or reproduction of any part of this material is strictly prohibited without the prior written consent of Trading Educators, Inc.
Trading Article - Who's next in line?
by Professional Trader Marco Mayer
Educator for Forex and Futures, Systematic Trader, and
Creator of Ambush Trading Method, Ambush Signals, and AlgoStrats.com
"Buy low, sell high" is one of the most popular memes in the investment and trading world. And obviously, it does make sense, who wouldn't like to buy low and sell high all the time? I found this to be quite a helpful advice to invest in stocks for example. Wait for a crash, buy it and sell again when prices are back to old highs.
Of course, the problem often is to figure out what's actually a low price and what's a high price. You can also buy high and sell higher to make a profit, which is how trend following works.
So what's the real deal here? I think the actual question to ask is "who's going to buy after me?" or "who's next in line?". Will there be enough traders willing to buy after you did at a higher price? Or if you're short the other way around, will there be sellers standing in line to sell after you did or not?
Think about it. To make a profit that's exactly what needs to happen. If you buy at $100, the only way to make a profit is if there are buyers willing to buy at higher prices. If they don't bid it up after you and you find someone to sell to at a higher price, you won't make a profit. Simple fact most traders are not really aware of.
Obviously, there's always someone who's gonna be the last in line. Someone is going to buy the high of the day/week/month/year/all-time. In poker, there's the popular saying that if you don't know who the patsy is in the round after 30 minutes, it's probably you. That same idea applies to trading. If you don't know why other traders are probably willing to buy at a higher price after you during the day, you might be the last one in the order book to bid at such a high price for today.
Because of that, it's always helpful to ask yourself "Who's gonna buy/sell after me and why?". If you can't answer that question it might be best to skip the trade!
Happy Trading!
Marco
© by Marco Mayer. Re-transmission or reproduction of any part of this material is strictly prohibited without the prior written consent of Trading Educators, Inc.
Check out our Blog!
To view previous published Chart Scan newsletters, please log in or click on "Join Us,"
shown above, to subscribe to our free "Members Only" section.
A WEALTH OF INFORMATION & EDUCATION:
Joe Ross-Trading Educators' popular free Chart Scan Newsletter has been published since 2004.
Note: Unless otherwise noted, all charts used in Chart Scan commentary were created
by using Genesis Financial Technologies' Trade Navigator (with permission).
Legal Notice and Copyright 2017 Disclaimer - Published by Trading Educators, Inc.
Chart Scan is a complimentary educational newsletter.
© by Trading Educators, Inc. Re-transmission or reproduction of any part of this material is strictly prohibited without prior written consent.
Edition 694 - September 29, 2017
Chart Scan with Commentary - Profit Taking Pivots
by Master Trader Joe Ross
Author, Trader, Trading Mentor, and Founder of Trading Educators, Inc.
Developer of Instant Income Guaranteed
One of my friends sent me the following chart along with his comments as you’ll see below.
Not all my students trade plain vanilla charts, which is usually the way I trade them. Some students use indicators in unconventional ways to improve their trading. The chart below is an example of using Stochastics to confirm changes in momentum in conjunction with ends of swings and trends.

Here's what my friend wrote:
"Hey, Joe...I'm passing along this chart because I thought you'd want to take a look.
You've been talking longer-term recently; I just happened to be looking at the daily GOLD chart this evening. You might be interested to observe how well the Stochastic (5,3,3) has caught the profit-taking retracements, prior to changing direction in this market.
For example, if one made a habit of taking the first breakout following a %K/%D cross (or perhaps even wait for a reversal bar), plenty of dollars could have been made in gold futures. Will prices move higher or lower? We'll have to wait and to see!"
The concept shown in this issue of Chart Scan, along with greater details and even more techniques are covered in our More Special-Setups Webinar.
© by Joe Ross. Re-transmission or reproduction of any part of this material is strictly prohibited without the prior written consent of Trading Educators, Inc.
Trading Article - Can Tick, Ticki, and Trin Be Used with Stochastics?
by Master Trader Joe Ross
Author, Trader, Trading Mentor, and Founder of Trading Educators, Inc.
Developer of Instant Income Guaranteed
I get some unusual questions from time to time, and this is one of them.
Certainly, the TICK can be used with Stochastics, as I explain below. The TICK expresses the net total of NYSE stocks that have down-ticked or up-ticked on the last trade. When E-Mini S&Ps are making new intra-day highs, the TICK should be +250 minimum. If the TICK is negative, do not take a long position. When new intraday lows are being made, a -250 minimum value should be recorded. If the TICK reaches over +500, try to buy a Stochastic D line correction at 50 or lower, and expect new intraday highs. After 2 PM CST, the main trading in the T-Bonds is over, and E-Mini S&P prices are prone to rally if they were being pressured by the T-Bonds.
The TIKI does the same thing for the Dow 30 as the TICK does for the NYSE Stock Index. It measures the tick for the 30 DJ Industrial stocks. However, I am not able to tell you exactly how to use it because I haven't really ever looked at it. I'm sure that at a value which shows TIKI to favor a long position, and with the Stochastic at oversold, you would have corroboration for going long. Vice-versa for going short with the Stochastic at overbought.
The TRIN calculates two ratios of up and down volume on gaining and losing stocks. Below 65 the TRIN is bullish; it is bearish above 110. If you seek confirmation of TRIN for a bullish position, you would want a Stochastic reading of 25 or less. If you wanted confirmation of TRIN for a bearish position, you would want to see Stochastic at 75 or more.
Numbers can be very important. Did you know that the probability of financial ruin of a system 50% accurate with a 1 to 1 pay off risking 10% of capital on each trade is .99%; with a 2 to 1 payoff, the probability of financial ruin falls to .008%?
© by Joe Ross. Re-transmission or reproduction of any part of this material is strictly prohibited without the prior written consent of Trading Educators, Inc.
Instant Income Guaranteed - IPHI Trade
Philippe Gautier: Administration and New Developments
Developer: Joe Ross
On 4th September 2017 we gave our IIG subscribers the following trade on Inphi Corporation (IPHI). We sold price insurance as follows:
- On 5th and 7th September 2017, we sold to open IPHI Oct 20 2017 30P @ 0.325$ (average price), with 44 days until expiration and our short strike about 20% below price action.
- On 19th September 2017, we bought to close IPHI Oct 20 2017 30P @ 0.15$, after 13 days in the trade for quick premium compounding.
Profit: $17.50 per option
Margin: $600
Return on Margin Annualized: 81.89%
We have also added new types of trades for our IIG daily guidance since 2016, "no loss" propositions with unlimited upside potential, still using other people's money to trade.
Philippe

Receive daily trade recommendations - we do the research for you!
♦ SIGN UP TODAY! THIS IS WORTH THE INVESTMENT ♦
© by Joe Ross and Philippe Gautier. Re-transmission or reproduction of any part of this material is strictly prohibited without the prior written consent of Trading Educators, Inc.
Traders Notebook Outrights
by Professional Trader Andy Jordan
Educator for Spreads, Options, Swing/Day Trading, and
Editor of Traders Notebook Complete and Traders Notebook Outrights
Learn Futures Swing Trading Strategies with Traders Notebook Outrights
Whether you trade commodities, currencies, financial instruments or indexes, there is a right approach to every market and time frame. You have never experienced support as you will find it with Traders Notebook. We back up and stand behind everything we do. Traders Notebook Outright shows you Futures Trading Strategies that you can also incorporate into your existing personal Day Trading Strategies.
YOU can tap into Joe Ross' and Andy Jordans' decades of hands-on trading experience. There is no need to struggle for years buying one book after another, or one "magical" mechanical trading system after another. You will receive a solid trading education from us! There is no need to knock yourself out learning about a lot of indicators. No need for Elliott Waves, Fibonacci points of confluence, and no need for Gann Theory.
Traders Notebook Outright Guide explains the Outright trading service from Trading Educators. It shows you around on the Outright Campus and how to use the information provided by the service.
TRADERS NOTEBOOK OUTRIGHTS
LOW
Monthly Subscription
$49.00/month
© by Andy Jordan. Re-transmission or reproduction of any part of this material is strictly prohibited without the prior written consent of Trading Educators, Inc.
TRADING VIDEO - MOST DEADLY MISTAKE MADE BY TRADERS
by Professional Trader Marco Mayer
Educator for Forex and Futures, Systematic Trader, and
Creator of Ambush Trading Method, Ambush Signals, and AlgoStrats.com
Let me share with you one of the most common, and most deadly mistakes traders can make, and that's averaging into a losing position. I will also give you some insights as to why this is so tempting, and shows you why you should avoid it at all costs.
INVEST IN YOU!
Marco Mayer - Private Mentoring Services
© by Marco Mayer. Re-transmission or reproduction of any part of this material is strictly prohibited without the prior written consent of Trading Educators, Inc.
Check out our Blog!
To view previous published Chart Scan newsletters, please log in or click on "Join Us,"
shown above, to subscribe to our free "Members Only" section.
A WEALTH OF INFORMATION & EDUCATION:
Joe Ross-Trading Educators' popular free Chart Scan Newsletter has been published since 2004.
Note: Unless otherwise noted, all charts used in Chart Scan commentary were created
by using Genesis Financial Technologies' Trade Navigator (with permission).
Legal Notice and Copyright 2017 Disclaimer - Published by Trading Educators, Inc.
Chart Scan is a complimentary educational newsletter.
© by Trading Educators, Inc. Re-transmission or reproduction of any part of this material is strictly prohibited without prior written consent.
Edition 693 - September 22, 2017
AMBUSH TRADING METHOD - 3:1 Ratio
by Professional Trader Marco Mayer
Educator for Forex and Futures, Systematic Trader, and
Creator of Ambush Trading Method, Ambush Signals, and AlgoStrats.com
Ambush made new all time equity highs having its best month EVER!
Marco Mayer has extended his 6-Month Subscription Special Offer until September 26th!
Ambush Signals has almost a $15,000 profit so far in 2017 with a maximum drawdown of about $4,000. That’s an excellent ratio of more than 3:1. That’s very, very hard to find in the industry, especially in 2017.

Ambush beat its historical pre-live backtest!
View more sample portfolios on the Performance Page.

In total the portfolio gained more than $8,000 in August, with 85% winning trades while having made over 1.4 times more profits on winning trades than on losing trades. How’s your favorite market doing with Ambush? Go to the Performance Page!
Become an Ambush Trader!
- Ambush Signals does all the work for you
- Customize your markets
- Position sizing tool to automatically adjust the positions to your risk preferences
6 months of Ambush Signals
Low Price of $499
$215 savings!
Build the Confidence through Drawdowns
6 months of Ambush Signals for $499 today, click here!
If you prefer to generate the signals on your own, buy the Ambush eBook today!
Coupon Code, ambush300, takes $300 off regular price!
© by Marco Mayer. Re-transmission or reproduction of any part of this material is strictly prohibited without the prior written consent of Trading Educators, Inc.
Chart Scan with Commentary - eMini Russell 2000
by Master Trader Joe Ross
Author, Trader, Trading Mentor, and Founder of Trading Educators, Inc.
Developer of Instant Income Guaranteed
Personally, I enjoy trading the e-mini Russell 2000. It makes beautiful Law of Charts formations. I take trades in it mostly from the 3-10, minute time frames, but also quite often from the daily chart. The formations are always clean and clear, and the moves tend to be spectacular. As one of our trading friends put it, you get ten ticks to the point with Russell for $100 total, versus only four ticks per point with the e-mini S&P for a total of $50. That makes Russell easier to trade.
Let's look at a daily Russell chart to see some classic Law of Charts formations that have happened recently.
As you can see, prices reached the low in May with a beautiful reversal bar. Based on that reversal bar, frightened shorts began buying to lock in any profits they might have had from earlier price action. Reversal bar breakout traders joined in the buying, and prices moved from #1 to #2. Again at #2 there was profit taking by longs, and their selling took prices down to where we see #3. There were four correcting bars in the move to #3, at which time there was Traders Trick Entry available for going long.
Prices then proceeded to move past the #2 point, and a Ross hook formed. From the point of the first Ross hook there were three bars of correction, yielding another Traders Trick Entry.
Prices moved up again, formed a second Ross Hook, but then fell back into a 16-bar consolidation. The high and low of the consolidation I showed as brown horizontal lines. The green line is the center of the consolidation.
As I write this, it is not yet clear what will happen from where we see prices on the last bar. But a lot of money was available from the two TTEs.
Implementing The Law of Charts using the Traders Trick Entry continues to produce profits for thousands of traders around the world. Because of this we are proud to offer the Trading All Markets Recorded Webinar, or The Law of Charts In-Depth Recorded Webinar. We hope those of you who have been unable to take private mentoring will take advantage of the wealth of knowledge available in either of these Recorded Webinars.

© by Joe Ross. Re-transmission or reproduction of any part of this material is strictly prohibited without the prior written consent of Trading Educators, Inc.
Trading Article - Plans and Objectives
by Master Trader Joe Ross
Author, Trader, Trading Mentor, and Founder of Trading Educators, Inc.
Developer of Instant Income Guaranteed
I was watching an old movie "Coach Carter," starring Samuel L. Jackson. I couldn't help thinking about the many similarities between what a coach must do to prepare his players and what a trader must do to prepare to trade.
Since trading is largely a self-directed business venture, embarking on a trading career requires that you are able to set clearly defined objectives and develop a specific plan for achieving them.
Clearly defined objectives and well-developed plans carry the stamp of success in any professional undertaking.
Imagine an ocean liner departing without a navigational plan, a repairman doing repairs on your refrigerator without full knowledge of the workings of the compressor, or a professional basketball team running onto the court without a game plan.
In each case, the lack of a clearly defined plan in which specific objectives are set and specific steps are outlined can produce disastrous results. Clearly defined plans are essential. The captain sails his ship with plans for the safe and on-time arrival to a destination city. The repairman examines the inner workings of your refrigerator and uses the correct parts and tools to fix the problem. The coach tells the basketball team to run specific plays to defeat the opponent.
Successful trading careers start with plans that specify objectives, which in turn lead to success. There are psychological benefits to establishing objectives and developing plans to reach them. First, you may find your stress levels are reduced. Making a specific plan allows you to detail any vague and seemingly unattainable objectives into clearly defined steps, which in turn make the larger goal seem more reachable. When you have a specific plan, you can more easily identify which steps to do first, and then figure out how you will achieve each one. In addition, you will find that following a plan ensures you stay positive, so you control each aspect of your trading day (instead of its controlling you). This leads to increased confidence and consistency, which leads to increased effectiveness, which in turn leads to advancement towards your ultimate goal.
You must then write down the way you envision your goal. Create a definitive statement detailing as much of it as you can. Be very specific. Then read your objectives aloud every day. They must become believable.
Accordingly, you adjust trade size and protective stops so that you never lose more than your planned amount on any trade.
Now, map out your plan. What is your budget for hardware, software, and education? How much time can you devote? How much money will you use? What trading time frame, or style, matches your personality? For example, if you have trouble making split-second decisions, then scalping is not for you. Perhaps position trading, with a 2 to 5-day hold, better suits your personality.
Maybe you want to target certain markets and become a “specialist” in those markets. Or maybe you prefer to trade spreads or options. What set-ups do you prefer? Become an expert at trading a particular set-up and have it deliver the main part of your gains. Detail your trade, risk and money management strategies. Finally, establish a list of trading rules that you keep close-by.
Once you establish convincing and realistic objectives, and map out a plan that leads to those goals, you will find your trading efforts to be easier, more exciting, and certainly more successful!
© by Joe Ross. Re-transmission or reproduction of any part of this material is strictly prohibited without the prior written consent of Trading Educators, Inc.
Instant Income Guaranteed - UFS Trade
Philippe Gautier: Administration and New Developments
Developer: Joe Ross
On 20th August 2017 we gave our IIG subscribers the following trade on Domtar Corporation (UFS). We sold price insurance as follows:
- On 21st August 2017, we sold to open UFS Oct 20, 2017 35P @ $0.35, with 59 days until expiration and our short strike 12% below price action.
- On 11th September 2017, we bought to close UFS Oct 20, 2017 35P @ $0.15, after 21 days in the trade.
Profit: $20 per option
Margin: $70
Return on Margin Annualized: 49.66%
We have also added new types of trades for our IIG daily guidance since 2016, "no loss" propositions with unlimited upside potential, still using other people's money to trade.
Philippe

Receive daily trade recommendations - we do the research for you!
Instant Income Guaranteed
♦ SIGN UP TODAY! THIS IS WORTH THE INVESTMENT ♦
© by Joe Ross and Philippe Gautier. Re-transmission or reproduction of any part of this material is strictly prohibited without the prior written consent of Trading Educators, Inc.
Trading Blog - Achieving Self-Esteem
by Professional Trader Andy Jordan
Educator for Spreads, Options, Swing/Day Trading, and
Editor of Traders Notebook Complete and Traders Notebook Outrights
The single most important component of the personality related to personal achievement is self-esteem. Self-esteem is simply how much an individual likes himself and correlates to high achievement on a one-to-one basis. The more an individual likes himself the higher levels of performance he can achieve in any area of his life. Traders should always have at least one physical or mental activity every week that helps them feel good about themselves, like chess or golf.
To reach high performance and personal achievement, understanding the three components of the self-concept is beneficial. The Ideal Self is a mental picture of the trader a person would like to become, a composite of the all positive qualities admired in other traders. Schwager's "Market Wizards" is filled with these admirable characters with their winning personalities. The Self Image is the inner mirror of the person a trader thinks he really is, and relates how he interacts with others on a day-today basis. A person seldom reaches levels of achievement beyond his self-image limitations. The Self-Esteem is how much a person likes himself. The more a person likes himself the higher levels of achievement are possible. These three components of the personality are always changing every moment. The self-aware trader shapes these personality components to compliment his goal achieving efforts to profitably trade the markets.
© by Andy Jordan. Re-transmission or reproduction of any part of this material is strictly prohibited without the prior written consent of Trading Educators, Inc.
Check out our Blog!
To view previous published Chart Scan newsletters, please log in or click on "Join Us,"
shown above, to subscribe to our free "Members Only" section.
A WEALTH OF INFORMATION & EDUCATION:
Joe Ross-Trading Educators' popular free Chart Scan Newsletter has been published since 2004.
Note: Unless otherwise noted, all charts used in Chart Scan commentary were created
by using Genesis Financial Technologies' Trade Navigator (with permission).
Legal Notice and Copyright 2017 Disclaimer - Published by Trading Educators, Inc.
Chart Scan is a complimentary educational newsletter.
© by Trading Educators, Inc. Re-transmission or reproduction of any part of this material is strictly prohibited without prior written consent.
Edition 692 - September 15, 2017
AMBUSH TRADING METHOD - ALL TIME EQUITY HIGHS!
by Professional Trader Marco Mayer
Educator for Forex and Futures, Systematic Trader, and
Creator of Ambush Trading Method, Ambush Signals, and AlgoStrats.com
Ambush made new all time equity highs having its best month EVER!
You may remember earlier this year in my previous report when I announced that Ambush had made new all time equity highs. Well, guess what? It didn’t stop there and it literally exploded much higher while having its best trading month ever!
Looking at the whole futures systematic trading industry, 2017 has been an exceptionally difficult year. Of all the systems that I’m following, Ambush is literally the only one that kept performing as usual this year.
Ambush has been around for almost 10 years now but as markets tend to change, I do review Ambush once a year to see if any changes are necessary to adapt to changing market conditions. The last time any significant changes have been required was in July 2015. As you can see on the following chart Ambush kept on performing as expected in live trading.
Funny enough it just beat its pre-live backtest and as of August has been its best trading month EVER! This really says something about a trading method if it beats its historical backtest performance in live-trading doesn’t it?
Let’s look at the Ambush All Stars Portfolio for Small Accounts (you can find out more about the sample portfolios on the Performance Page) in August.
Looking at all the August trades in detail, we can see that the profits have been nicely distributed across the different markets.
In total the portfolio gained more than $8,000 in August, with 85% winning trades while having made over 1.4 times more profits on winning trades than on losing trades. Yes, really and yes this is crazy!
Now obviously "crazy" happens and it’s fun to talk about it but of course you want to see more than just a chart showing you what happened last month right? How did the Australian Dollar perform over the years? What are the different portfolios made of? How’s your favorite market doing with Ambush?
To find out about all of the above, simply go to the Performance Page where you’ll find all the stats you need.
Join us and become an Ambush Trader!
The easiest way to follow Ambush is, of course, Ambush Signals. It does all the work for you, allows you to customize what markets you want to see and has a position sizing tool implemented to automatically adjust the positions to your risk preferences.
Each day around 6:30 pm NY Time the Signals are available for you on the Dashboard. You can then place your orders and literally walk away until the next market close!
If you following any System it can be tough in the beginning. It simply needs time to build the confidence needed to make it through drawdowns. What if you’re unlucky and don’t catch Ambush’s best trading month ever when you start trading?
I want you to succeed trading Ambush, so here’s something for you that will strongly increase your odds of success and allow you to easily gain the confidence you’ll need to become a profitable Ambush trader.
I offer you 6 months of Ambush Signals for just $499. That’s a saving of $215, giving you almost two months of Ambush Signals for free. As we usually only offer monthly or 3-months subscriptions, this is a one-time offer!
These 6 months will allow you to get to know Ambush Signals without too much stress or pressure and to follow it for a long enough time period that it simply won’t that much if you’re lucky and start on Ambush’s best trading month ever or not.
Don’t miss out on this and get your 6 months of Ambush Signals for $499 today, click here!
Ambush eBook
Now if you’d prefer to rather generate the signals on your own and want to know the exact trading rules of Ambush, we also have a special offer for the Ambush eBook:
Coupon Code:
- Ambush eBook: use "ambush300" to get the Ambush eBook $300 off, for $999 instead of $1299.
Now if you’re thinking that getting a trading method that’s been doing so well for such a nice price is too good to be true, then you’re right. As you might remember we’ve already significantly raised the price of eBook last year. I can’t tell you much more at this point but this might be your last chance to get into Ambush Signals or to buy the Ambush eBook at such a low price.
All Coupon codes are valid only until Wednesday, September 20th. Hurry up and don’t miss out on this rare opportunity!
Happy Trading!
Marco
© by Marco Mayer. Re-transmission or reproduction of any part of this material is strictly prohibited without the prior written consent of Trading Educators, Inc.
Trading Article - Drawdowns
by Professional Trader Andy Jordan
Educator for Spreads, Options, Swing/Day Trading, and
Editor of Traders Notebook Complete and Traders Notebook Outrights
Today I want to show you something that most educators will not talk about: Drawdowns
Most of the time as a trader, you will find yourself in periods of draw downs. This means, most of the time after reaching a new equity high you will be under water. That is something most newbies underestimate and one of the main reasons traders fail because they get the idea they will be up most of the time. Inexperienced traders don’t come up with this idea by themselves, of course. It is mainly the trading education industries that tells everyone how easy and how much fun trading is.
The calculation shown below comes from Robert Frey, a math guy, and as you can see, traders might be a significant time in draw down periods.

“Robert FREY - 180 years of Market Drawdowns” has a video on YouTube that is worth checking out.
Happy trading,
Andy
© by Andy Jordan. Re-transmission or reproduction of any part of this material is strictly prohibited without the prior written consent of Trading Educators, Inc.
Chart Scan with Commentary - Weekly Chart Trading
by Master Trader Joe Ross
Author, Trader, Trading Mentor, and Founder of Trading Educators, Inc.
Developer of Instant Income Guaranteed
Are you missing out?
Sometimes we are so busy looking at the forest that we miss seeing the trees. If you are a day trader it could be you are no longer seeing the trees that are on the weekly chart. This past week I've been looking at weekly charts. What prompted me was that a friend of mine, who has been trading strictly from the weekly charts, wrote to tell me his account is up five-fold. Is yours?
T-Note futures have always been difficult for me to trade as a day trader. So I decided to look at "trees" in the T-Note futures first. I was astonished at what I saw. There were 1-2-3s, Ross Hooks and Traders Tricks.
Yeah! But who wants to trade the weekly chart? What I should have been asking is why haven't I been trading the weekly charts? Trading the weekly charts doesn't mean that you have to sit and watch the market all week long hoping for a trade. With today's automatic trading platforms, there's not a lot of watching to do. Besides, if you are willing to take some money off the table quickly, trades from the weekly chart can be ideal. The moves on a weekly chart, even when small, are typically much greater than you'll get from the same move on a daily or intra-day chart.
Take a look!

The arrow points to a Traders Trick Entry. I would have made a nice bundle on that one. But where was I? Burning up my eyeballs looking for an intraday trade in four other markets.
Several weeks later, prices bottomed out and formed a 1-2-3 low, which has turned into a possible ledge trade. Please notice that when notes move a full point, it is worth $1,000. That means if I had entered at 142^00 and exited at 132^00, I would have made $10,000. As Fagin said the movie “Oliver,” I think I’d better think it out again.
Are you getting my message?
© by Joe Ross. Re-transmission or reproduction of any part of this material is strictly prohibited without the prior written consent of Trading Educators, Inc.
Trading Article - Hey Joe! Any suggestions for the kind of information a new trader should collect and maintain?
by Master Trader Joe Ross
Author, Trader, Trading Mentor, and Founder of Trading Educators, Inc.
Developer of Instant Income Guaranteed
New traders must keep a diary of trades with the following information:
- Why trades were initiated
- How stops were managed
- Where and why they were moved
- Why the trade was exited
Personal observations. This trade check analysis will spot any breakdowns in discipline or methodology, and focus the trader on why actions are being taken. What is the purpose of this diary? To help you find your true self. To be a successful trader, you need to find out who you really are.
Traders should also keep a chart of their equity. This can be set up in a spread sheet and graphed. Every win should be added and every loss subtracted. After 20 trades, begin to maintain a moving average of the equity. If your trading equity falls below the moving average, stop trading. Paper trade until the equity curve rises above the moving average, at which point you may trade again using real money.
This little exercise will assist you in keeping your losses small and optimizing your wins. You will trade away your bad periods on paper, or a simulator, while your winning periods will be traded with real money.
We have developed a wonderful tool to help you. It’s called “The Life Index for Traders” and it comes with the “Equity Evaluator.”
© by Joe Ross. Re-transmission or reproduction of any part of this material is strictly prohibited without the prior written consent of Trading Educators, Inc.
Instant Income Guaranteed - TRN Trade
Philippe Gautier: Administration and New Developments
Developer: Joe Ross
On 14th Aug 2017 we gave our IIG subscribers the following trade on Trinity Industries (TRN). We sold price insurance as follows on a GTC order as we could not get filled initially at our minimum price:
- On 18th August 2017, we sold to open TRN Sep 29, 2017 24P @ $0.15, with 41 days until expiration.
- On 1st September 2017, we bought to close TRN Sep 29 2017 24P @ $0.05, after 14 days in the trade for quick premium compounding.
Profit: $10 per option
Margin: $480
Return on Margin Annualized: 54.32%
By patiently waiting for a retracement to get our minimum fill price, we could exit the trade fairly quickly.
We have also added new types of trades for our IIG daily guidance since 2016, "no loss" propositions with unlimited upside potential, still using other people's money to trade.
Philippe

Receive daily trade recommendations - we do the research for you!
Instant Income Guaranteed
♦ SIGN UP TODAY! THIS IS WORTH THE INVESTMENT ♦
© by Joe Ross and Philippe Gautier. Re-transmission or reproduction of any part of this material is strictly prohibited without the prior written consent of Trading Educators, Inc.
Check out our Blog!
To view previous published Chart Scan newsletters, please log in or click on "Join Us,"
shown above, to subscribe to our free "Members Only" section.
A WEALTH OF INFORMATION & EDUCATION:
Joe Ross-Trading Educators' popular free Chart Scan Newsletter has been published since 2004.
Note: Unless otherwise noted, all charts used in Chart Scan commentary were created
by using Genesis Financial Technologies' Trade Navigator (with permission).
Legal Notice and Copyright 2017 Disclaimer - Published by Trading Educators, Inc.
Chart Scan is a complimentary educational newsletter.
© by Trading Educators, Inc. Re-transmission or reproduction of any part of this material is strictly prohibited without prior written consent.
Edition 691 - September 8, 2017
Trading Article - Is there a correct way to trade the markets?
by Professional Trader Andy Jordan
Educator for Spreads, Options, Swing/Day Trading, and
Editor of Traders Notebook Complete and Traders Notebook Outrights
There isn't one “correct” way to trade the markets. While it may be tempting to emulate your favorite “Market Marvel”, in the end it’s really crucial to match your trading style with your personality. Some traders are methodical and almost compulsive in their tactics, carefully backtesting their strategies, scrutinizing all possibilities and taking sound precautions to ensure success. Other traders are more laid back, taking risk and uncertainty in stride, confident enough to formulate trading plans as they go along, finding opportunity as it happens. Again, there is no best approach. The approach you use to trade the markets depends on your unique personality and what you are comfortable with.
Above all, to trade successfully, the critical requirement is self-confidence. Developing a sense of confidence requires the accumulation of real life experience – becoming acquainted with various market conditions and discovering how you react to them. Once you have rock solid confidence based on copious experience, the way you approach trading is a matter of preference.
It is vital to your performance to be yourself, and not try to be someone you aren’t just because you think there’s ultimately a “right” way to trade. You must discover what works best for you, and what you need to do to trade profitably. The only standards that matter are your own.
Happy trading,
Andy
© by Andy Jordan. Re-transmission or reproduction of any part of this material is strictly prohibited without the prior written consent of Trading Educators, Inc.
Chart Scan with Commentary - From Ledge to Ross Hook
by Master Trader Joe Ross
Author, Trader, Trading Mentor, and Founder of Trading Educators, Inc.
Developer of Instant Income Guaranteed

Prices for a stock I was trading broke out of an extended trading range on September 27, 2015. Almost immediately prices began to form a nine bar ledge with matching highs at 9.10 and matching lows at 8.87 and 8.86. The Law of Charts states that a ledge formation must contain at least four price bars, but no more than ten price bars. Prices broke out to the upside of the ledge on the tenth bar (October 11, 2015), and were followed the next day with the recent high. The Law of Charts states that the first failure of prices to continue in the direction they were going subsequent to the breakout of a ledge constitutes a Ross hook. There was a potential double high Traders Trick entry to go long showing on the chart. A breakout one tick above the double high at 9.26 offered a consideration to buy at 9.27. However, as we show in our online seminar Traders Trick, Advanced Concepts there are refinements that can make the probabilities for a winning trade approach the 90th percentile.
Notice also that entry on the breakout from a ledge is taken only in the direction of the previous trend or swing.
© by Joe Ross. Re-transmission or reproduction of any part of this material is strictly prohibited without the prior written consent of Trading Educators, Inc.
Trading Article - Achieving Self-Esteem
by Master Trader Joe Ross
Author, Trader, Trading Mentor, and Founder of Trading Educators, Inc.
Developer of Instant Income Guaranteed
The single most important component of the personality related to personal achievement is self-esteem. Self-esteem is simply how much an individual likes himself and correlates to high achievement on a one-to-one basis. The more an individual likes himself the higher levels of performance he can achieve in any area of his life. Traders should always have at least one physical or mental activity every week that helps them feel good about themselves, like chess or golf. After a trader takes a loss or makes a mistake, he should consider going to a mirror looking himself in the eye and repeating the phrase, “I like myself,” with intensity, at least five times. This should boost the trader's self-esteem despite his losses, assuming he committed no trading discipline violations.
To reach high performance and personal achievement, understanding the three components of the self-concept is beneficial. The Ideal Self is a mental picture of the trader a person would like to become, a composite of the all positive qualities admired in other traders. Schwager's “Market Wizards” is filled with these admirable characters with their winning personalities. The Self Image is the inner mirror of the person a trader thinks he really is, and relates how he interacts with others on a day-today basis. A person seldom reaches levels of achievement beyond his self-image limitations. The Self-Esteem is how much a person likes himself. The more a person likes himself the higher levels of achievement are possible. These three components of the personality are always changing every moment. The self-aware trader shapes these personality components to compliment his goal achieving efforts to profitably trade the markets.
© by Joe Ross. Re-transmission or reproduction of any part of this material is strictly prohibited without the prior written consent of Trading Educators, Inc.
Instant Income Guaranteed - RIO Trade
Philippe Gautier: Administration and New Developments
Developer: Joe Ross
On 22nd June 2016, we gave our subscribers a new type of trade for RIO (Rio Tinto), on a pullback within an uptrend on the weekly chart.
We entered a spread position for a net credit (still working with OPM, i.e. other people's money, as usual), but with unlimited upside potential.
- On 12th June 2016, we entered the trade for a credit of 2.00$(or $200 per position).
- We took partial exits for a profit on 9th November 2016 and 24th January 2017.
- On 31st August 2017, we completely closed the trade, after 455 days in the trade.
Profit: $850 per spread
Margin: $561 per spread
Return on Margin Annualized: 136.79%
These are low maintenance, low stress trades with lots of upside potential.
We presently have 25 of these trades opened. We took partial profits on some of them.
This technique is allowing us to take advantage of sector rotations (metals, gold and silver miners, etc.).
If you are interested in learning this new technique, come and join us!
Philippe

Receive daily trade recommendations - we do the research for you!
Instant Income Guaranteed
♦ SIGN UP TODAY! THIS IS WORTH THE INVESTMENT ♦
© by Joe Ross and Philippe Gautier. Re-transmission or reproduction of any part of this material is strictly prohibited without the prior written consent of Trading Educators, Inc.
Trading Video - Ambush Signals
by Professional Trader Marco Mayer
Educator for Forex and Futures, Systematic Trader, and
Creator of Ambush Trading Method, Ambush Signals, and AlgoStrats.com
Ambush made new all time equity highs! Be on the lookout for Special Pricing in next week's newsletter with Marco Mayer's Ambush ebook and Ambush Signals.
Learn all you need to know about our Ambush Signals service during this presentation by Marco Mayer. What is the Ambush System, what's the idea behind it and how does Ambush Signals make trading Ambush so much easier!
Happy Trading!
Marco
© by Marco Mayer. Re-transmission or reproduction of any part of this material is strictly prohibited without the prior written consent of Trading Educators, Inc.
Check out our Blog!
To view previous published Chart Scan newsletters, please log in or click on "Join Us,"
shown above, to subscribe to our free "Members Only" section.
A WEALTH OF INFORMATION & EDUCATION:
Joe Ross-Trading Educators' popular free Chart Scan Newsletter has been published since 2004.
Note: Unless otherwise noted, all charts used in Chart Scan commentary were created
by using Genesis Financial Technologies' Trade Navigator (with permission).
Legal Notice and Copyright 2017 Disclaimer - Published by Trading Educators, Inc.
Chart Scan is a complimentary educational newsletter.
© by Trading Educators, Inc. Re-transmission or reproduction of any part of this material is strictly prohibited without prior written consent.
Edition 690 - September 1, 2017
Chart Scan with Commentary - Spreads
by Master Trader Joe Ross
Author, Trader, Trading Mentor, and Founder of Trading Educators, Inc.
Developer of Instant Income Guaranteed
I know I often write about spreads, and it is because there are some important lessons to be learned about spread trading. One of my favorites is learning to spread when I need more time for a market to decide which way it wants to go.
One day, I got myself tangled up short in a May silver futures trade. Due to circumstances beyond my control, I ended the day still in the market with May silver going nowhere. It was struggling to find direction, but it didn't seem to be going anywhere.
I found myself down a bit by the end of the day and, because sometimes I am persistent in trying to turn a trade into a winner if I can find a way, I decided to spread off by going long the July contract. I was down only a few ticks, and prices were not yet close to my stop loss when I entered the spread long July and short May. The chart shows what happened. I got out with a win, and now I'm standing aside until things begin to rock and roll once again. Sometimes you get lucky!

© by Joe Ross. Re-transmission or reproduction of any part of this material is strictly prohibited without the prior written consent of Trading Educators, Inc.
Trading Article - One market or several?
by Master Trader Joe Ross
Author, Trader, Trading Mentor, and Founder of Trading Educators, Inc.
Developer of Instant Income Guaranteed
Why do traders bail out of some markets to go to other contracts? Wouldn’t it be better to learn one market and stick with it?
The main reason traders bail out of a market is that they are not making any money. This has happened in various ways. In the currencies in the 1990s, for instance, lot sizes became too big for the market movers to fade (take the opposite side). The big players did not want to fade the trades of the smaller locals in the pit. In some instances, the smaller locals were standing around with their hands in their pockets for lack of something to do. Some locals were forced into conglomerates that took away their freedom to trade as they pleased. If they wanted to stay in the pit, they had to team up with other traders and together, as a group, they would fade the large orders that were/are coming into the pit. This meant that the biggest of the small traders would fade let's say a 500-lot order. He would then parcel out all the contracts he didn't want to the smaller traders: “Okay, you take 50, and you take 20, and you take 10, and you take 30,” etc.
If you didn't take what was parceled out to you, you would never again trade in the pit. It was either take it, or get out of the pit. No one would trade with you if you refused even one segment that was parceled out to you. That’s not exactly a free market type of situation. If you lost, then the "boss" trader would try to make it up to you, but this was seldom possible. In other words, your own trades depended entirely on someone else's judgment and ability to trade. The end result was the beginning of Forex as a major venue for currency traders. What happened then is that many currency traders moved to other markets.
What are the pit traders doing now that the best markets have moved to electronic trading? Just as with anything else, if you can't make money where you are, you move on. Some are moving on to other careers. Others are trying for success through trading from a screen. But here's a startling statistic: "Ninety percent of pit traders fail at trading from a screen."
So why does anyone leave one market for another? You leave when you can no longer make money. In 2003 I stopped trading the e-mini S&P 500. I was unable to make money there. That is not to say that others can't make money there, but for the way I like to trade, I had to move to other markets, and I found plenty of other markets in which to trade. To some extent, I had to change my trading style in order to succeed, but the changes were minor. I went from trading only the S&P 500 in open outcry to trading several markets other markets electronically. Being eclectic, I go where I am able to succeed.
© by Joe Ross. Re-transmission or reproduction of any part of this material is strictly prohibited without the prior written consent of Trading Educators, Inc.
Instant Income Guaranteed - AEM Trade
Philippe Gautier: Administration and New Developments
Developer: Joe Ross
On 30th July 2017 we gave our IIG subscribers the following trade on Agnico-Eagle Mines Ltd (AEM). We sold price insurance as follows:
- On 31st July 2017, we sold to open AEM Sep 15 2017 42P @ $0.435 (average price), with 45 days until expiration, with our short strike about 11% below price action.
- On 4th August 2017, we sold to open AEM Sep 15 2017 42P @ $0.65 on a GTC order for the second half of our position.
- On 16th August 2017, we bought to close AEM Sep 15 2017 42P @ $0.25, after 16 days in the trade for quick premium compounding.
Profit: $29.30 per option
Margin: $840
Return on Margin Annualized: 79.57%
We have also added new types of trades for our IIG daily guidance since 2016, "no loss" propositions with unlimited upside potential, still using other people's money to trade.
Philippe

Receive daily trade recommendations - we do the research for you!
Instant Income Guaranteed
♦ SIGN UP TODAY! THIS IS WORTH THE INVESTMENT ♦
© by Joe Ross and Philippe Gautier. Re-transmission or reproduction of any part of this material is strictly prohibited without the prior written consent of Trading Educators, Inc.
Trading Article - The right mindset to deal with drawdowns
by Professional Trader Marco Mayer
Educator for Forex and Futures, Systematic Trader, and
Creator of Ambush Trading Method, Ambush Signals, and AlgoStrats.com
Drawdowns are an unavoidable fact in trading that's tough to deal with. But you probably already noticed that and might have encountered some of the serious issues this can lead to during your trading career. Maybe you tend to stop trading a system or switch systems always at the wrong time. Or worse. But as I've written about these issues before, here's a mindset that has helped me a lot to deal with drawdowns in the long run.
Things got a lot easier for me once I started to treat trading a system or just following a specific trading plan or strategy like an investment. Let me explain.
Let's say you believe in the success and growth of a certain company, Apple for example. Therefore you decide to invest a certain amount of money in it and buy the stock. You get in at $100. Right after you bought the price of the stock goes down to $95. You're down 5% and probably a little bit disappointed about your bad timing. If you're sane that's where you stop worrying. You won't start questioning your investment because the price of the stock dropped $5. You still believe in the company, nothing fundamental changed so you just keep your stocks. A year later Apple trades at $140 and you're quite happy but it might have been a volatile journey up to $135 during the year. Again though that's no big issue as you expect this. Stock prices can be volatile and you don't expect them to move higher in a straight line!
Why not apply the same mindset to trading a system? Take a certain amount of money and invest it into the strategy. As long as you believe in the strategy and the drawdown is within what you expect, why worry? Just keep on trading it, stop worrying about the daily ups and down and questioning it on every little drawdown. Of course, if something fundamental changes or you hit unexpected drawdowns you act. But otherwise, it really helps to treat it like an investment, leave it alone and let it do its thing.
Happy Trading!
Marco
© by Marco Mayer. Re-transmission or reproduction of any part of this material is strictly prohibited without the prior written consent of Trading Educators, Inc.
Trading Idea - Lean Hogs Butterfly Spread
by Professional Trader Andy Jordan
Educator for Spreads, Options, Swing/Day Trading, and
Editor of Traders Notebook Complete and Traders Notebook Outrights
This week, we're looking at the HEV17 – 2*HEZ17 + HEG18 Butterfly Spread: long 1 October 2017, short 2 December 2017, and long 1 February 2018 Lean Hogs (CME on Globex).

Today we consider a Lean Hogs Butterfly Spread: long 1 October 2017, short 2 December 2017, and long 1 February 2018 Lean Hogs (elec. symbols: HEV17 – 2*HEZ17 + HEG18 or HEL1V17 on CQG). The Butterfly Spread has been in a range since May as you easily notice on the chart above. For the next few weeks, the spread usually moves to the up-side as shown by the blue (15 year seasonal) and red (5 year seasonal) line on the chart. Will this also happen this year? Of course, we never know for sure but the spread closed higher on 10/06 compared to 09/07 during the last 20 years. Statistically speaking, there is a high chance we will see higher prices of the spread during the next few weeks.
Happy trading,
Andy
Do you want to see how we manage this trade and how to get detailed trading instructions every day?
Traders Notebook Complete
Please visit the following link:
Yes, I would like additional information!
© by Andy Jordan. Re-transmission or reproduction of any part of this material is strictly prohibited without the prior written consent of Trading Educators, Inc.
Check out our Blog!
To view previous published Chart Scan newsletters, please log in or click on "Join Us,"
shown above, to subscribe to our free "Members Only" section.
A WEALTH OF INFORMATION & EDUCATION:
Joe Ross-Trading Educators' popular free Chart Scan Newsletter has been published since 2004.
Note: Unless otherwise noted, all charts used in Chart Scan commentary were created
by using Genesis Financial Technologies' Trade Navigator (with permission).
Legal Notice and Copyright 2017 Disclaimer - Published by Trading Educators, Inc.
Chart Scan is a complimentary educational newsletter.
© by Trading Educators, Inc. Re-transmission or reproduction of any part of this material is strictly prohibited without prior written consent.
Edition 689 - August 25, 2017
Chart Scan with Commentary - Spread
by Master Trader Joe Ross
Author, Trader, Trading Mentor, and Founder of Trading Educators, Inc.
Developer of Instant Income Guaranteed
A spread can be profitably entered even though prices on both legs of the spread are moving down. As you can see both soybean meal and soybeans were moving down, only prices for soybeans (lower chart) were moving down more steeply and faster than prices for soybean meal. This is a situation for creating a spread between the two.

You can see the spread line begin to rise in late February. The spread formed a 1-2-3 low and then broke out above the #2 point.
At this point in time it is of no importance whether this spread is seasonal or not. The fact is that it can be entered simply my mere observation. Prices falling on one hand and prices falling faster on the other. The beauty of spread is that they are based on reality, rather than price manipulation. There is a fundamental reason why soybean prices are falling faster than soymeal prices. We don’t have to know the reason why this is happening. We have only to look and see the truth.
© by Joe Ross. Re-transmission or reproduction of any part of this material is strictly prohibited without the prior written consent of Trading Educators, Inc.
Trading Article - Computerized Trading
by Master Trader Joe Ross
Author, Trader, Trading Mentor, and Founder of Trading Educators, Inc.
Developer of Instant Income Guaranteed
Someone wrote in: “Will trading eventually be done by programmed computers and not by people? Are we really headed that way?”
The answer is that it is already true. I read that at times 90% of daily trading in the stock market is computerized trading.
The computer age is bringing about unprecedented change in the markets. Even now it is altering the manner in which we conduct business, interpret events, gather information, and keep ourselves entertained.
While computers can expand our intellectual horizons, they can also limit creative interpretation. There is a tendency these days to let computers do the work of designing and discovering rather than relying upon intuition and imagination. All too often this is taking place even when it flies in the face of reality.
In a business context, computers reduce problems to statistical probabilities without necessarily considering the broad effects of events and relationships. No computer can keep you safe from those events which come unexpectedly, and which cause markets to go berserk. Wars, sudden shifts in political power and alliances, and natural disasters, can cause markets to become suddenly and extremely volatile. Even when statistics take such extremes into account, how do you defend yourself if you are long and a market suddenly crashes? Prices can leap right over your protective stops. A severe crash can shut the market down, and when it reopens you could be staring at a huge loss.
I’m not saying that computers shouldn’t be used to prove or disprove theories. But keep in mind that the intuition of the human mind has not yet been duplicated by electronic circuitry. Our educated insights are the critical tools with which we learn and comprehend how markets work.
© by Joe Ross. Re-transmission or reproduction of any part of this material is strictly prohibited without the prior written consent of Trading Educators, Inc.
Instant Income Guaranteed - HST Trade
Philippe Gautier: Administration and New Developments
Developer: Joe Ross
On 27th July 2017 we gave our IIG subscribers the following trade on Host Marriott Financial Trust (HST). We sold price insurance as follows on a GTC order as we could not get filled initially at our minimum price:
- On 9th August 2017, we sold to open HST Sep 15 2017 17P @ $0.20, with 36 days until expiration.
- On 17th August 2017, we bought to close HST Sep 15 2017 17P @ $0.10, after 8 days in the trade for quick premium compounding.
Profit: $10 per option
Margin: $340
Return on Margin Annualized: 134.19%
By patiently waiting for a retracement to get our minimum fill price, we could exit the trade very quickly.
We have also added new types of trades for our IIG daily guidance since 2016, "no loss" propositions with unlimited upside potential, still using other people's money to trade.
Philippe

Receive daily trade recommendations - we do the research for you!
Instant Income Guaranteed
♦ SIGN UP TODAY! THIS IS WORTH THE INVESTMENT ♦
© by Joe Ross and Philippe Gautier. Re-transmission or reproduction of any part of this material is strictly prohibited without the prior written consent of Trading Educators, Inc.
Trading Article - Don’t get married to a market!
by Professional Trader Marco Mayer
Educator for Forex and Futures, Systematic Trader, and
Creator of Ambush Trading Method, Ambush Signals, and AlgoStrats.com
There are so many different instruments to trade like stocks, bonds, futures, spot forex, options and so on. And even when you decide to get into futures, there are tons of futures out there! So where to even start? I was as confused as anyone else about this when I started trading.
That’s why it probably feels good to focus on just one market in the beginning. "I just trade the EUR/USD" or "I only trade the ES" or "I'm a Gold trader" are common statements out there. And that’s not a bad thing. It’s almost impossible to start otherwise, you have to over simplify things in the beginning. Otherwise, you’d never get started trading at all.
But at some point, you should move on and expand your trading world. There are times when it’s almost impossible to make a profit in the EUR/USD or when it’s better to stay away from the ES. During these times maybe Gold or Crude Oil or AUD/USD are providing really good trading opportunities.
Especially as a day trader, you got to go where the action is. I’ve seen many traders going under because they kept on trying to milk a dead cow. That’s why recognizing when it’s time to look elsewhere is one of the most important skills to survive in the long term.
Don’t get marries to a single market, don’t keep on throwing good money after bad just to prove to your ego that you can get the money back from that market. Be flexible, go where the easy buck is.
There’s almost always a low hanging fruit…and usually, you know where it is. You’re just too stubborn to take it.
Happy Trading!
Marco
© by Marco Mayer. Re-transmission or reproduction of any part of this material is strictly prohibited without the prior written consent of Trading Educators, Inc.
Trading Article - Trading is not a Black-and-White Game
by Professional Trader Andy Jordan
Educator for Spreads, Options, Swing/Day Trading, and
Editor of Traders Notebook Complete and Traders Notebook Outrights
Many traders seem to have trouble understanding this concept. They cannot get their mind around it. Some are able to attain a composed calm and harmony when they are winning, but go berserk when losing. Others become defeatist when things turn bad. Still, others become resigned or go on tilt in various ways.
They try to abolish losing completely from their trading, and do everything in their power to avoid it. The solution they choose is to tighten up their trading to the nth degree. But unfortunately, swings in fortune are part of the game and need to be included. They must be worked with and controlled, not eliminated.
This attempt to turn trading into a black-and-white game goes like this: “I’ll trade absolutely safely. I will stay only in perfect trades, and if they are not perfect, then I’ll drop out.” On paper, this seems foolproof. The problem with this strategy is that you get trapped whenever you are in the gray areas (which is often). Trading is dynamic and constantly changing, with many rough edges. Trying to be too perfect is like trying to keep your clothing and life vest perfectly arranged during a river-rafting trip. You must roll with the water as it is moving along, not try to confine and control it!
Finally, there is also the frustration aspect that occurs if you try to banish all losses from trading. Stress occurs whenever a loss happens – anger, despair, indignation, outrage. Every trade becomes a life-and-death matter. This is the result of telling yourself that you must never fail. By including losses in the system, however, we anticipate them and thereby remove all the power from them. We are cool and composed; calmly factor them in, and move on.
"He who fears being conquered is sure of defeat".
- Napoléon Bonaparte
Happy trading,
Andy
© by Andy Jordan. Re-transmission or reproduction of any part of this material is strictly prohibited without the prior written consent of Trading Educators, Inc.
Check out our Blog!
To view previous published Chart Scan newsletters, please log in or click on "Join Us,"
shown above, to subscribe to our free "Members Only" section.
A WEALTH OF INFORMATION & EDUCATION:
Joe Ross-Trading Educators' popular free Chart Scan Newsletter has been published since 2004.
Note: Unless otherwise noted, all charts used in Chart Scan commentary were created
by using Genesis Financial Technologies' Trade Navigator (with permission).
Legal Notice and Copyright 2017 Disclaimer - Published by Trading Educators, Inc.
Chart Scan is a complimentary educational newsletter.
© by Trading Educators, Inc. Re-transmission or reproduction of any part of this material is strictly prohibited without prior written consent.
More...
Edition 688 - August 18, 2017

Trading Idea
by Professional Trader Andy Jordan
Educator for Spreads, Options, Swing/Day Trading, and
Editor of Traders Notebook Complete and Traders Notebook Outrights
This week, we're looking at short CLF18 – CLG18: short January and long February 2018 Crude Oil (NYMEX at Globex).

Today we consider a Crude Oil calender spread: short January and long February 2018 Crude Oil (elec. symbols: CLF18 – CLG18 or CLES1F8 on CQG). The spread has been in a down trend since the beginning of 2017 trading now close to the upper side of its down-trend channel. Because there is only one month of difference between the two legs, the risk is at a manageable level of about $300 per spread contract. The spread should gain stronger momentum regarding seasonality to the down-side in later months (October and later) but a trader might already now scale into the trade.
Do you want to see how we manage this trade and how to get detailed trading instructions every day?
Traders Notebook Complete
Please visit the following link:
Yes, I would like additional information!
© by Andy Jordan. Re-transmission or reproduction of any part of this material is strictly prohibited without the prior written consent of Trading Educators, Inc.
Chart Scan with Commentary - A Gold Trader
by Master Trader Joe Ross
Author, Trader, Trading Mentor, and Founder of Trading Educators, Inc.
Developer of Instant Income Guaranteed
This week I lifted the chart I want to show you from one of our students, and it shows you how he trades gold using only Traders Trick Entries. You’ll have to look closely to see the green and red dots
"I traded lots of gold lately and thought I should share this chart as an example of how nice TTEs [Traders Trick Entries] can work.
"It's a daily-chart of gold. It starts with a 1-2-3, where I luckily bought and I'm still in with 1/3 of my initial position using natural supports to trail my stop.
"The green dots shows TTEs that 'worked,' the red dots are TTEs that 'failed.' For me they worked when they reached the point of the RH where I usually take profits, and move my stop to break even, or did a large enough move to take some profit, and did not go below the last day's low where I trail my stop when getting into a position.
"Of course I wouldn't have traded all of those TTEs; some of them are much too near the RH so that they don't allow to take enough profit at the RH. Some don't look 'good', and some come too close together. But just if you had taken them blindly, you still would have won big using the right money-position-management."

Notice that he says, "Of course I wouldn't have traded all of those TTEs.” Over the years from our own experience and feedback from our students there have been a number of refinements made to the way we select and trade the TTE. You can discover the filters we use to achieve close to 90% accuracy when selecting which TTE to trade. The material is covered in an online webinar “The Traders Trick, Advanced Concepts.”
© by Joe Ross. Re-transmission or reproduction of any part of this material is strictly prohibited without the prior written consent of Trading Educators, Inc.
Trading Article - The Lottery Mindset
by Master Trader Joe Ross
Author, Trader, Trading Mentor, and Founder of Trading Educators, Inc.
Developer of Instant Income Guaranteed
Do you ever dream about winning the lottery? There are actually people who have such good luck that they repeatedly enter contests and win. They win so often that if they wanted, they could count on winning, even though they are essentially trying to capitalize on chance. They develop a "lottery mindset" in that they approach life by counting on rare chance events. The rest of us aren't so lucky, and we don't live our lives counting on a fluke like winning the lottery. We work hard, master a profession, and work steadily to make a living. In many ways, top-notch traders approach their profession in the same diligent way. They don't view trading as recreational gambling, and count on a fluke to make a profit.
Many people do experience key life-changing events. We have all heard of people who needed a lucky break and got it. You often hear of actors who with their last 50 bucks went on an audition and landed a job and ended up as a star of a hit sit-com. You probably know of friends who were desperately searching for a job for months, and needed a job fast! With only a week's worth of resources left, they found a job. It can also happen in sports. Olympic athletes may practice their entire life for "one moment in time" when they can perform at their best. But there is some luck involved. A family member may pass away or they may become ill, and it may throw them off their game. Sure, they have rare talents, but the Gold Medal winners are also lucky enough to have everything go their way. There are times when life can come down to a few key moments. It's a little like playing Lotto and hoping that you'll win.
Even though profitable traders don't approach trading as if they are playing the lottery, they all have at least one big winning trade in their careers. Do people make huge profits capitalizing on a once in a lifetime trade? Sure they do, but the question you need to ask yourself is, "Do I want to trade hoping to make all my profits on a fluke?" Do you want to approach trading with a lottery mindset? If you do, you'll always be on edge and you will have difficulty trading with discipline. You'll tend to take big chances, and you may end up losing big. It's better to trade more prudently. That doesn't mean never taking a risk or pushing yourself to invest a little more capital when you hit upon a winning streak. What it does mean, though, is controlling over-confidence. Don't seek out those one or two trades a year that will make up for all you've lost. There's an advantage to using a more methodical approach: Continue to search for solid, high probability trade setups, outline detailed trading plans, and trade prudently with unwavering discipline.
© by Joe Ross. Re-transmission or reproduction of any part of this material is strictly prohibited without the prior written consent of Trading Educators, Inc.
Instant Income Guaranteed - NTNX Trade
Philippe Gautier: Administration and New Developments
Developer: Joe Ross
On 16th July 2017 we gave our IIG subscribers the following trade on Nutanix Inc (NTNX). We sold price insurance as follows:
- On 17th July 2017, we sold to open NTNX Aug 18 2017 17.5P @ $0.175 (average price), with 31 days until expiration and our short strike 21% below price action.
- On 7th August 2017, we bought to close NTNX Aug 18 2017 17.5P @ $0.05, after 21 days in the trade.
Profit: $12.50 per option
Margin: $350
Return on Margin Annualized: 62.07%
When the trade was given, $VIX had closed at 9.82, a particularly low level historically. But by widening our choice of underlying stocks (a recently introduced stock in September 2016 in that case), we can still find safe trades with quite decent levels of premium.
We have also added new types of trades for our IIG daily guidance since 2016, "no loss" propositions with unlimited upside potential, still using other people's money to trade.
Philippe

Receive daily trade recommendations - we do the research for you!
Instant Income Guaranteed
♦ SIGN UP TODAY! THIS IS WORTH THE INVESTMENT ♦
© by Joe Ross and Philippe Gautier. Re-transmission or reproduction of any part of this material is strictly prohibited without the prior written consent of Trading Educators, Inc.
Trading Video - Q&A Episode 1: BID/ASK-Spread/Discipline in Trading
by Professional Trader Marco Mayer
Educator for Forex and Futures, Systematic Trader, and
Creator of Ambush Trading Method, Ambush Signals, and AlgoStrats.com
This first episode, Marco Mayer answers trading related questions sent in from viewers like you!
Feel free to This email address is being protected from spambots. You need JavaScript enabled to view it. your questions or whatever is on your mind about trading.
>
Happy Trading,
Marco
© by Marco Mayer. Re-transmission or reproduction of any part of this material is strictly prohibited without the prior written consent of Trading Educators, Inc.
Check out our Blog!
To view previous published Chart Scan newsletters, please log in or click on "Join Us,"
shown above, to subscribe to our free "Members Only" section.
A WEALTH OF INFORMATION & EDUCATION:
Joe Ross-Trading Educators' popular free Chart Scan Newsletter has been published since 2004.
Note: Unless otherwise noted, all charts used in Chart Scan commentary were created
by using Genesis Financial Technologies' Trade Navigator (with permission).
Legal Notice and Copyright 2017 Disclaimer - Published by Trading Educators, Inc.
Chart Scan is a complimentary educational newsletter.
© by Trading Educators, Inc. Re-transmission or reproduction of any part of this material is strictly prohibited without prior written consent.
Edition 687 - August 12, 2017
Chart Scan with Commentary - TLOC (The Law of Charts)
by Master Trader Joe Ross
Author, Trader, Trading Mentor, and Founder of Trading Educators, Inc.
Developer of Instant Income Guaranteed
For many years I have maintained that there is a law that governs the formation of charts. I call it The Law of Charts.
I don't know why charts behave the way they do, but I do know that if the underlying data consists of highs and lows, you will see 1-2-3s, areas of consolidation, and Ross hooks™.
My first understanding of the law came when I saw the formations with which so many are now familiar. To my thinking, the patterns we see on a price chart are caused by the action and reaction of humans to their perception of value. However, it took me some time to realize that what differed among charts was the impetus that caused them to form The Law of Charts patterns.
I first became suspicious of this when I could see that the line charts created by price spreads formed the same patterns as those formed on a bar chart. Spreads consisted of connecting the values at which the spreads closed from one day to the next. There was no high or low each day as with a bar or candlestick chart.
Then I came across a set of data for gas meter readings in Southern California. They, too, formed the patterns of The Law of Charts. It was then I realized that I was indeed looking at a law. Only the impetus was different. The law was a constant. The impetus in this latter set of data was usage. The usage of natural gas varied, thus giving it highs and lows.
A few years ago a trader in Germany sent me the chart you see below. It is a chart depicting water levels in the Elbe River. As you can see, The Law of Charts really does exist, and it really is a law - not a theory or a system as people often refer to it when they ask me about it. You do not trade The Law of Charts, you find a way to implement the fact it exists. The Traders Trick is one of many implementations that I have figured out.

© by Joe Ross. Re-transmission or reproduction of any part of this material is strictly prohibited without the prior written consent of Trading Educators, Inc.
Trading Article - Sensing Market Condition
by Master Trader Joe Ross
Author, Trader, Trading Mentor, and Founder of Trading Educators, Inc.
Developer of Instant Income Guaranteed
A market may be nervous when it goes into consolidation. It may be nervous when you see lots of dojis and flip-flopping – opening high one day and closing low, and then opening low and closing high the next day. A market may be nervous when it is backing and filling – opening on gaps and then filling in those gaps, or trading way up or way down, only to finish back where it started, or at an extreme opposite to the way it traded most of the day.
A market is illiquid when the tick volume is low for any given period, and this continues over a space of many periods. To know what normal tick volume is, you must study what it was during periods when you are able to trade normally with decent fills. It is illiquid when both open interest and daily volume are low. It is illiquid when the tick size is erratic, and you see many large ticks mixed in with smaller ticks.
A market is too volatile when it becomes a fast market. It is too volatile when slippage on fills is excessive regardless of whether this occurs when the tick size is excessive, the market is illiquid, or the market is frequently under fast market conditions. A market is too volatile when it shoots way up to an extreme high relative to where prices have been on a report or news item, and then right back down again to a relatively extreme low. The opposite is also true when the market shoots down first and suddenly reverses and moves up, with both moves to relative extremes.
All of the above have been true from time to time in all markets, almost all the time in some markets. It is best to trade with caution at those times or perhaps to not trade at all.
© by Joe Ross. Re-transmission or reproduction of any part of this material is strictly prohibited without the prior written consent of Trading Educators, Inc.
Instant Income Guaranteed - EXP Trade
Philippe Gautier: Administration and New Developments
Developer: Joe Ross
On 18th May 2017 we gave our IIG subscribers the following trade on Eagle Materials Inc (EXP). We sold price insurance as follows on a GTC order as we could not get filled initially at our minimum price:
- On 23rd May 2017, we sold to open EXP Jun 16, 2017 90P @ $0.65, with 23 days until expiration.
- On 9th Jun 2017, we bought to close EXP Jun 16 2017, 90P @ $0.20, after 17 days in the trade for quick premium compounding.
Profit: $45 per option
Margin: $1,800
Return on Margin Annualized: 53.68%
With implied volatility being so low, we often have to wait for a few days or more to get filled at our minimum price. We prefer to miss a trade rather than selling poor premium levels.
We have also added new types of trades for our IIG daily guidance since 2016, "no loss" propositions with unlimited upside potential, still using other people's money to trade.
Philippe

Receive daily trade recommendations - we do the research for you!
Instant Income Guaranteed
♦ SIGN UP TODAY! THIS IS WORTH THE INVESTMENT ♦
© by Joe Ross and Philippe Gautier. Re-transmission or reproduction of any part of this material is strictly prohibited without the prior written consent of Trading Educators, Inc.
Trading Article - Including Failure in Trading
by Professional Trader Andy Jordan
Educator for Spreads, Options, Swing/Day Trading, and
Editor of Traders Notebook Complete and Traders Notebook Outrights
Because of a random luck factor, it is possible for failure to raise its head at any moment. Consequently, we can’t sidestep or ignore it; we have to find a place for it in our overall system.
This is more profound than it seems. Any trader must be flexible enough to adapt not only to changing events, but also to the vagaries of chance, and the harmony continued in spite of it.
Trading, as it unfolds from the traders perspective, is experienced as an alternating of "in harmony" and "out of harmony" – things going right, things going wrong. These must be bracketed together and contained underneath the larger harmony.
Adapting to random surprise wrenches thrown into your plans, while still remaining in harmony, is the challenge of trading.
Including failure in our trading strategy also has another quality. It brings about humility. Factoring it into our trading means realizing that while we may win 50 percent of the time, we will also lose the other 50 percent – working with this fact rather then fighting it.
Defeats in trading are not really defeats, anyway — they are more like trial balloons we keep sending up, knowing in advance that a certain number of them are going to get shot down. Therefore, trading is really a process of two steps forward and one step back. The one step back part will always seem like a defeat, will always feel like a defeat, but is not a defeat – simply part of the process.
© by Andy Jordan. Re-transmission or reproduction of any part of this material is strictly prohibited without the prior written consent of Trading Educators, Inc.
Trading Video - Ambush Signals
by Professional Trader Marco Mayer
Educator for Forex and Futures, Systematic Trader, and
Creator of Ambush Trading Method, Ambush Signals, and AlgoStrats.com
In this video, I explain a service called Ambush Signals. What is the system, the idea behind it and how Ambush Signals makes trading Ambush so much easier!
Feel free to This email address is being protected from spambots. You need JavaScript enabled to view it. with any questions or whatever is on your mind about trading.
Happy Trading,
Marco
© by Marco Mayer. Re-transmission or reproduction of any part of this material is strictly prohibited without the prior written consent of Trading Educators, Inc.
Check out our Blog!
To view previous published Chart Scan newsletters, please log in or click on "Join Us,"
shown above, to subscribe to our free "Members Only" section.
A WEALTH OF INFORMATION & EDUCATION:
Joe Ross-Trading Educators' popular free Chart Scan Newsletter has been published since 2004.
Note: Unless otherwise noted, all charts used in Chart Scan commentary were created
by using Genesis Financial Technologies' Trade Navigator (with permission).
Legal Notice and Copyright 2017 Disclaimer - Published by Trading Educators, Inc.
Chart Scan is a complimentary educational newsletter.
© by Trading Educators, Inc. Re-transmission or reproduction of any part of this material is strictly prohibited without prior written consent.
Edition 686 - August 4, 2017

Chart Scan with Commentary - Cluster Breakouts
by Master Trader Joe Ross
Author, Trader, Trading Mentor, and Founder of Trading Educators, Inc.
Developer of Instant Income Guaranteed
In my book "Day Trading," I presented an idea for trading cluster breakouts in EUR/USD. This morning I was wondering if there were good cluster breakouts in other markets. I really needed to do some trading. When I go for a while without trading, the desire to do so becomes a persistent itch.
Lately, due to other commitments and activities, my trading time has been sparse and limited to experimentation with a stock trading idea which I continue to work on. This morning I took a look at Treasury Bonds to see if cluster breakouts would work well there. The chart shows what I discovered.
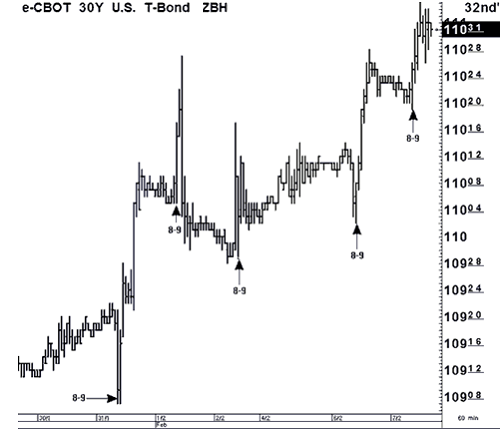
By cluster I refer to groups of rather small bars, more or less moving sideways. The idea is to wrap an envelope around the cluster and then trade a breakout of the envelope. I have marked the bars where the breakout occurred, and please note that these 60-minute bars all begin at the start of an hour, e.g., 8 AM to 9 AM.
It seems that in most cases, the move begins with the 8 AM bar or is completed by the 8 AM bar. Viewing from right to left, we see:
1. A violation of the cluster centered around 110^24 begins with the 8 AM bar and completes with the 9 AM bar.
2. The cluster centered around 110^11 is violated first by the 8 AM bar and later by the 11 AM bar.
3. The cluster centered around 110^02 is violated by the 8 AM bar.
4. The cluster centered around 110^07 is violated by the 8 AM bar.
© by Joe Ross. Re-transmission or reproduction of any part of this material is strictly prohibited without the prior written consent of Trading Educators, Inc.
Trading Article - Should you trade only one market?
by Master Trader Joe Ross
Author, Trader, Trading Mentor, and Founder of Trading Educators, Inc.
Developer of Instant Income Guaranteed
Restricting your trading exclusively to one market may not be your best choice. Here are some reasons why:
You must not trade under pressure. Trading involves being eclectic and choosing only the best, most clear-cut trades in liquid, not overly volatile markets.
It is sheer folly to trade feeling that you have to make a certain amount of money each day, or that you have to make up for a previous day. Each day is its own day, and must be viewed as such.
Trading is not a job. If you want a job, go out and find one. Trading is to be done leisurely, with plenty of time in-between during which you do not trade at all. You cannot possibly be at your best all of the time while sitting and watching a screen. The pros typically trade a short period of the day, usually around the open, and then again at the close. That's why they last as long as they do. For those who stay in the market because they act as market makers, they trade their own money only when they can take advantage of you for a few ticks at various times during the day. Otherwise, they stand aside, waiting to fill orders coming in from the outside, which is what they feel they have to do.
There can be benefit in position trading various markets using the weekly chart and entering via the daily chart. If you are going to be a trader, you are going to have to learn to be an all-around trader, always going where there is money to be made. If you are going to stick with only one market, then you are going to have to patiently sit out those times and periods when it is doing nothing.
This is not the first time in my life that I've been unable to easily day trade in a particular market. I have seen markets that were virtually not tradable for more than a year. At some point they once again become tradable. During those periods in which a market became not tradable, if I wanted to day trade I had to look elsewhere. There have been other periods during which I could not trade at all. I will repeat a story here that I've told at many seminars. There was a time in the early 1970s (yes, those were the olden days before there was day trading), when I was able to make only one trade in an entire year. It came in November, and it yielded the only money I made that year. I was able to trade the following year, and then again the markets became very difficult to trade, and many traders simply disappeared from the markets and went home broke. Such is the life of a trader. That is why I had to learn to trade what I could, where I could, and when I could. Trading in itself can be seasonal. There are dry spells from time to time. What saved my neck in those days of lean opportunity? Trading spreads on futures contracts.
© by Joe Ross. Re-transmission or reproduction of any part of this material is strictly prohibited without the prior written consent of Trading Educators, Inc.
Instant Income Guaranteed - XME Trade
Philippe Gautier: Administration and New Developments
Developer: Joe Ross
On 13th June 2017 we gave our IIG subscribers the following trade on SPDR S&P Metals & Mining ETF (XME). We sold price insurance as follows:
- On 14th June 2017, we sold to open XME Jul 28 2017 27P @ $0.24, with 44 days until expiration and our short strike 11% below price action.
- On 11th July 2017, we bought to close XME Jul 28 2017 27P @ $0.07, after 27 days in the trade.
Profit: $17 per option
Margin: $540
Return on Margin Annualized: 42.56%
Not all underlying stocks or ETFs go straight up after our entry. But as long as prices remain well above a well chosen short strike, the trade remains pretty safe and boring, like most of our trades.
We have also added new types of trades for our IIG daily guidance since 2016, "no loss" propositions with unlimited upside potential, still using other people's money to trade.
Philippe
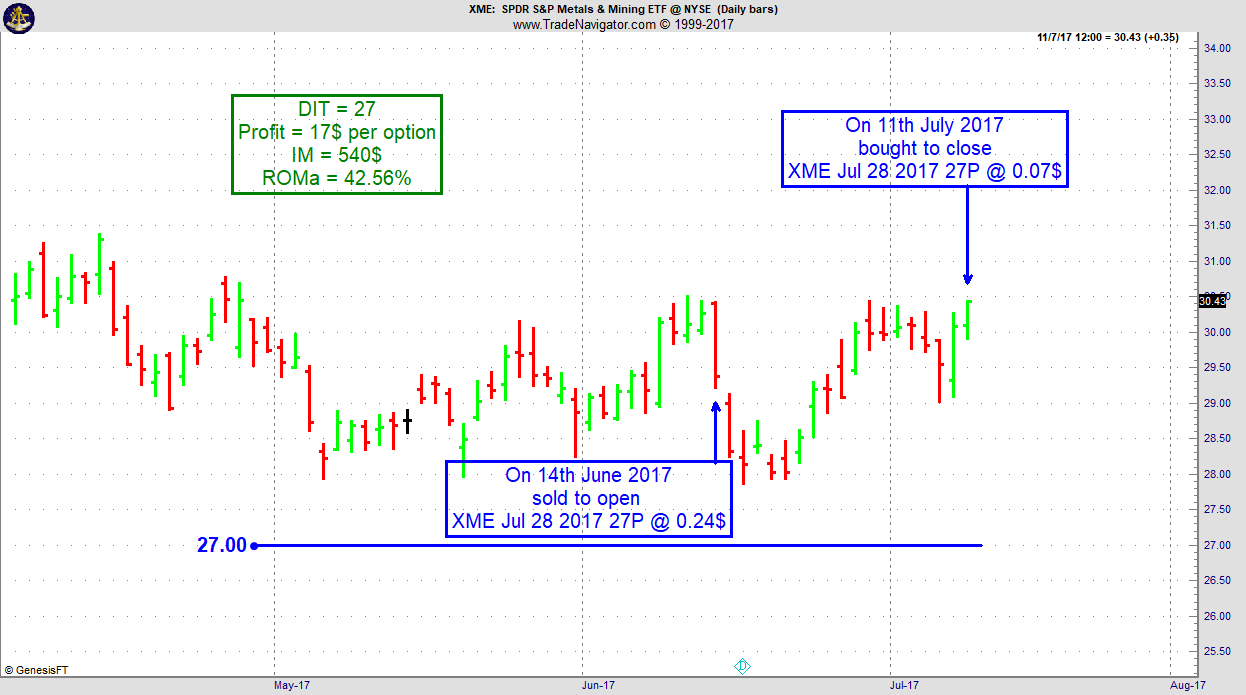
Receive daily trade recommendations - we do the research for you!
Instant Income Guaranteed
♦ SIGN UP TODAY! THIS IS WORTH THE INVESTMENT ♦
© by Joe Ross and Philippe Gautier. Re-transmission or reproduction of any part of this material is strictly prohibited without the prior written consent of Trading Educators, Inc.
Trading Idea - Long October Sugar #11
by Professional Trader Andy Jordan
Educator for Spreads, Options, Swing/Day Trading, and
Editor of Traders Notebook Complete and Traders Notebook Outrights
After a long down-move in Sugar from October 2016 until end of June, Sugar might be ready to push higher during the next few weeks or even months. On the daily chart below we can see, that we have entered an up-trend and after the break above 14.69 on Monday we might even move much higher at least up to 16.50.
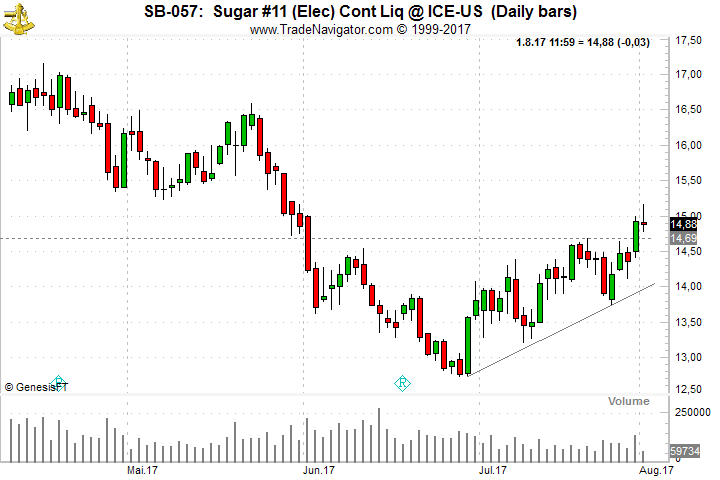
The main factor why we might see higher prices in Sugar comes from the net long positions of the Commercials which is the highest reading back to 1983.
Traders might want to put on a position on the re-test of the 14.70 level or simply put on a position at the current level.
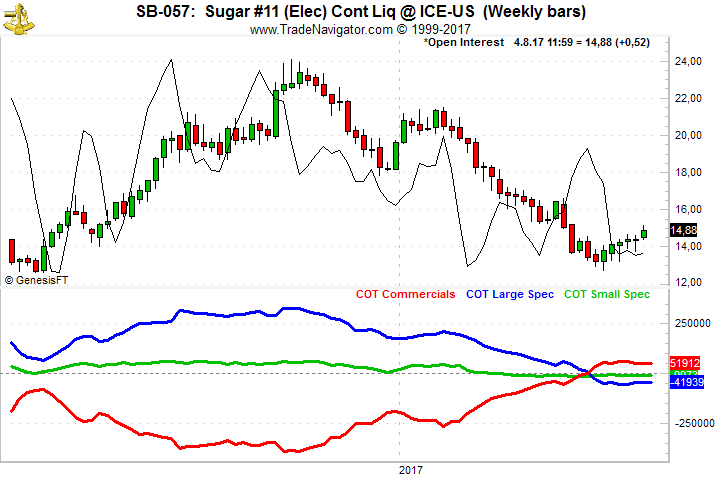
Do you want to see how we manage this trade and how to get detailed trading instructions every day?
Traders Notebook Complete
Please visit the following link:
Yes, I would like additional information!
© by Andy Jordan. Re-transmission or reproduction of any part of this material is strictly prohibited without the prior written consent of Trading Educators, Inc.
by Professional Trader Marco Mayer
Educator for Forex and Futures, Systematic Trader, and
Creator of Ambush Trading Method, Ambush Signals, and AlgoStrats.com
In this video, I talked about stop-losses in general, ways to decide on your stops that don't make much sense and other pitfalls like using breakeven-stops. Finally let me give you some insights on my own systematic approach regarding exits and how I like to decide where to put a stop-loss.
Feel free to This email address is being protected from spambots. You need JavaScript enabled to view it. with any questions or whatever is on your mind about trading.
Happy Trading,
Marco
© by Marco Mayer. Re-transmission or reproduction of any part of this material is strictly prohibited without the prior written consent of Trading Educators, Inc.
Check out our Blog!
To view previous published Chart Scan newsletters, please log in or click on "Join Us,"
shown above, to subscribe to our free "Members Only" section.
A WEALTH OF INFORMATION & EDUCATION:
Joe Ross-Trading Educators' popular free Chart Scan Newsletter has been published since 2004.
Note: Unless otherwise noted, all charts used in Chart Scan commentary were created
by using Genesis Financial Technologies' Trade Navigator (with permission).
Legal Notice and Copyright 2017 Disclaimer - Published by Trading Educators, Inc.
Chart Scan is a complimentary educational newsletter.
© by Trading Educators, Inc. Re-transmission or reproduction of any part of this material is strictly prohibited without prior written consent.
Edition 685 - July 28, 2017

Chart Scan with Commentary - Reversal Bars
by Master Trader Joe Ross
Author, Trader, Trading Mentor, and Founder of Trading Educators, Inc.
Developer of Instant Income Guaranteed
Let’s talk about reversal bars, which are important because they signify important changes in trends and swings.
Swings are much more common than are trends. Short-term to intermediate-term swings consist of a leg up and a leg down in the movement of prices. Long-term trends seem to be a thing of the past (unless driven by strong supply and demand factors), mainly because of the amount of information available to traders and also because of computerized and program trading.
I’ll explain more about swings, and then we can look closely at several types of reversal bars.
There are two basic configurations available for computerized trading:
- Trend analysis
- Value analysis
Both greatly affect what happens in today’s trading. Following is a somewhat simplified view of the outcome of these two types of computer-generated methods. Naturally, real supply and demand will always come into play when speaking of trends and swings.
There are only so many ways that anyone can detect a trend, especially when using a computer. What are the variables available for use? Open, High, Low, Close, Volume, and Volatility. There is little else of value.
These factors are integrated into moving averages of various kinds, but an examination will show little difference in the end result of each. We have:
- Simple moving averages
- Exponential moving averages
- Geometric moving averages
I suppose by now there are even others. Moving averages are often turned into oscillators by the simple process of detrending them.
Next comes the question: How many ways can you massage this handful of variables in order to come up with a way to detect a trend?
The conclusion of it all is that virtually all trend-finding techniques are correlated. As soon as one computer algorithm detects a trend, so do most other computer algorithms. The result is a mass of buying coming into a move up, and a mass of selling coming into a move down. Instead of prices trending, they begin to move in the direction of the momentum detected by the computer algorithms.
Now, what about the computers programmed for value analysis? As prices move strongly upward, those computers programmed to look for relative value suddenly discover that prices are now too high. The value computers issue a sell signal. Buying and selling collide massively in some type of topping formation. Ultimately, selling overcomes buying, and prices reverse direction. Within a short space of time the trend-following computers detect the fact that prices are now moving down. They enter the market by selling, and prices drop until the value-programmed computers detect that prices are now too low relative to where they have been before. Value-programmed computers issue a buy signal and the swing—consisting of an up-leg and a down-leg—is now complete.
I admit this is a somewhat simplified view of what takes place, and, as mentioned earlier, a trend in either direction driven by true supply and demand factors will generally defeat the value-programmed computers so that the trend in prices will continue.
Regardless of whether prices turn at the end of a trend or whether they reverse as a result of the exhaustion of supply-demand factors, the turn is often marked by a reversal bar. Let’s look at those now. There are a number of different types, but all have a high degree of reliability and are generally low risk trades, due to the fact that a tight protective stop can be used.
In all cases of reversal bar entry signals, the best and most reliable signals take place after a strong swing or trend.
Reversal bars occur in all markets and in all time frames. Reversal bar moves generally are relative to the time frame involved. As a rule, the longer the time frame, the greater the move will be in the opposite direction. Such resulting momentum is naturally expected—a reversal bar on a monthly chart is logically greater than a similar move on a five-minute chart.
Key Reversal Notes:
- After an up-move:
- The Close must be lower than the previous bar’s Low
- The price bar must make a new High
- The Open must be higher than the previous bar’s High
- After a down-move:
- The Open must be lower the previous bars’ Close
- The bar must make a new Low
- The Close must be higher than the previous bar’s High
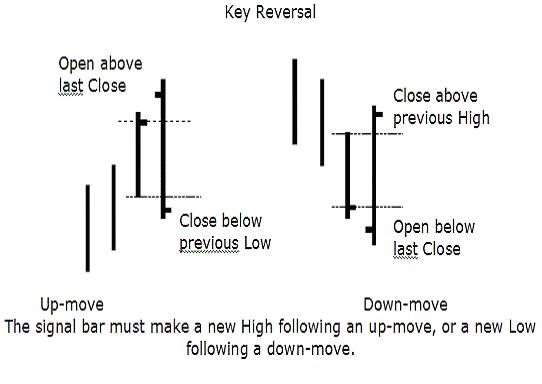
Island Reversal Notes:
- After an up-move:
- The bar’s Low is higher than the High of previous price bar and the following price bar (a gap on both sides of the reversal bar).
- The bar’s Low is higher than the High of previous price bar and the following price bar (a gap on both sides of the reversal bar).
- After a down-move:
- The bar’s High is lower than the Low of the previous price bar and the following price bar (a gap on both sides of the reversal bar).
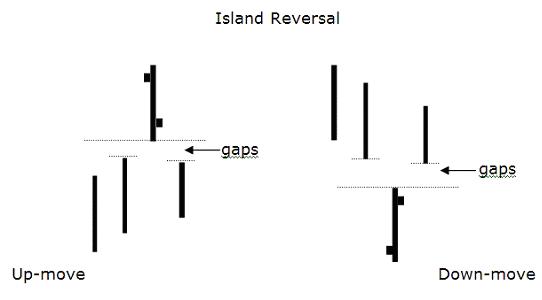
Spike Reversal Notes:
- A Spike High reversal after an up-move:
- Displays a High considerably above the price bars on either side.
- An Open higher than the Close.
- A Spike Low reversal after a down-move:
- Displays a Low considerably lower than the price bars on either side.
- An Open lower than the Close.
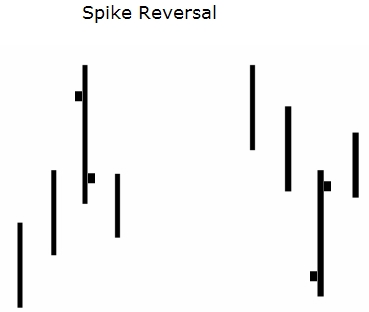
Reversals show a change in direction. Either the change is real or it isn’t. This is why you want to use a tight protective stop in trading them. You don’t want to give such trades much room. However, the percentages are definitely with you on reversal bars, so do a bit of testing for the market and time frame you wish to trade. You should be able to come up with a percentage of times that reversal bars will work in your favor.
I’ve shown the three basic types of reversals. There are of course, variations of these three. You can make your trading life much simpler by learning to use the Law of Charts and the Traders Trick entry. You might also want to consider taking one of our “Recorded Webinars”.
© by Joe Ross. Re-transmission or reproduction of any part of this material is strictly prohibited without the prior written consent of Trading Educators, Inc.
Trading Article - Contrarian Trader
by Master Trader Joe Ross
Author, Trader, Trading Mentor, and Founder of Trading Educators, Inc.
Developer of Instant Income Guaranteed
Being a contrarian trader means not just following the crowd. It means being willing to break the rules when necessary!
Statistics show that the “crowd” loses close to 80% of the time position trading, and very close to 90% of the time day trading. Why would anyone want to do what all those people are doing?
So, what is it the crowd is doing? For the most part they are struggling with Fibonacci numbers, a variety of indicators—some of which are proffered as having magical qualities—reading books by authors who never made it as traders, and thrashing around with mechanical trading systems, which are said to work all the time, when it is plain as the nose on your face that such a thing is impossible.
It seems that considering the high percentage of losers in this business you are repeatedly being warned that trading isn’t all that easy, and truthfully, it's much harder than it looks.
Think about it for a minute: If trading were easy, if it were really possible to make a lot of money quickly being a trader, why would anyone want to be a plumber, or an electrician, or an engineer, or ….
It seems that many traders fall into two categories. The first category is the wild gambler, who thinks rules have no meaning and wonders why anyone would try to set them. At the other extreme is the absolute conformist who tries to exactly follow the rules, as if there were some great virtue in doing that.
Have you ever run into a system trader who will boastfully tell you how proud he is of having stuck to a system with great discipline, following it exactly until he lost all his money? Bragging about his discipline as though it had some sort of virtue to it? In reality, that kind of trader is a lemming who happily runs off the edge of a cliff only to drown in a sea of his own stupidity.
Neither extreme is the best for trading. You don’t want to be a total rule breaker and you don’t want to be a total rule follower, and for sure you don’t want to follow the crowd because the crowd is usually wrong.
As a trader, you have to find the right balance between extremes—breaking and following rules—and following or not following the crowd. It takes maturity derived from trading experience, self-examination and a solid concerted effort to act independently, and it is essential to develop this skill in both those areas.
Following the crowd is a natural human tendency. It appears that there is safety and comfort in numbers. But such a situation is certainly not true in trading. Group dynamics just don’t seem to work very well when it comes to trading the markets. From time to time there have been partnerships that worked, but they are few and far between. In all the years I’ve been in the markets, I’ve known only one partnership that worked, and it was structured in such a way that one person did all the research and the other person made the trading decisions and performed the actual trading. Nevertheless, people somehow feel secure when they follow the crowd.
I grant you that not everyone follows the crowd in the same way or to the same degree, but it is the contrarian who views the crowd to see what they are doing, and then does the opposite. In my own case, I am contrarian in the following way: When everyone is hot to trade the e-minis, I avoid them, preferring to trade where the crowd is not looking. I find lots of great opportunities by looking around, being eclectic and discovering trades that meet my criteria for profit potential, tradability, and personal comfort.
I tend to be adaptive most of the time, adapting my trading management to setups offering me high potential for successful trades.
When the mob is losing their shirts in the e-mini, I am trading options with at least a 75% chance of producing a winner. When the crowd is thrashing around trying to daytrade forex, I am trading spreads with at least an 80% chance of bringing home a profit. I am not averse to trading anything, anywhere. I trade Exchange Traded Funds and individual shares. Why not? Some of them have excellent potential.
I find that instead of searching for opportunity, most of the people losing money in the markets are looking for rules to follow, indicators to dream up, and systems to pursue. The crowd spends an inordinate amount of time backtesting.
If you are going to trade, it is time to matriculate to the real world of trading. We are no longer in school or on the job where to be successful, it was critical to follow the rules and it might have been essential to protect your self-interests and stay within the parameters of acceptable behavior. In school and on the job it was important to develop a clear sense of individual values so that you could be somewhat self-sufficient within the boundaries of the group.
The contrarian trader is eclectic to the extent that he or she can follow the crowd when it seems right, but go his or her own way when it's necessary to protect self-interests. What the contrarian trader does that others will not or cannot bring themselves to do, is to go the opposite way when it seems that everyone else is going the same way.
Time and again history has proven that when everyone is buying and a market seemingly will never stop going up, that is the time to sell. And when something has sold down to the point where no one wants it and the media are all screaming out that it is the end for this market then it is time to take a trade the opposite way from the crowd, and become a buyer—that is what it means to be a true contrarian.
Contrarian traders heed the frequent warnings about the pitfalls of following the crowd. When no one wanted gold and the media screamed about how gold was a relic whose time had passed into history, it was buying time. When everyone was selling the Nasdaq and the media screamed “end of the world for tech stocks” it was again time to buy.
When you read in the media that a market it too volatile and too dangerous for trading and they flash warnings for their readers to stay out, that is the time to be looking to be an option seller. Options sellers make money by selling volatility. If you are a contrarian option trader, you aren't looking for safe markets. You are looking for volatility, reasonable risk, and a good chance for making a big profit. Most of the time, it means going your own way—the way that is opposite the mob.
Being a contrarian requires thinking like a contrarian, guessing what the crowd will do next, and anticipating how the movement of the crowd can benefit your trading.
When virtually everyone has taken the position that the market is headed in a particular direction, who is going to be left to push the trend further? It is precisely then that a countertrend begins and moves the market in the direction of the contrarian trade. The challenge is predicting when that turning point will occur, anticipating it, and developing a trading plan to capitalize on it.
© by Joe Ross. Re-transmission or reproduction of any part of this material is strictly prohibited without the prior written consent of Trading Educators, Inc.
Instant Income Guaranteed - PKX Trade
Philippe Gautier: Administration and New Developments
Developer: Joe Ross
On 28th June 2017 we gave our IIG subscribers the following trade on Pohang Iron & Steel Co (PKX). We sold price insurance as follows:
- On 29th June 2017, we sold to open PKX Aug 18 2017 50P @ $0.30, with 49 days until expiration and our short strike 20% below price action.
- On 17th July 2017, we bought to close PKX Aug 18 2017 50P @ $0.10, after 18 days in the trade
Profit: $20 per option
Margin: $1,000
Return on Margin Annualized: 40.56%
With implied volatility extremely low, we still managed to sell price insurance 20% below price action and well below a major support level, making the trade particularly safe.
We have also added new types of trades for our IIG daily guidance since 2016, "no loss" propositions with unlimited upside potential, still using other people's money to trade.
Philippe
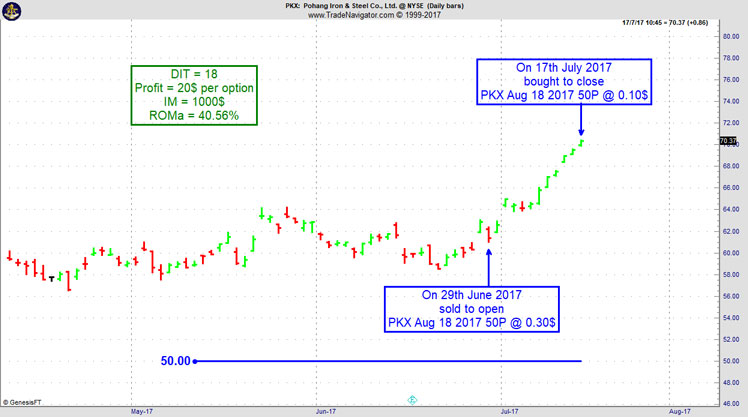
Receive daily trade recommendations - we do the research for you!
Instant Income Guaranteed
♦ SIGN UP TODAY! THIS IS WORTH THE INVESTMENT ♦
© by Joe Ross and Philippe Gautier. Re-transmission or reproduction of any part of this material is strictly prohibited without the prior written consent of Trading Educators, Inc.

Latest Blog Post - Admit When You Are Wrong
by Professional Trader Andy Jordan
Educator for Spreads, Options, Swing/Day Trading, and
Editor of Traders Notebook Complete and Traders Notebook Outrights
Does this trading path sound familiar to you? Read more.
© by Andy Jordan. Re-transmission or reproduction of any part of this material is strictly prohibited without the prior written consent of Trading Educators, Inc.

Trading Video -Marco's Q&A: Pinbars, Forex Brokers & 5-Min Charts
by Professional Trader Marco Mayer
Educator for Forex and Futures, Systematic Trader, and
Creator of Ambush Trading Method, Ambush Signals, and AlgoStrats.com
I will answer some follow-up questions of a past video related to Pinbars, give recommendations on Forex brokers and why it's so hard to trade successfully on a 5-min chart. Enjoy!
Feel free to This email address is being protected from spambots. You need JavaScript enabled to view it. with any questions or whatever is on your mind about trading.
Happy Trading,
Marco
© by Marco Mayer. Re-transmission or reproduction of any part of this material is strictly prohibited without the prior written consent of Trading Educators, Inc.
Check out our Blog!
To view previous published Chart Scan newsletters, please log in or click on "Join Us,"
shown above, to subscribe to our free "Members Only" section.
A WEALTH OF INFORMATION & EDUCATION:
Joe Ross-Trading Educators' popular free Chart Scan Newsletter has been published since 2004.
Note: Unless otherwise noted, all charts used in Chart Scan commentary were created
by using Genesis Financial Technologies' Trade Navigator (with permission).
Legal Notice and Copyright 2017 Disclaimer - Published by Trading Educators, Inc.
Chart Scan is a complimentary educational newsletter.
© by Trading Educators, Inc. Re-transmission or reproduction of any part of this material is strictly prohibited without prior written consent.

